Overview
Riverbed® SteelCentral™ NetIM is an integrated solution for mapping, monitoring, and troubleshooting your IT infrastructure. With NetIM, you can capture infrastructure topology information, detect performance issues, map application network paths, diagram your network, and troubleshoot infrastructure problems. Additionally, you can manage infrastructure issues within the context of application, network, and end-user experience for a blended view of overall performance.
NetIM version 2.x represents NetIM’s next generation and a major change from previous releases in terms of scalability, software architecture, and deployment. NetIM 2.x is available for installation on VMware ESXI hypervisors, and Azure and Amazon Web Services. For information on supported versions,
see the installation guide on the support site.
NetIM 2.x no longer supports installations on Windows platforms.
For more information see
Migrating to
SteelCentral NetIM v2.3.x on the support site.
NetIM provides agentless infrastructure component monitoring to deliver a comprehensive picture of how your infrastructure is affecting network and application performance and how that impacts end-user experience.
NetIM offers a broad overview of how the devices on your network are performing to complement your network and application performance management visibility. NetIM supports the following:
• Real-Time Monitoring – NetIM leverages multiple approaches (for example, synthetic testing, SNMP, CLI) to identify new and changed infrastructure components.
• Analytics – Measure current performance and identify violations.
• Topology and Paths – Visualize and triage issues quickly.
• Troubleshooting – Search-based workflows and on-demand network paths help you to quickly identify and troubleshoot infrastructure performance issues.
• Event and Alert Visibility – Configure alerts based on metric threshold violations, syslogs, and traps and use the Alerts page to view, filter, and drill-down into details.
• Reporting – Report on infrastructure inventory, configuration, and performance metrics.
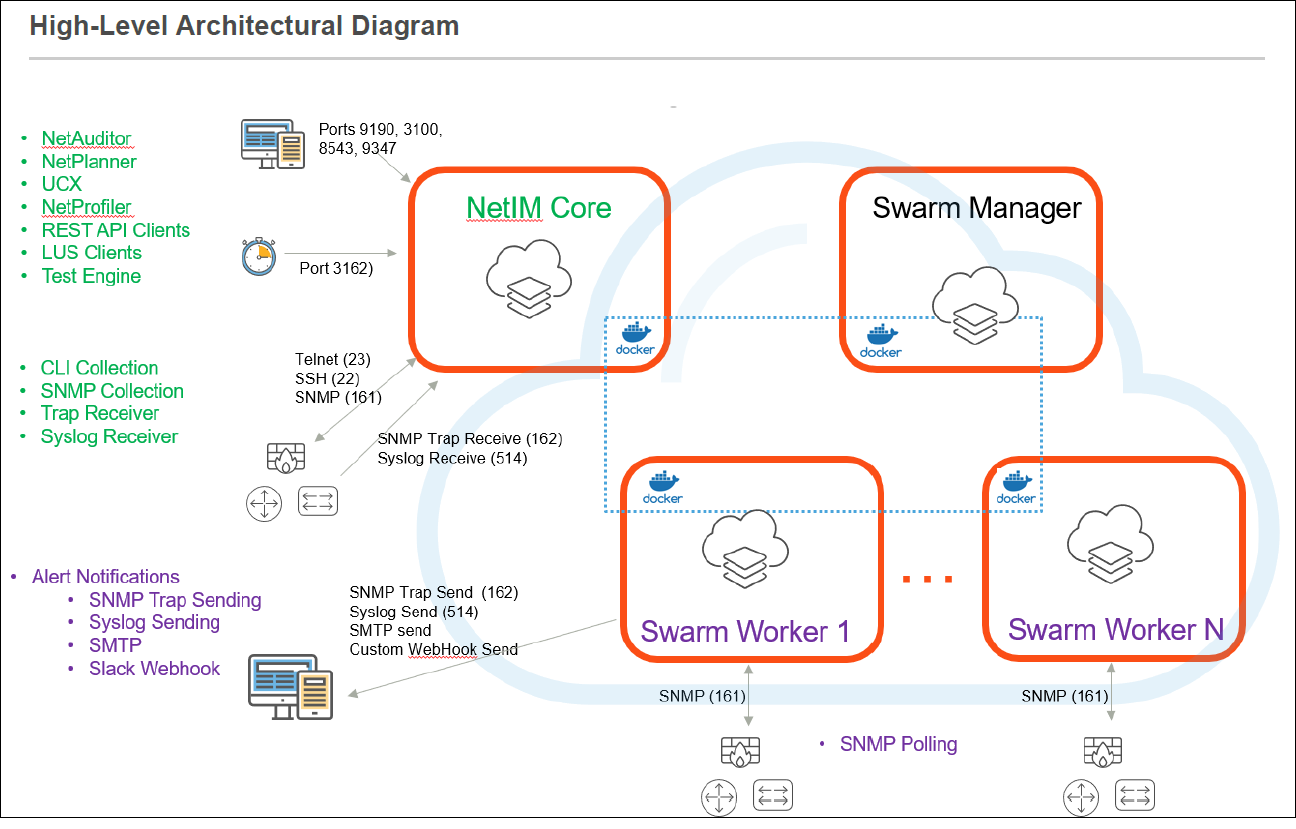
The following diagram shows the 2.x NetIM architecture, with NetIM deployed on an ESXI hypervisor in a Docker Swarm. For information on Docker Swarms, see the
Docker documentation.
The Docker Swarm is transparent to the user and requires no maintenance or administration.
For more information on the benefits of NetIM, including use cases, white papers, and videos, see the
Riverbed NetIM product page.
Logging in to the NetIM UI
Once the NetIM server has been installed and configured, you can login to the NetIM UI through a supported web browser. If necessary, contact your site administrator for credentials.
For more information on installing and configuring the NetIM server and the list of supported browsers,
see the installation and migration documentation on the support site and
Setting Up NetIM.
To log into the NetIM UI, follow these steps.
1. In a supported web browser, enter the URL for the NetIM UI, as follows.
http://<fully-qualified_domain_name OR IP_Address>:8543
Example: http://netim_server.yourcompany.com:8543
2. Enter your login credentials.
NetIM supports multiple authentication servers including:
– Local Authentication
– SAML 2.0-compliant Identity Providers
– TACACS+ integration
Depending on how your NetIM deployment is configured, you may be presented with one or more authentication choices on the NetIM login page. The following screen shows NetIM configured to authenticate with two types of authentication servers.
To login, first select your authentication choice by clicking the SAML, TACACS+, or Local Authentication heading. Your choice will be highlighted in orange. For Local Authentication and TACACS+, enter your credentials and login.
For SAML, select your SAML server by clicking the appropriate button and you will be redirected to your SAML server for login credentials.
Note the following:
– About Secure Communication
When you install NetIM, you specify the HTTP and HTTPS ports. The default ports are 9190 and 8543 for HTTP and HTTPS, respectively. NetIM is configured to use HTTPS by default.
– About Monitor Resolution
Display resolution for your monitor must be set to 1280x1024 or higher for correct operation of NetIM’s UI. The complete system requirements are available on the Riverbed Support site,
support.riverbed.com.For security reasons, be sure to log out after completing your session. To log out, click Sign Out in the upper-right corner of the screen.
– About Multiple Admin Users
If multiple users are logged into NetIM with the admin role, a visual warning is displayed in the upper right corner of the UI, as shown in the following screen:
Initialization
As NetIM initializes three orange dots appear on the UI display as a progress indicator when the client-side model is initializing, as shown in the following screen:
If you hover over the orange dots a message displays, showing what has been initialized and what remains to be initialized.
Introduction to the NetIM Home Page
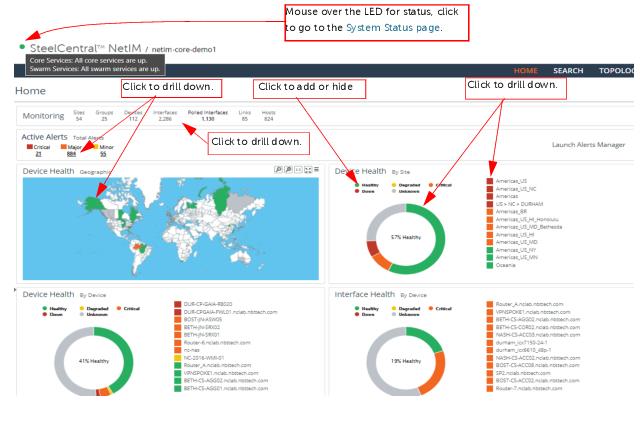
The Home page provides a high-level summary of the health of your network. The following figure shows an example of the NetIM screen for an administrative user. From this page, you can start any workflow, including
• Drilling down to more information about the health and status of devices in your network
• Launching a number of other options, such as the Topology Viewer, from the menu bar
• Changing the time window of data displayed on this page
For information on adding and configuring panels on the
Home page, see
Working With Custom Views.
To drill down for detailed status you can click on a slice of the circle graph or a square status indicator or an area in the Geographic panel. You can also click on a circular status indicator to remove it from the circle graph.
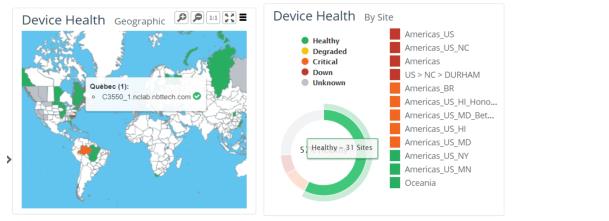
Additionally, you can get mouse-over status on the Geographic panel and graphs, as shown in the following screen:
Also, you can click the Launch Alerts Manager link in the right corner of the Active Alerts frame to bring up the Alerts Manager page, as shown in the following screen:
For more information about working with the
Home page, see
Monitoring the Health and Status of Your Infrastructure.
Additional Pages of Interest
In addition to the Home page, the following pages are also available to monitor network data:
• Topology Viewer
The
Topology Viewer lets you see a live diagram of your network, and offers filtering, drill-down to more information, and print capabilities. Choose
TOPOLOGY from the menu bar to open the
Topology Viewer. For more information, see
Navigating Topology.
• AppNetwork Path Analysis
AppNetwork Path Analysis lets you determine the route being taken between a source and destination, with the option to also see the reverse path. For more information, see
Using AppNetwork Path Analysis.
• Metric Page
The
Metrics Page lets you visualize selected metrics on devices and interfaces on which polling is enabled. For more information, see
Using the Metrics Page.
• Alerts Manager
The
Alerts Manager gives you a way to see the “big picture” of the events, alerts, syslog entries, and traps that occur in your infrastructure and to focus on specific events of interest. For more information, see
Viewing Alerts.
Printing Pages
You can quickly print most of pages using the quick print button

in the upper right corner of each page, as shown in the following screen:
Additional Options Available to Administrative Users
You must have administrator privileges to use the following screens.
• Device Manager
The Device Manager, CONFIGURE->Device Manager, provides an administrative view for the following:
– Device entries (which contain device and vendor information and credentials needed to connect to a device)
– Polling profile and alert(s) assigned to each device
– Connection statistics for recent connection attempts by NetIM to collect device data using SNMP
• System Event Dashboard
The System Event Dashboard provides an immediate view of current events from the network and NetIM. To access the System Event Dashboard, navigate to CONFIGURE->All Settings->Administer->System Event Dashboard.
• Poller and Collection Status
The Poller and Collection Status screens show the poller results, as well as collection progress. To access the Poller and Collection Status screens, navigate to CONFIGURE > Administer->Poller|Collection Status.
• Settings
The Settings page provides control over NetIM system properties and configuration and is the interface used to configure the product. To access the Settings page, navigate to CONFIGURE->All Settings.
• Core Server Management
The Core Server Management page provides access to server status, debug settings, the ability to start/stop server processes, view memory and event information, and manage clients. To access the Core Server Management page, navigate to CONFIGURE->All Settings->Administer->Core Server Management.
Menu Options
The menu options, which persist across the top of the UI, provide access to NetIM options, as shown in the following image map:
The following table explains the menu options.
Menu | Options |
HOME | |
SEARCH | Displays the Search page. For more informations, see
Using Search. |
TOPOLOGY | Displays the Topology Viewer. For more information, see
Navigating Topology. |
METRICS | Displays the Metric Navigator. For more information, see
Using the Metrics Page. |
ALERTS | Displays the redesigned Alerts Manager. For more information, see
Viewing Alerts. |
MORE | • IP SLA - Opens IP SLA page. For more information, see
IP SLA Views. |
CONFIGURE | • All Settings - Displays the Settings page with the complete list of utilities available for your role. |
Settings Page | Discover Monitor Alert – Notification Templates. Allows advanced power users to view default and create/edit new Notification Templates that can be assigned when creating alert notifications. This is not a recommended task to perform without assistance. For more information,
“Contact Technical Support“. The NetIM notification templates utilizes the ThymeLeaf template framework
(https://www.thymeleaf.org/) and is a very advanced feature NetIM provides many out-of-the-box sample templates for you to clone and tweak/edit. The system-defined templates should cover most of your needs or require only minimal editing to support your use-cases. Your most common use-case might be to select another system-defined template as the default template for a notification type and object type. To support your template creation and editing, the Notification Templates page contains contextual help on the objects and attributes that can be used in your template. |
Settings Page | Organize |
| Customize Integrate |
Settings Page | Administer |
HELP | • User Guide - Displays the product documentation. • A PI Documentation - Displays landing page for all API documentation. For more information, see
Supported APIs. • Legal Notices - Displays the copyright notices, patent numbers, and third-party software copyright notices for this product. • About - Displays software version information. |