Using the System Event Dashboard
The System Event Dashboard provides an immediate view of current events from the network and NetIM. You can see top level status, you can navigate down to specific status events, and you can see events in full detail. The System Event Dashboard also includes a Message Center to display the Message of the Day.
NetIM stores these events in the NetIM database. Events are stored in NetIM until they are removed by the Event Maintenance Service component of System Maintenance. In the default configuration, events are retained for two weeks.
This section includes the following topics:
Using Dashboard Controls
To access the System Event Dashboard, navigate to CONFIGURE-> All Settings->Administer-> System Event Dashboard.
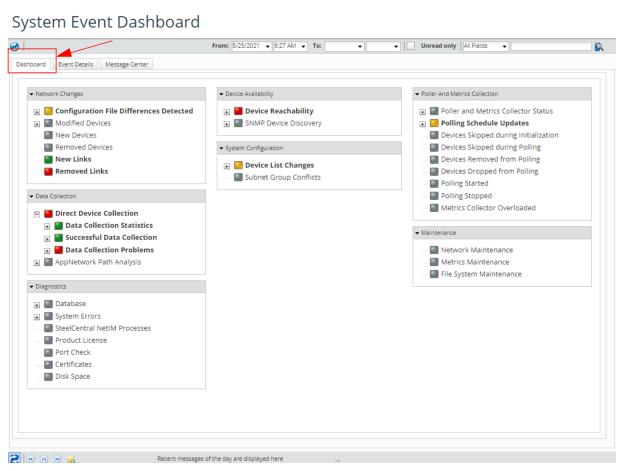
The following screen appears:
The System Event Dashboard includes the following tabs:
•
“Dashboard tab"—LEDs for different categories of status information and events. You can navigate trees of LEDs to find a specific event. For example, if a status LED is red, you can navigate down its tree to find which event is causing the problem.
Refreshing System Event Dashboard Display
The System Event Dashboard refreshes to show the latest status of events. You can specify automatic refresh, or manually refresh the display when you want.
To manually refresh the display, click the
Refresh (

) icon at the top-left of the display.
To toggle manual/automatic refresh, click the
Auto Refresh (

) icon at the bottom-left of the display. The icon is grayed when Auto Refresh is off.
Filtering System Event Dashboard Display
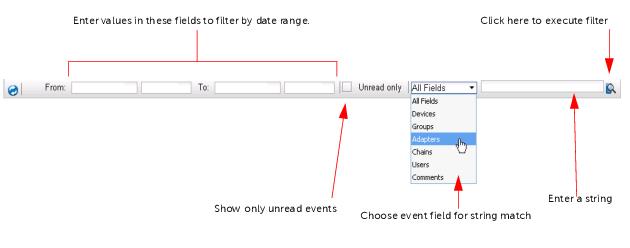
At the top of the System Event Dashboard, you can use controls to filter which events the dashboard will display. You can filter events by:
• Date range—Show events within a specified range
• Acknowledged status—Show or hide events you have already acknowledged as read
• Event contents—Show events with a string match in the chosen field (you can use wild card characters)
The criteria you enter affect the display for all tabs of the System Event Dashboard.
System Event Dashboard Filter Controls
Viewing the Message of the Day
You must have administrative privileges to add a new Message of the Day.
The System Event Dashboard includes a tab for managing the message of the day. However, you can view the message of the day at the bottom of any of the dashboard tabs. The display includes controls to display the previous or next message, or to play through the messages of the day.
Message display at the bottom of the page includes the message text and the author of the message. If the whole message does not appear at the bottom of the display, click the ellipsis to open the Message of the Day dialog box, as shown in the following screen:
Dashboard tab
The Dashboard tab provides a top-level view of NetIM status, and provides the means to navigate down to root-cause events, as shown in the following screen:
The accordion boxes for categories include:
• Network Changes
• Data Collection
• Diagnostics
• Device Availability
• System Configuration
• Poller and Metrics Collection
• Maintenance
Within each accordion box, the Dashboard include a set of LEDs to show the status of specific events in that category. Some events show trees of LEDs so you can navigate to child LEDs.
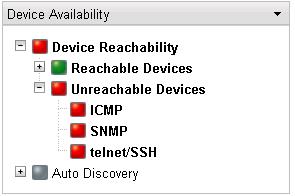
By default, an LED shows the worst case status of its children. If one of many children is red, then the parent LED will be red. For example, in the following figure you can see a problem with Device Reachability, and you can see that the root cause is represented by the ICMP, SNMP, and telnet/SSH LEDs., as shown in the following screen:
To see the details about any event, double-click the event or its LED to jump to the Event Details tab. When the Event Details tab appears, the chosen event will have the focus.
Event Details tab
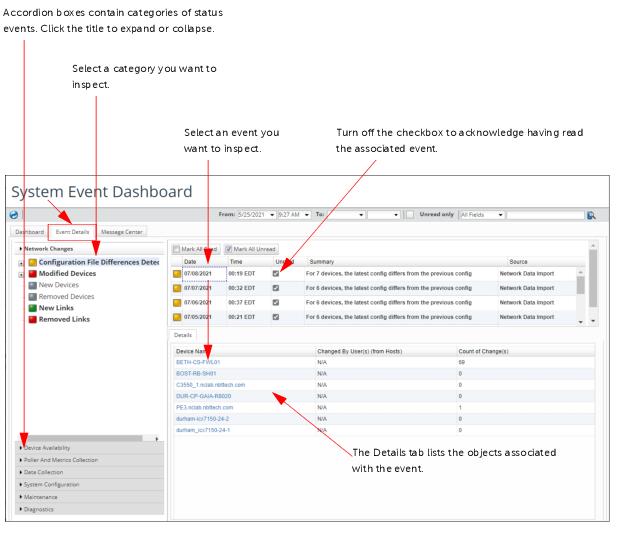
The
Event Details tab, as shown in the following screen, lists each event in detail. It lists the event LEDs in accordion boxes that use the same categories as the
“Dashboard tab". You can expand an accordion box and navigate the trees of LEDs to see the events for each one.
Each event entry includes the following fields:
• Date—The date the event occurred
• Time—The time the event occurred
• Unread—If this is checked, the event has not been acknowledged. Uncheck this field to acknowledge the event.
• Summary—A brief description of the event.
• Source—The data source for the event.
• Comment—An optional comment you can edit for the even.
Message Center tab
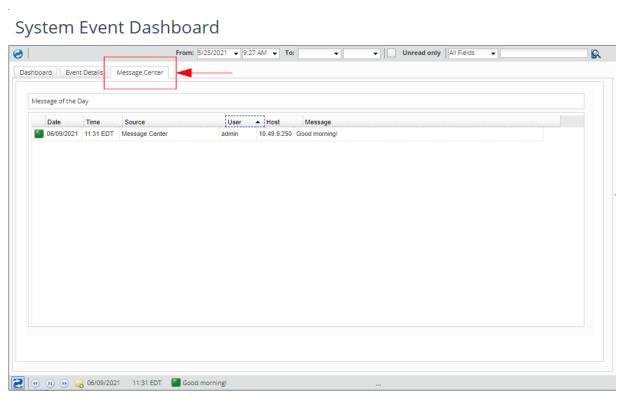
The Message Center tab shows the message of the day. This is a brief message that can be posted by the NetIM administrator., as shown in the following screen:
To create a message, you must be logged in to NetIM as an administrator.For more information, see
“Viewing the Message of the Day".
You can view a list of messages that have been posted to this machine. In addition to the message body, each message includes the following fields:
Date and Time—The date and time that the message was posted.
Source—The solution from which the message was posted.
Host—The IP address of NetIM on which the message was posted.
User—The username of the person who posted the message.
Message—The body of the message.
When you add a message, NetIM automatically provides the values for Date, Time, Source, Host, and User.


 ) icon at the top-left of the display.
 ) icon at the bottom-left of the display. The icon is grayed when Auto Refresh is off.