Monitoring the Health and Status of Your Infrastructure
This section explains how health is calculated and how you can drill down to the root cause of a problem.
NetIM lets you view your entire monitored infrastructure and quickly assess its health before you even click a button. The health of a device and its interfaces is determined by comparing a selected set of metrics against default thresholds, where the thresholds have the same values as those used in the Default Alert Profile. The health of a site's devices is aggregated to the site level. Similarly, the health of a device's interfaces is aggregated both to the device level and then up to the site and group level.
This section contains the following topics:
The Home Page and Health
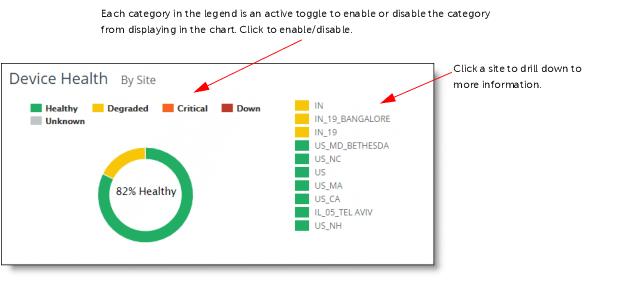
The NetIM Home page is your starting point when you log in to NetIM. Health for your monitored infrastructure is aggregated and reported using live charts. From these charts, you can drill down to get more granular information on the health of individual elements in your network. From the home page, you can quickly begin your monitoring and troubleshooting workflows.
The following is a partial list of what you can find on the Home page.
• What is the health status of my sites?
• How many and which devices are experiencing problems?
• Have any device configurations changed?
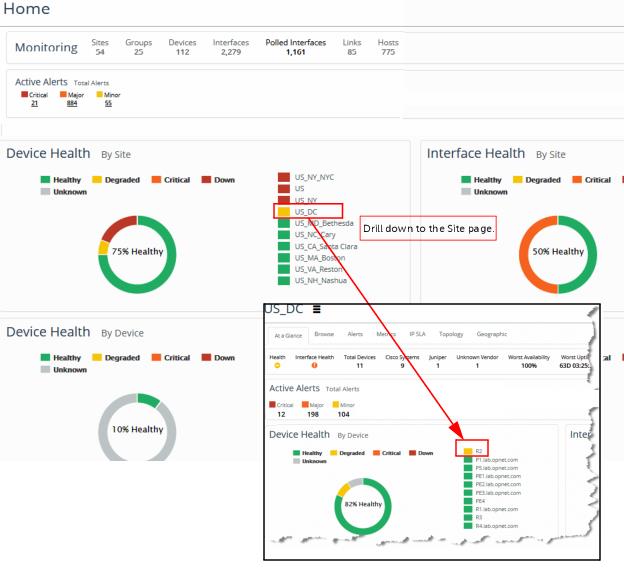
The following screen shows an example of a site in a degraded state (yellow coloring). We begin troubleshooting by drilling down to find out more information about the objects in this site. In this example we click on the site link for “US_DC” on the Home page, which takes us to the “US_DC” site page, where we see that a router, “R2”, is in a degraded state. The site inherits its health status from this degraded device.
Related Topics
Health Degradation Root-Cause
You can rapidly drill down to the root cause of group, site, device, and interface health degradation by clicking through to the degraded object’s At-a-Glance page and clicking the Health and Interface Health indicator icons in the information ribbon. For a group or site, you can immediately determine the degraded assets and then drill into the specific asset, as shown in the following screen:
For a device or interface, you can immediately determine the metric causing the degradation, as shown in the following screen:
How is Health Calculated?
Health is determined from threshold violations of polled metrics. These metrics contribute to an overall health status, as follows.
• Healthy – (green) No threshold violations are reported.
• Degraded – (yellow) Minor threshold violations are reported.
• Critical – (orange) Major threshold violations are reported.
• Down – (red) Device is in a down state.
• Unknown – (gray) Insufficient information to determine health.
Each object type uses different input metrics and thresholds to determine health. These are detailed in the following sections.
If any of the input metrics for a given object crosses a threshold, then the derived health sample will be set according to the threshold crossed. For example, if a device returns a CPU value of 95% when polled, it will have crossed its Major threshold and its health will be set to Critical.
The health of the device is aggregated into the health of any sites or groups of which it is a part. When a device is in a Degraded state, the site or group will also appear in a Degraded state.
For information on default thresholds, see
“Working with Default Thresholds“.
Device Health by Site Calculation
Device Health by Site is a site-level calculation that tracks the health of a site. Device health is aggregated to the site or group such that the site or group takes on the health of its least healthy device (for example, if a device is down, then the site or group is shown as down).
Interface Health by Site Calculation
Interface Health by Site is a site-level calculation that tracks the health of all interfaces in the site or group. Interface health is aggregated to the site or group such that the site or group takes on the health of its least healthy interface.
Device Health by Device Calculation
Device Health by Device is a device-level calculation that aggregates all input metrics for the given device. The health is derived from threshold violations of the input metrics.
Interface Health and Device Health are independent metrics. Interface Health in not considered in the Device Health calculation.
Input Metric | No Samples | No Violations | Minor | Major | Critical |
CPU Utilization | — | — | >85 | >95 | — |
Disk Usage | — | — | >95 | >99 | — |
Device Availability | — | — | <67 | <34 | — |
Device Status | — | — | — | — | Down |
Memory Utilization | — | — | >85 | >95 | — |
Aggregate Metric Output |
Device Health | Unknown | Healthy | Degraded | Critical | Down |
Interface Health by Device Calculation
Interface Health by Device is a device-level metric that tracks the health of all interfaces in the device. Interface health is aggregated to the device such that the device takes on the health of its least healthy interface.
Interface Health Calculation
Interface Health is an interface-level calculation derived from threshold violations of the input metrics.
Input Metric | No Samples | No Violations | Minor | Major | Critical |
Incoming interface discard rate | — | — | >1 | >5 | — |
Outgoing interface discard rate | — | — | >1 | >5 | — |
Incoming interface error rate | — | — | >1 | >5 | — |
Outgoing interface error rate | — | — | >1 | >5 | — |
Incoming interface utilization | — | — | >75 | >90 | — |
Outgoing interface utilization | — | — | >75 | >90 | — |
CoS Based Incoming Utilization | — | — | >75 | >90 | — |
CoS Based Outgoing Utilization | — | — | >75 | >90 | — |
Aggregate Metric Output |
Interface Health | Unknown | Healthy | Degraded | Critical | Down |
Home Page Panels
The Home page is the starting point for monitoring and troubleshooting your infrastructure. The Home page provides a snapshot of your infrastructure health using most recent data. This section describes ways to use each panel on the Home page to analyze your network and troubleshoot any issues you find.
For information on how to add/edit panels to the
Home page, see
Working With Custom ViewsThe following topics are included in this section.
View Summary of Monitored Elements
At the top of the screen is an information ribbon containing a summary of what is being monitored by NetIM. This summary information provides a way to see, at a glance, what groups have been created, how many of the total interfaces are being polled, and so on.
For more information, see
Viewing Alerts.
View Device Health
The Device Health panels organize and display information about the health of your devices by Site, by Device, or by Device Type. These panels are useful to gauge the overall health of a site and quickly drill down for more information about the devices contributing to the health status.
For more information about health, see
“The Home Page and Health".
View Interface Health by Site
Similar to the Device Health by Site panel, the Interface Health by Site panel organizes and displays information about the health of monitored interfaces by Site group. To learn more about metrics on the interfaces, such as utilization, errors, and packet discards, drill down into a given site.
Related Topic
View Configuration Changes
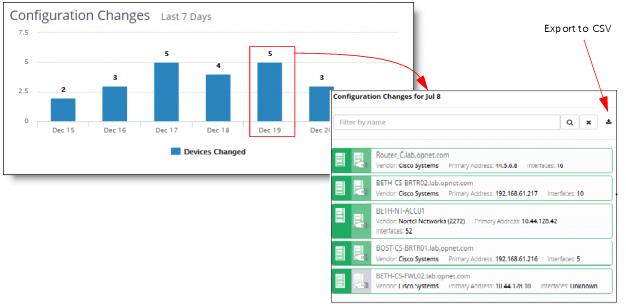
The configuration changes panel gives you a quick way to find out what device configurations have changed in your infrastructure. Drill down by clicking on a column to find out which devices changed, and then drill down further to see what changed for a given device.
Related Topic
Change the Time Window
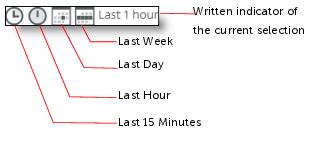
Many of the screens you encounter in NetIM have a time window. The time window is a set of controls, shown in the figure below, that lets you choose the time window of interest to you. Changing the time window widens or narrows the amount of information you see on the given page. Click an icon in the time window controller to change your selection.
The Home page always shows the most current information.
View Status of NetIM
The status of NetIM is shown by an icon in the upper-left of the persistent banner on all screens, as follows:
The following table lists the possible statuses.
Symbol | Description |
| All services are available. |
| At least one (but not all) service is not available. |
| All services are unavailable. |
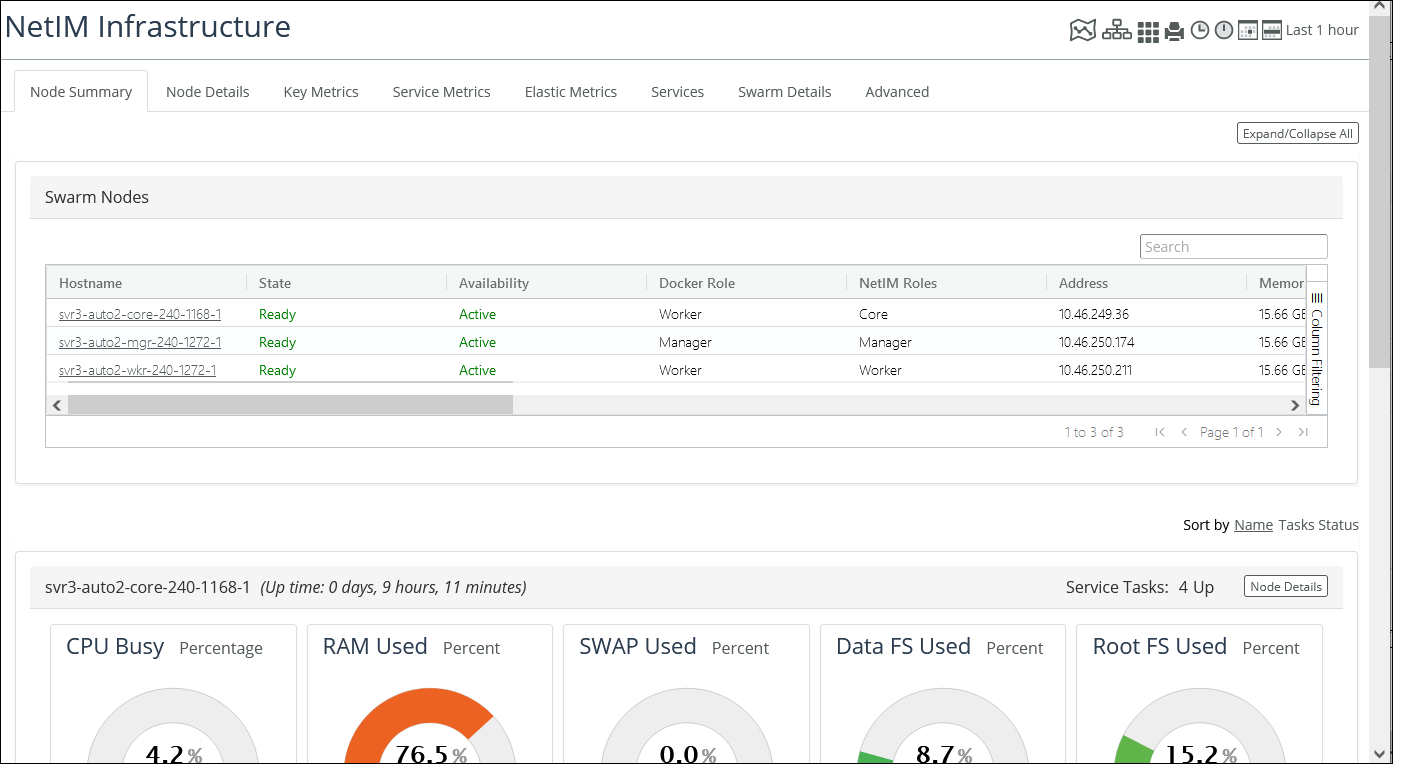
To see more information about NetIM status click the icon to view the System Status screen, or navigate to CONFIGURE >Administer->NetIM Infrastructure page, which displays system status and other tabs, as shown in the following screen:
Create Sites/Groups and Hierarchies from the Menu Bar
NetIM includes ease-of-use functionality to rapidly create sites/groups and site/group hierarchies without the need to use the
Topology or
Search pages. Many of the primary pages include the
Site/Group Hierarchy icon

., as shown in the following
Home screen:
Click the

icon to do the following:
• Create a site/group by filling out the following dialog box:
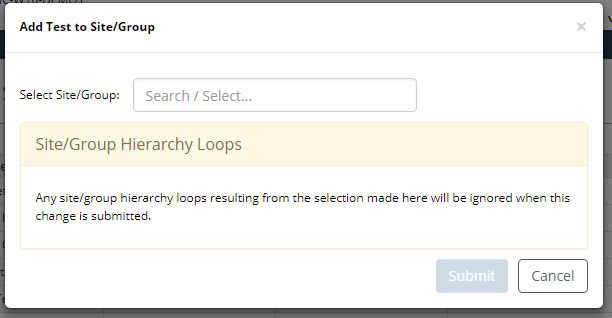
• Optionally include the new empty site or group in an existing group to create a site/group hierarchy by filling out the Add Text to Site/Group popup that displays when you click the Submit button on the Create Site/Group popup:
Active Alerts
The
Home page and all
“Object and Custom Views" pages support quick access to the
Active Alerts status for the number of alerts as they occur in real time, and allowing you to drill down to the
Alerts Manager by clicking on the number beneath a specific alert icon. If, for example, you click on the number of Minor alerts, only Minor alerts are displayed in the
Alerts Manager.
The Active Alerts banner provides counts of the on-going metric threshold violations occurring in your network that were defined in the Alert Profiles and Default Thresholds pages. The alert counts on the Active Alerts banner are instantaneous counts and are independent of the respective page’s Time Range selector. You can click on the active alert counts to launch to the Alert Manager and filter to the specific severity.
Additionally, the
Home page and all
“Object and Custom Views" pages have a
Launch Alerts Manager link
, as shown in the following screen:
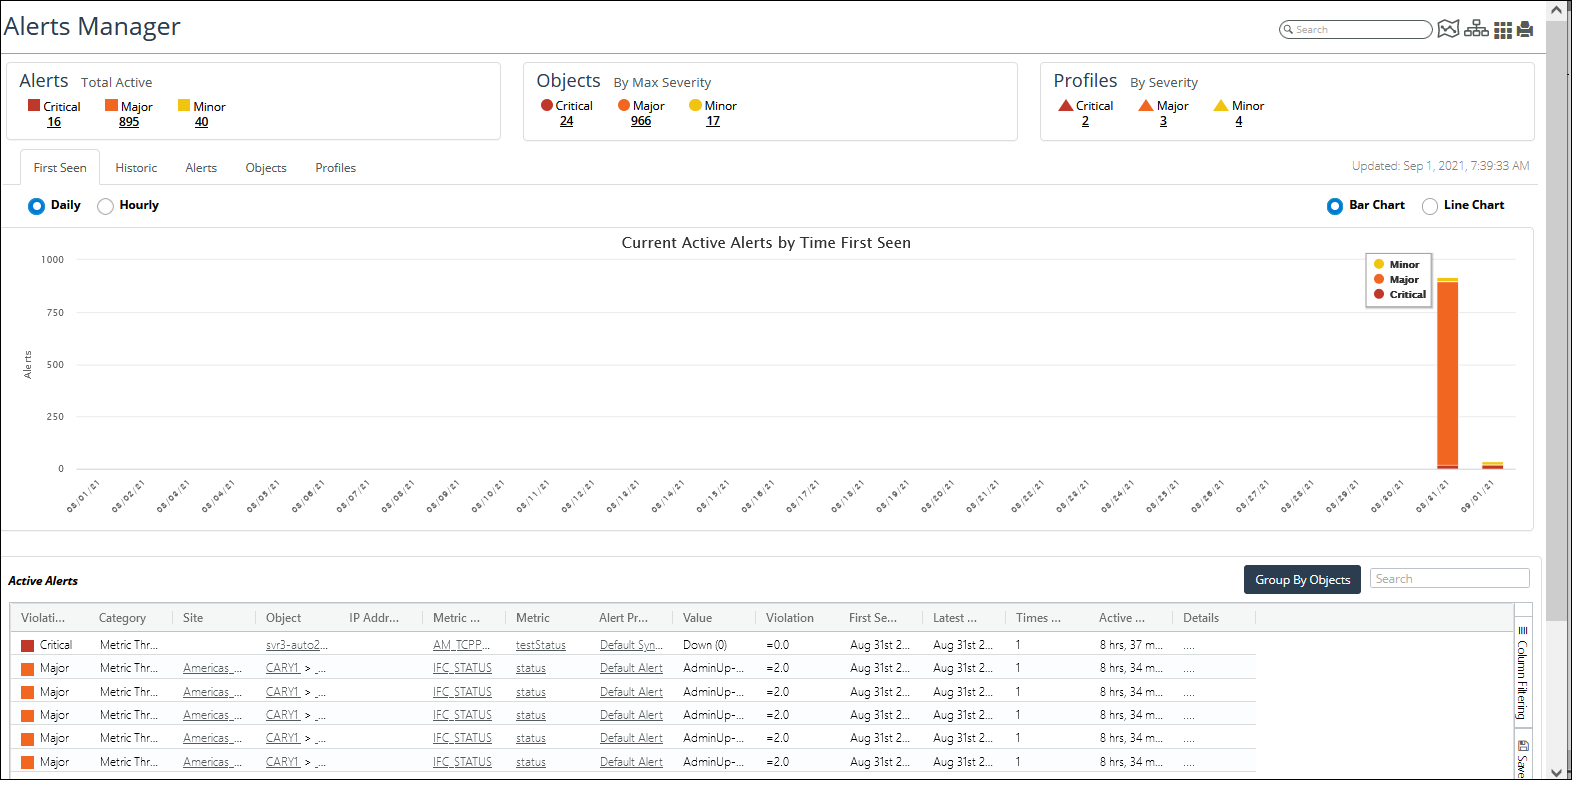
The Launch Alerts Manager link takes you to the Alerts Manager, displaying all the active alerts from Critical to Minor in the First Seen tab, as shown in the following screen:
For more information on alerts, see
Viewing Alerts.





 ., as shown in the following Home screen:
 icon to do the following:
