Configuring Metric Alerts
Configure alerts to monitor device and interface metrics on the network and to send notifications when specified thresholds are crossed. Each alert is composed of one or more metrics to be monitored, specific thresholds (minor, major, and critical) for each metric, and the devices to monitor. An alert also defines where to deliver notifications, such as:
• To a syslog server
• To one or more individuals using e-mail
• To network management software using an SNMP trap
• To Slack
• To Splunk
This section consists of the following topics:
Configuring Alert Notifications
Use the Notification wizard to configure how notifications are sent for an alert. If a notification server is not configured and set to be active, no notifications of the corresponding type will be sent; however, alerts will still appear in the Event Dashboard.
In addition to notifications, threshold crossings are always reported in NetIM on the Event Dashboard under Network Health (even if no notifications are enabled). To display the Event Dashboard, navigate to
CONFIGURE > All Settings->Administer->Event Dashboard. For more information, see
“Using the System Event Dashboard".
To enable/disable notifications triggered by a specific alert, use the Alters Profile page (navigate to
CONFIGURE > All Settings->Alerts->Alert Profiles, then select that alert and modify the notifications as necessary. To disable all notifications of a particular type (such as SNMP traps), use the
“Configuring Alert Notifications" to unselect the
Active checkbox for that notification type.
Configuring Notification Settings
1. Login as a user with administrative privilege.
2. Choose CONFIGURE > All Settings->Alert->Notifications.
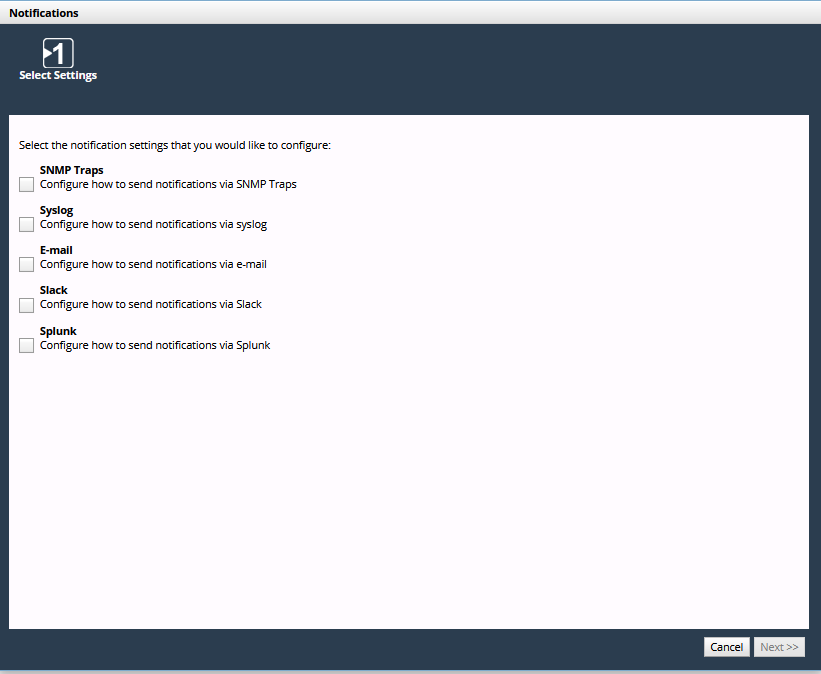
The Notifications wizard appears, as follows:
Wizard Step 1 - Select Settings:
Select the notification settings that you want to configure.
Choose one or more of the following types and click Next >>.
– SNMP Traps
– Syslog
– Email
– Slack
– Splunk
Splunk’s HEC uses a token-based authentication model. A token has a unique value, which is a 128-bit number that is represented as a 32-character globally unique identifier (GUID). You generate the token on Splunk and provide the token in NetIM’s Notifications wizard along with several other parameters. (Note: No Splunk credentials are required to be configured within NetIM.)
The following steps assume that all types are selected. If a type is not selected, the corresponding step is skipped.
Wizard Step 2 - SNMP Traps:
(This step appears if SNMP Traps is selected)
3. Select one of the following options:

- Adds an SNMP Trap Destination Configuration

- Edits the SNMP Trap Destination Configuration

- Deletes the SNMP Trap Destination Configuration
4. Each SNMP trap destination configuration is defined with the following fields:
Basic Settings
– Active - SNMP trap is active
– Display - Name - name of the SNMP trap
– Address - IP address or hostname
– Port
– Version (v1, v2c, v3)
SNMP Credentials
– Community String (v1 / v2c)
– Security Level (v3)
– Username (v3)
– Context Name (v3)
– Auth Protocol (v3)
– Auth Password (v3)
– Priv Protocol (v3)
– Priv Password (v3)
5. Optionally, click Send Test Trap to test the defined SNMP trap destination configuration.
6. Click Apply to complete the add/edit operation.
SNMP traps are not saved until you click Finish on the Summary screen.
7. After defining SNMP traps, click Next >>.
Wizard Step 4- Syslog:
(This step appears if Syslog is selected.)
8. Syslog notification is defined with the following fields:
– Active - notification is active
– Protocol - UDP or TCP
– Server
– Port
9. Optionally, click Send Test Syslog Message to test the defined notification.
10. Click Next >>.
Wizard Step 5- E-mail:
(This step appears if E-mail is selected)
11. E-mail notification is defined with the following fields:
– Active - notification is active
– Server
– Port
– Sender
– SMTP User - account for sending alert e-mails; for SMTP servers that require authentication
– SMTP Password
12. Optionally, click Send Test E-mail to test the defined notification.
13. Click Next >>.
Wizard Step 6- Slack:
(This step appears if Slack is selected)
14. Slack connection defined with the following fields:
– Active - notification is active
– Webhook address - The URL that contains the webhook endpoint to which we need to post a REST request.
For instructions on creating Slack webhooks, log in to your Slack account and search for “Incoming Webhooks” or “Send data into Slack in real-time” or “Add Incoming Webhooks Integration.”
15. Optionally, click Send Test Message to test the defined notification.
16. Click Next >>.
Wizard Step 7- Splunk:
(This step appears if Splunk is selected)
17. The Splunk notification is defined with the following fields:
– Active - notification is active
– Protocol - HTTP or HTTPS
– Server - The IP or FQDN of the Splunk instance.
– Port - Splunk HEC port number - 8088 by default.
– Private Token - a 32-character globally unique identifier (GUID) key that you must generate on Splunk and supply to NetIM in order to successfully send the notification. For example: B5A79AAD-D822-46CC-80D1-819F80D7BFB
– Index - the name of the Splunk tag ("index") that should be used to store the notifications from NetIM
Remember to import the SSL certificate on the swarm manager.
– End Point - the Splunk HEC endpoint you want to use, for example: /services/collector/event
Note: NetIM sends notifications to Splunk in JSON-format only
18. Optionally, click Send Test Splunk Message to test the defined notification.
Splunk will appear as a destination for alerts in the Alert Profiles page. Default Splunk Notification Templates are provided in the Notification Templates page and can be cloned and edited like other notification templates.
Click Next >>.Wizard Step 8- Summary:
19. Review the notification settings.
20. To make changes, click << Previous.
21. To save, click Finish.
After notifications are defined, you can define Alerts. For more information, see
“Configuring an Alert".
Certificate Requirement for Splunk HEC Integration – Certificate Validation
NetIM enables certificate validation by default. As such, your NetIM integration with Splunk may require an additional step if your Splunk server’s certificate is self-signed or from a CA that is not in Java’s set of trusted CAs, in which case, you must download and import the Splunk server’s certificate into the NetIM Manager’s truststore.
The following instructions explain how to download and import the Splunk server’s server certificate into the NetIM Manager’s truststore. Convenience scripts and files are located on the Manager.
1. Log into the NetIM server.
2. To generate the certificate, enter the following command: generate_cert.sh <server address>:<port>
Connects to the server address and port provided and downloads the certificate in the PEM format and names the file mycertfile.pem
3. To import the certificate, enter the following command: import_cert.sh <certificate file name> <alias name>
Imports the given certificate into the truststore with the given truststore password.
– truststore-password.txt
Contains the password to be used to manage the truststore, by default it is "changeit"
– truststore-type.txt
Contains the type of the truststore, by default it is "JKS" format which is Java key store.
– truststore
A binary file that, by default, contains the default root certificates available with Java installs.
4. To download and import a certificate into the Manager’s truststore, do the following:
– Within netimsh shell, stop all the Core and Manager services by running "stop all" on both the core and manager.
– Enter the bash shell on the Manager by typing "bash"
– Change your working directory to the truststore directory by typing cd ~/common/tenant-stack/1/truststore/
– Run the generate_cert.sh script, the script connects to the server at the given port and downloads the certificate in the PEM format. The certificate is stored as mycertfile.pem in the same folder.
Usage: sudo ./generate_cert.sh <server address>:<port>
For example, sudo ./generate_cert.sh amazon.com:443
– Import the certificate into your truststore by using the import_cert.sh script. The certificate is automatically imported into the truststore.
Usage: sudo import_cert.sh <certificate file name> <alias name>
For example, sudo ./import_cert.sh mycertfile.pem myaliasname
– In the netimsh and start the NetIM services using “start all” on Manager. After all required swarm services have started, use “start all” on Core to start all Core services.Testing Splunk HEC Integration
You will be presented with a dialog indicating whether the test was successful or not. The test message diagnostic dialog text is usually sufficient to identify any issues if the test was not successful. Confirm with your Splunk administrator that the test notification was received and is the expected format and content. For further troubleshooting you can download and view logs from NetIM’s Service Status page. The ability to download and view logs related to all notification sending are located under the Swarm Services, Notification Sender section of the System Status page.
Configuring an Alert
The Alert Profiles page replaces the legacy Alert Wizard. The Alerts Profiles page provides a more scalable, searchable, and modern look-and-feel, as well as an Advanced Interface Filter. To access the Alerts Profile page, navigate to CONFIGURE->All Settings->Alert->Alert Profiles. You are presented with a list of all existing alert profiles and their attributes, as well as the ability to create new alert profiles and edit and delete existing alert profiles.
The Create Alert Profile and Edit Alert Profile pages are identical and allow you to create and edit alert profiles in a similar way to the Alerts Wizard.
Creating an Alert
To create an alert, navigate to CONFIGURE->All Settings->Alert->Alert Profiles and click the +Add link, as shown in the following screen:
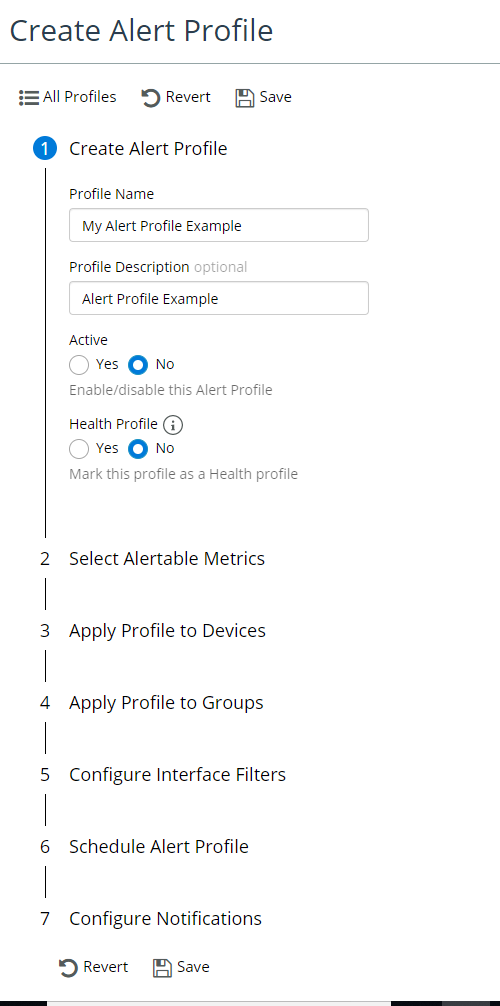
The Create Alert Profile screen appears, as follows:
From this screen you can define alerts by specifying the following:
• Providing a Profile Name
• Providing an (Optional) Description
• Enabling or Disabling the alert
• Marking the alert profile as a health profile
Marking this profile as a "Health" profile indicates that the thresholds defined here will be used-for the calculation of health for all devices associated with this profile. Devices can only be associated with a single "Health" profile at a time. Adding devices to a "Health" profile will remove them from all other "Health" profiles. Any devices not associated with a specific "Health" profile will use the default thresholds for health calculation.
• Selecting metrics to alert on and severity settings.
You can configure alerts on specific components as opposed to all components. For example, you can configure to alert on specific disks or specific CoS classes.
You can use syslog severity values to create minor, major, and critical alerts. For more information on syslog severity values, see
“Syslog Management“.
• Scheduling the alert
• Configuring notifications
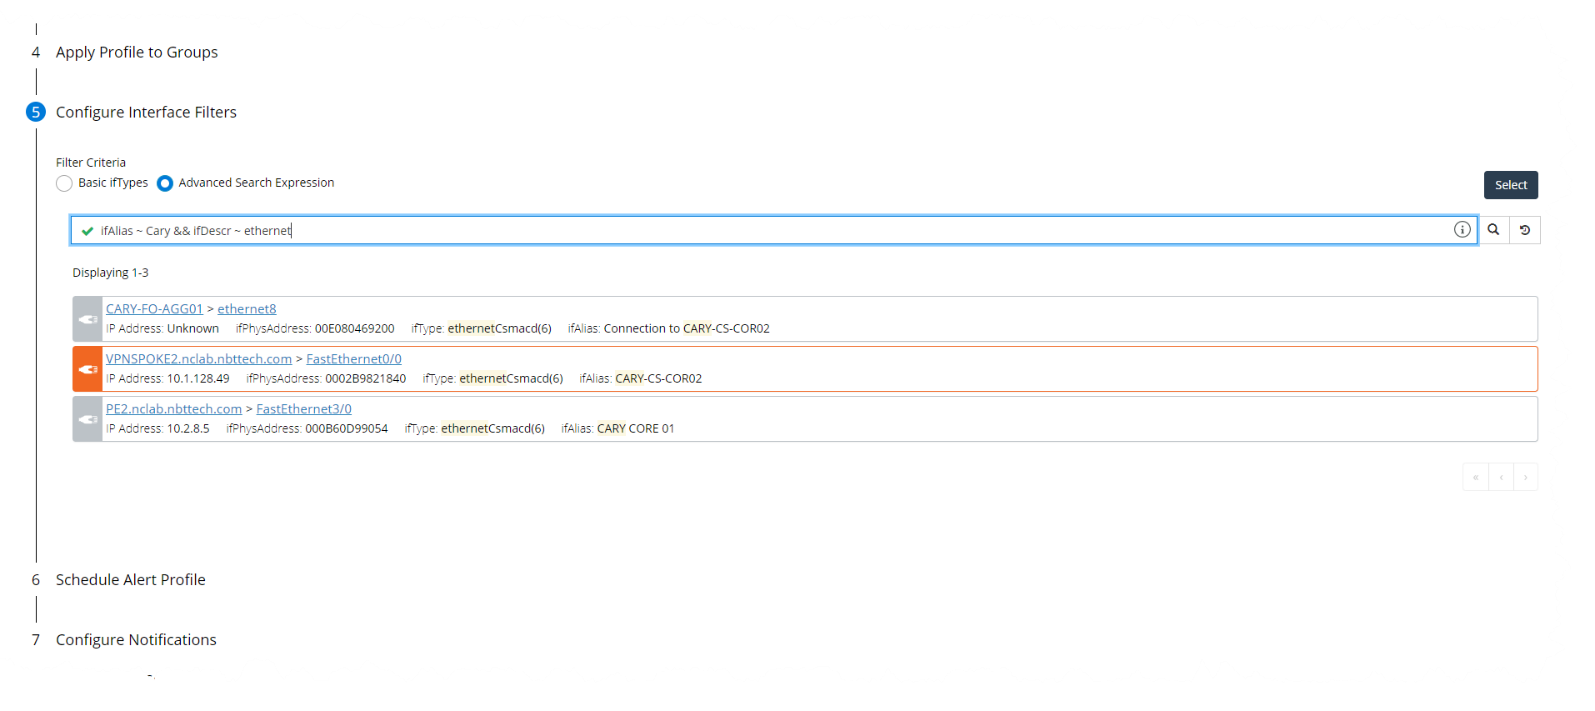
Configuring notifications supports the ability to add an Advanced Interface Filter. The Advanced Interface Filter includes all interface attributes, and is based on the Search Expression feature in the Search page and Report's page, and follows the same syntax., as shown in the following screen:
• When you are satisfied with the alert definition, click the Save button.
Adding or Removing Alerts
Use the Alerts Profile Page to create and/or modify alerts and apply them to devices as well as the Device Manager.
Perform the following procedures to add or remove an alert using the Device Manager:
Adding Alert
To add an alert, follow these steps:
1. Login as a user with administrative privilege.
2. Choose CONFIGURE > Device Manager
The Device Manger page appears, as follows:
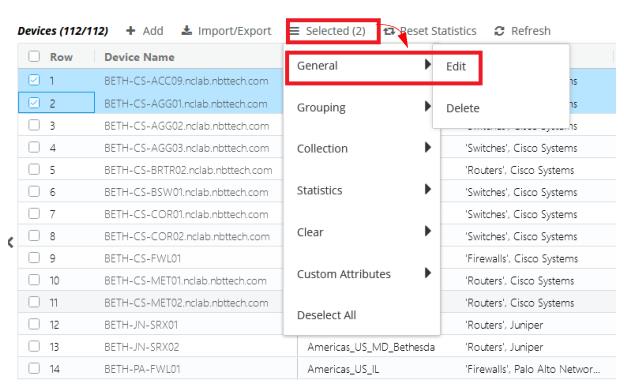
3. Select one or more device entries and click on the Selected hamburger menu, then General-> Edit, as follows:
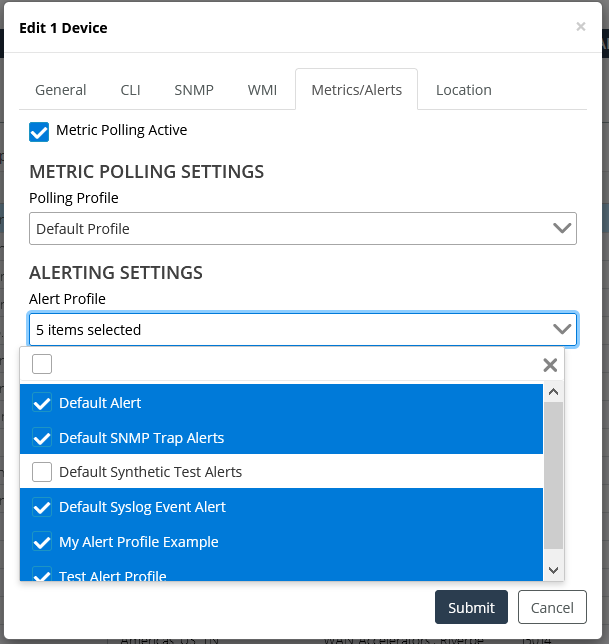
4. The following Edit Device screen appears:
5. Click on the Alert Settings option, and then check the alerts you want to add.
6. Click the Submit button when you are satisfied with your selections.
7. Click OK in the confirmation dialog.
Changes to alerts are immediate and do not need to be saved.
Removing Alert
1. Login as a user with administrative privilege.
2. Choose CONFIGURE > Device Manager.
3. Select one or more device entries and click on the Selected hamburger menu, then General-> Edit, as follows:
The following Edit Device screen appears:
4. Click on the Alert Settings option, and then uncheck the alerts you want to remove.
5. Click the Submit button when you are satisfied with your selections.
Changes to alerts do not need to be saved.
Notification Formats
• Notifications contain the following information.
• Alert Name—User-specified name of the threshold alert.
• Alert Description—User-specified description of the alert.
• Alert Source—Riverbed product from which the notification originated (NetIM).
• sysName—The hostname of the device that caused the alert.
• Metric Class—The category of the metric.
• Metric—The specific metric involved.
• Metric Index—Information that helps identify the metric.
• Crossed At—The time the threshold was crossed.
• Initially Crossed At—The time the threshold was initially crossed. This field is displayed when the statistic crosses back below the threshold.
• Threshold—The threshold that was crossed.
• Observed—The observed statistic that crossed the threshold.
• Complete Sample—Varies based on metric class.
The preceding information corresponds to object IDs (OIDs) *.21359.2.491.10.1 to *.21359.2.491.10.14 in the
“SNMP Trap MIB Definition".
The following sections show how this information is formatted for each type of notification.
SNMP Trap Notification Example
This example is the result of a CPU Utilization alert shown in a trap receiver with the SNMP Trap MIB definition loaded.
.iso.org.dod.internet.mgmt.mib-2.system.sysUpTime.0:TimeTicks:0 hours, 33 minutes, 2 seconds.:
.iso.org.dod.internet.6.3.1.1.4.1.0:Object ID:.1.3.6.1.4.1.21359.2.1.491.0.2:
.iso.org.dod.internet.private.enterprises.opnettechnologies.opnetMib.opnetGenericInfo.opnetGenericTrapVars.opnetComponentInfo.opnetAlertComponentTable.opnetAlertComponentEntry.opnetAlertComponentOperator.1:5:
.iso.org.dod.internet.private.enterprises.opnettechnologies.opnetMib.opnetGenericInfo.opnetGenericTrapVars.opnetAlertSeverity:minor:
.iso.org.dod.internet.private.enterprises.opnettechnologies.opnetMib.opnetGenericInfo.opnetGenericTrapVars.opnetAlertDesc:CPU Util Over 5 Minutes:
.iso.org.dod.internet.private.enterprises.opnettechnologies.opnetMib.opnetGenericInfo.opnetGenericTrapVars.opnetAlertProfileName:CPU Util:
.iso.org.dod.internet.private.enterprises.opnettechnologies.opnetMib.opnetGenericInfo.opnetGenericTrapVars.opnetAlertName:CPU Util:
.iso.org.dod.internet.private.enterprises.opnettechnologies.opnetMib.opnetGenericInfo.opnetGenericTrapVars.opnetComponentInfo.opnetAlertComponentTable.opnetAlertComponentEntry.opnetAlertComponentCriticalThreshold.1:75:
.iso.org.dod.internet.private.enterprises.opnettechnologies.opnetMib.opnetGenericInfo.opnetGenericTrapVars.opnetProfileId:1:
.iso.org.dod.internet.private.enterprises.opnettechnologies.opnetMib.opnetGenericInfo.opnetGenericTrapVars.opnetComponentInfo.opnetAlertComponentTable.opnetAlertComponentEntry.opnetAlertComponentStateID.1:1:
.iso.org.dod.internet.private.enterprises.opnettechnologies.opnetMib.opnetGenericInfo.opnetGenericTrapVars.opnetAlertId:1:
.iso.org.dod.internet.private.enterprises.opnettechnologies.opnetMib.opnetGenericInfo.opnetGenericTrapVars.opnetComponentInfo.opnetAlertComponentTable.opnetAlertComponentEntry.opnetAlertComponentMajorThreshold.1:50:
.iso.org.dod.internet.private.enterprises.opnettechnologies.opnetMib.opnetGenericInfo.opnetGenericTrapVars.opnetComponentInfo.opnetAlertComponentTable.opnetAlertComponentEntry.opnetAlertComponentMetricValue.1:41:
.iso.org.dod.internet.private.enterprises.opnettechnologies.opnetMib.opnetGenericInfo.opnetGenericTrapVars.opnetSysName:NYCCSBSW01.opnet.com:
.iso.org.dod.internet.private.enterprises.opnettechnologies.opnetMib.opnetGenericInfo.opnetGenericTrapVars.opnetAlertSampleData.opnetSampleDataTable.opnetSampleDataEntry.opnetMetricName.1:cpuIndex:
.iso.org.dod.internet.private.enterprises.opnettechnologies.opnetMib.opnetGenericInfo.opnetGenericTrapVars.opnetAlertSampleData.opnetSampleDataTable.opnetSampleDataEntry.opnetMetricDescription.2:User friendly name of CPU:
.iso.org.dod.internet.private.enterprises.opnettechnologies.opnetMib.opnetGenericInfo.opnetGenericTrapVars.opnetAlertSampleData.opnetSampleDataTable.opnetSampleDataEntry.opnetMetricName.3:cpuUtilType:
.iso.org.dod.internet.private.enterprises.opnettechnologies.opnetMib.opnetGenericInfo.opnetGenericTrapVars.opnetAlertSampleData.opnetSampleDataTable.opnetSampleDataEntry.opnetMetricDescription.1:The physical index of the CPU:
.iso.org.dod.internet.private.enterprises.opnettechnologies.opnetMib.opnetGenericInfo.opnetGenericTrapVars.opnetAlertSampleData.opnetSampleDataTable.opnetSampleDataEntry.opnetMetricName.2:cpuName:
.iso.org.dod.internet.private.enterprises.opnettechnologies.opnetMib.opnetGenericInfo.opnetGenericTrapVars.opnetAlertSampleData.opnetSampleDataTable.opnetSampleDataEntry.opnetMetricName.4:cpuUtil:
.iso.org.dod.internet.private.enterprises.opnettechnologies.opnetMib.opnetGenericInfo.opnetGenericTrapVars.opnetAlertSampleData.opnetSampleDataTable.opnetSampleDataEntry.opnetMetricIsIndex.2:2:
.iso.org.dod.internet.private.enterprises.opnettechnologies.opnetMib.opnetGenericInfo.opnetGenericTrapVars.opnetAlertSampleData.opnetSampleDataTable.opnetSampleDataEntry.opnetMetricDisplayName.3:Object Identifier:
.iso.org.dod.internet.private.enterprises.opnettechnologies.opnetMib.opnetGenericInfo.opnetGenericTrapVars.opnetAlertSampleData.opnetSampleDataTable.opnetSampleDataEntry.opnetMetricIsIndex.1:1:
.iso.org.dod.internet.private.enterprises.opnettechnologies.opnetMib.opnetGenericInfo.opnetGenericTrapVars.opnetAlertSampleData.opnetSampleDataTable.opnetSampleDataEntry.opnetMetricDisplayName.2:Name of CPU:
.iso.org.dod.internet.private.enterprises.opnettechnologies.opnetMib.opnetGenericInfo.opnetGenericTrapVars.opnetComponentInfo.opnetAlertComponentTable.opnetAlertComponentEntry.opnetAlertComponentStartTime.1:131532909678:
.iso.org.dod.internet.private.enterprises.opnettechnologies.opnetMib.opnetGenericInfo.opnetGenericTrapVars.opnetAlertSampleData.opnetSampleDataTable.opnetSampleDataEntry.opnetMetricDisplayName.1:CPU Index Number:
.iso.org.dod.internet.private.enterprises.opnettechnologies.opnetMib.opnetGenericInfo.opnetGenericTrapVars.opnetAlertSampleData.opnetSampleDataTable.opnetSampleDataEntry.opnetMetricIsIndex.4:2:
.iso.org.dod.internet.private.enterprises.opnettechnologies.opnetMib.opnetGenericInfo.opnetGenericTrapVars.opnetAlertSampleData.opnetSampleDataTable.opnetSampleDataEntry.opnetMetricIsIndex.3:1:
.iso.org.dod.internet.private.enterprises.opnettechnologies.opnetMib.opnetGenericInfo.opnetGenericTrapVars.opnetTargetInfo.opnetTargetDeviceID:906:
.iso.org.dod.internet.private.enterprises.opnettechnologies.opnetMib.opnetGenericInfo.opnetGenericTrapVars.opnetAlertSampleData.opnetSampleDataTable.opnetSampleDataEntry.opnetMetricClassName.3:CPU_UTIL:
.iso.org.dod.internet.private.enterprises.opnettechnologies.opnetMib.opnetGenericInfo.opnetGenericTrapVars.opnetComponentInfo.opnetAlertComponentTable.opnetAlertComponentEntry.opnetAlertComponentMetricClassName.1:CPU_UTIL:
.iso.org.dod.internet.private.enterprises.opnettechnologies.opnetMib.opnetGenericInfo.opnetGenericTrapVars.opnetAlertSampleData.opnetSampleDataTable.opnetSampleDataEntry.opnetMetricClassName.4:CPU_UTIL:
.iso.org.dod.internet.private.enterprises.opnettechnologies.opnetMib.opnetGenericInfo.opnetGenericTrapVars.opnetComponentInfo.opnetAlertComponentTable.opnetAlertComponentEntry.opnetAlertComponentStopTime.1:0:
.iso.org.dod.internet.private.enterprises.opnettechnologies.opnetMib.opnetGenericInfo.opnetGenericTrapVars.opnetAlertSampleData.opnetSampleDataTable.opnetSampleDataEntry.opnetMetricClassName.1:CPU_UTIL:
.iso.org.dod.internet.private.enterprises.opnettechnologies.opnetMib.opnetGenericInfo.opnetGenericTrapVars.opnetAlertSampleData.opnetSampleDataTable.opnetSampleDataEntry.opnetMetricClassName.2:CPU_UTIL:
.iso.org.dod.internet.private.enterprises.opnettechnologies.opnetMib.opnetGenericInfo.opnetGenericTrapVars.opnetAlertSampleData.opnetSampleDataTable.opnetSampleDataEntry.opnetSampleDataIndex.1:1:
.iso.org.dod.internet.private.enterprises.opnettechnologies.opnetMib.opnetGenericInfo.opnetGenericTrapVars.opnetAlertSampleData.opnetSampleDataTable.opnetSampleDataEntry.opnetSampleDataIndex.2:2:
.iso.org.dod.internet.private.enterprises.opnettechnologies.opnetMib.opnetGenericInfo.opnetGenericTrapVars.opnetAlertSampleData.opnetSampleDataTable.opnetSampleDataEntry.opnetSampleDataIndex.3:3:
.iso.org.dod.internet.private.enterprises.opnettechnologies.opnetMib.opnetGenericInfo.opnetGenericTrapVars.opnetComponentInfo.opnetAlertComponentTable.opnetAlertComponentEntry.opnetAlertComponentID.1:1:
.iso.org.dod.internet.private.enterprises.opnettechnologies.opnetMib.opnetGenericInfo.opnetGenericTrapVars.opnetAlertSampleData.opnetSampleDataTable.opnetSampleDataEntry.opnetSampleDataIndex.4:4:
.iso.org.dod.internet.private.enterprises.opnettechnologies.opnetMib.opnetGenericInfo.opnetGenericTrapVars.opnetComponentInfo.opnetAlertComponentTable.opnetAlertComponentEntry.opnetAlertComponentMetricName.1:cpuUtil5min:
.iso.org.dod.internet.private.enterprises.opnettechnologies.opnetMib.opnetGenericInfo.opnetGenericTrapVars.opnetAlertSampleData.opnetSampleDataTable.opnetSampleDataEntry.opnetMetricUnits.4:%:
.iso.org.dod.internet.private.enterprises.opnettechnologies.opnetMib.opnetGenericInfo.opnetGenericTrapVars.opnetPrimaryAddress:10.3.1.115:
.iso.org.dod.internet.private.enterprises.opnettechnologies.opnetMib.opnetGenericInfo.opnetGenericTrapVars.opnetAlertSampleData.opnetSampleDataTable.opnetSampleDataEntry.opnetSampleMetricValue.1:0:
.iso.org.dod.internet.private.enterprises.opnettechnologies.opnetMib.opnetGenericInfo.opnetGenericTrapVars.opnetAlertSampleData.opnetSampleDataTable.opnetSampleDataEntry.opnetSampleMetricValue.4:41:
.iso.org.dod.internet.private.enterprises.opnettechnologies.opnetMib.opnetGenericInfo.opnetGenericTrapVars.opnetSource:Net:
.iso.org.dod.internet.private.enterprises.opnettechnologies.opnetMib.opnetGenericInfo.opnetGenericTrapVars.opnetAlertSampleData.opnetSampleDataTable.opnetSampleDataEntry.opnetSampleMetricValue.3:cpmCPUTotal5minRev:
.iso.org.dod.internet.private.enterprises.opnettechnologies.opnetMib.opnetGenericInfo.opnetGenericTrapVars.opnetComponentInfo.opnetAlertComponentTable.opnetAlertComponentEntry.opnetAlertComponentMinorThreshold.1:25:
.iso.org.dod.internet.private.enterprises.opnettechnologies.opnetMib.opnetGenericInfo.opnetGenericTrapVars.opnetAlertSampleData.opnetSampleDataTable.opnetSampleDataEntry.opnetMetricDescription.3:Where appropriate, this will be the name of the requested CPU utilization type.:
.iso.org.dod.internet.private.enterprises.opnettechnologies.opnetMib.opnetGenericInfo.opnetGenericTrapVars.opnetAlertSampleData.opnetSampleDataTable.opnetSampleDataEntry.opnetMetricDescription.4:Percent utilization as received from the device:
.iso.org.dod.internet.private.enterprises.opnettechnologies.opnetMib.opnetGenericInfo.opnetGenericTrapVars.opnetComponentInfo.opnetAlertComponentTable.opnetAlertComponentEntry.opnetAlertComponentMetricDisplayName.1:CPU Utilization 5 min:
.iso.org.dod.internet.private.enterprises.opnettechnologies.opnetMib.opnetGenericInfo.opnetGenericTrapVars.opnetTargetInfo.opnetTargetInfoOeID:670004:
.iso.org.dod.internet.private.enterprises.opnettechnologies.opnetMib.opnetGenericInfo.opnetGenericTrapVars.opnetTargetInfo.opnetTargetInfoMetricClassName:CPU_UTIL:
.iso.org.dod.internet.private.enterprises.opnettechnologies.opnetMib.opnetGenericInfo.opnetGenericTrapVars.opnetTargetInfo.opnetTargetInfoMetricClassDisplayName:CPU Utilization:
.iso.org.dod.internet.private.enterprises.opnettechnologies.opnetMib.opnetGenericInfo.opnetGenericTrapVars.opnetAlertSampleData.opnetSampleDataTable.opnetSampleDataEntry.opnetMetricDisplayName.4:CPU Utilization:
.iso.org.dod.internet.private.enterprises.opnettechnologies.opnetMib.opnetGenericInfo.opnetGenericTrapVars.opnetComponentInfo.opnetAlertComponentTable.opnetAlertComponentEntry.opnetAlertComponentMetricClassDisplayName.1:CPU Utilization:
Syslog Notification Example
CRITICAL - The following alert has been crossed with critical severity: Alert Name: CPU Alert > 50%
Alert Description: trap
Alert Source: SteelCentral NetIM
sysName:WDCCSDST01.lab.opnet.com
primaryAddress:10.1.128.2
The following alert details were observed:
Metric Class: CPU Utilization
Metric:CPU Utilization 5 min
Metric Index: cpuIndex: 0, cpuUtilType: cpmCPUTotal5minRev
Crossed at: Mon Apr 11 14:55:10 EDT 2011
Threshold: > 50%
Observed: 58%
Complete Sample:
CPU Index Number: 0
Name of CPU:
Object Identifier: cpmCPUTotal5minRev
CPU Utilization: 58
E-Mail Notification Example
The following alert has been crossed with minor severity:
Alert Name: Alert 1
Alert Description:
Alert Source: SteelCentral NetIM
sysName:ATLCSACC01.lab.opnet.com
primaryAddress:10.1.18.9
The following alert details were observed:
Metric Class: IP SLA Latency
Metric: Roundtrip Latency
Metric Index: targetIP: 10.2.8.9, protocol: ipIcmpEcho
Crossed at: Thu Apr 07 14:18:50 EDT 2011
Threshold: > 100 milliseconds
Observed: 191 milliseconds
Complete Sample:
Target Address: 10.2.8.9
Protocol: ipIcmpEcho
Roundtrip Latency: 191
Minimum Roundtrip Latency:
Maximum Roundtrip Latency:
SNMP Trap MIB Definition
To find the latest SNMP Trap MIB definition, go to <install_dir>/lib/mibs/third_party/opnet.
Configuring a Maintenance Window
NetIM supports creating maintenance windows to mute all alerts associated with a device and its associated components including interfaces, CPU, memory, and so on.
To configure Maintenance Windows, follow these steps:
1. Navigate to CONFIGURE > All Settings->Alert->Maintenance Windows.
The following screen appears:
From the Maintenance Windows page you can add, view, edit, and delete maintenance windows, as shown in the following screens:
2. To configure a new maintenance window, click the
+Add icon

.
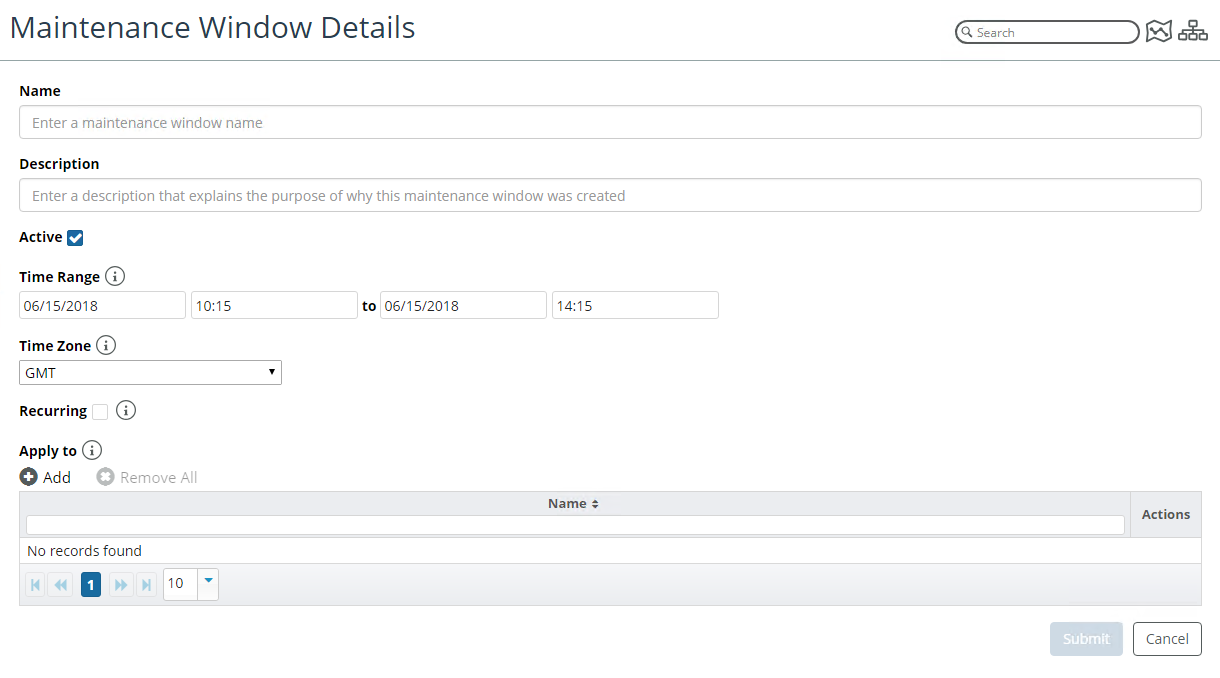
The following screen appears:
From this window you can define the following attributes:
– Name
– Description
– Active State
– Time Range
– Time Zone
– Recurrence State
– Device Selection
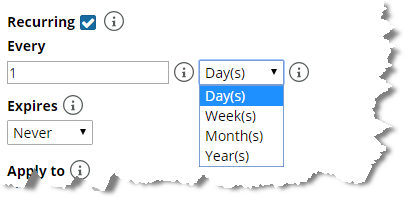
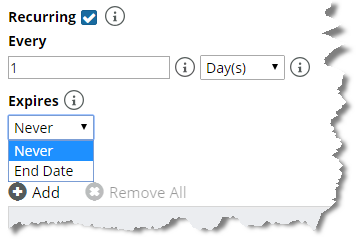
If you select the option to configure a recurring maintenance window, you must configure the recurrence frequency and expiration. Recurrence frequency options include days, weeks, months, and years, as shown in the following screen:
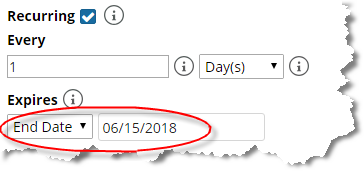
A recurring maintenance window can expire, as shown in the following screen:
A recurring maintenance window can also be set to never expire, as shown in the following screen:
Working with Default Thresholds
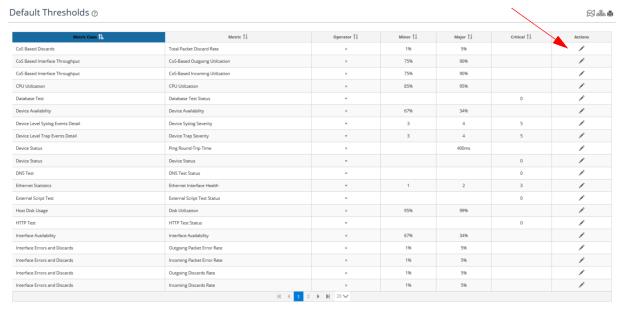
The Default Thresholds page allows you to define the default thresholds used for NetIM’s default alerts.
The default threshold values also control health calculations.
To configure default thresholds, follow these steps:
1. Log into the UI as admin.
2. Navigate to CONFIGURE->All Settings->Alert->Default Thresholds. The Default Thresholds page appears, as follows:
3. To edit a threshold, click the edit

icon in the
Action column of the threshold of interest.
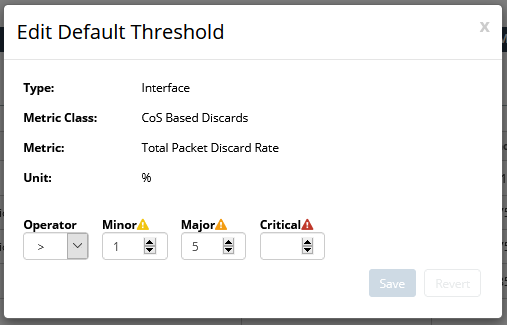
The following screen appears:
4. Make the appropriate changes to the threshold for your environment, then click the Save button to record your edits.
Suppressing Alert Notifications
To prevent alert storms, NetIM allows you to designate one or more devices associated with a site as a Site Gateway. If every designated Site Gateway goes down, a single Site Down notification is sent, and all alert notifications for that site are suppressed until at least one Site Gateway comes back online, at which point site-wide alert notification resumes.
To configure alert notification suppression, follow these steps:
1. Login to the NetIM UI as admin.
2. Since the device status and availability metric class is essential for generating Site Gateway status, as well as well as site/group status and device health, ensure that the device status and availability metric class is enabled for all the devices and that device status is part of each health profile. For more information, see
Configuring an Alert.
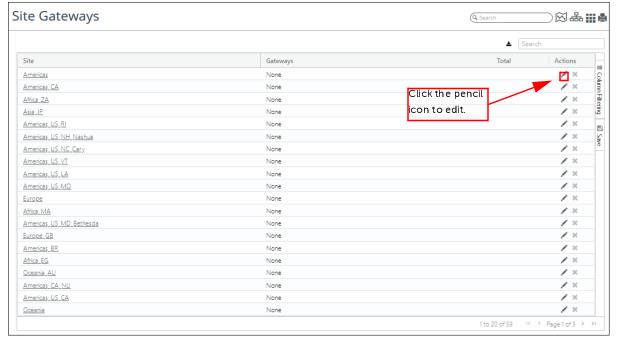
3. Navigate to CONFGIURE->All Settings->Organize->Site Gateways. The following screen appears:
The Site Gateways page displays every monitored site and in the Gateways column lists the name of each gateway device or the word “None” if no gateway devices have been configured for a site. If one or more Site Gateways is configured for a site, the number of Gateways is listed under the Total column.
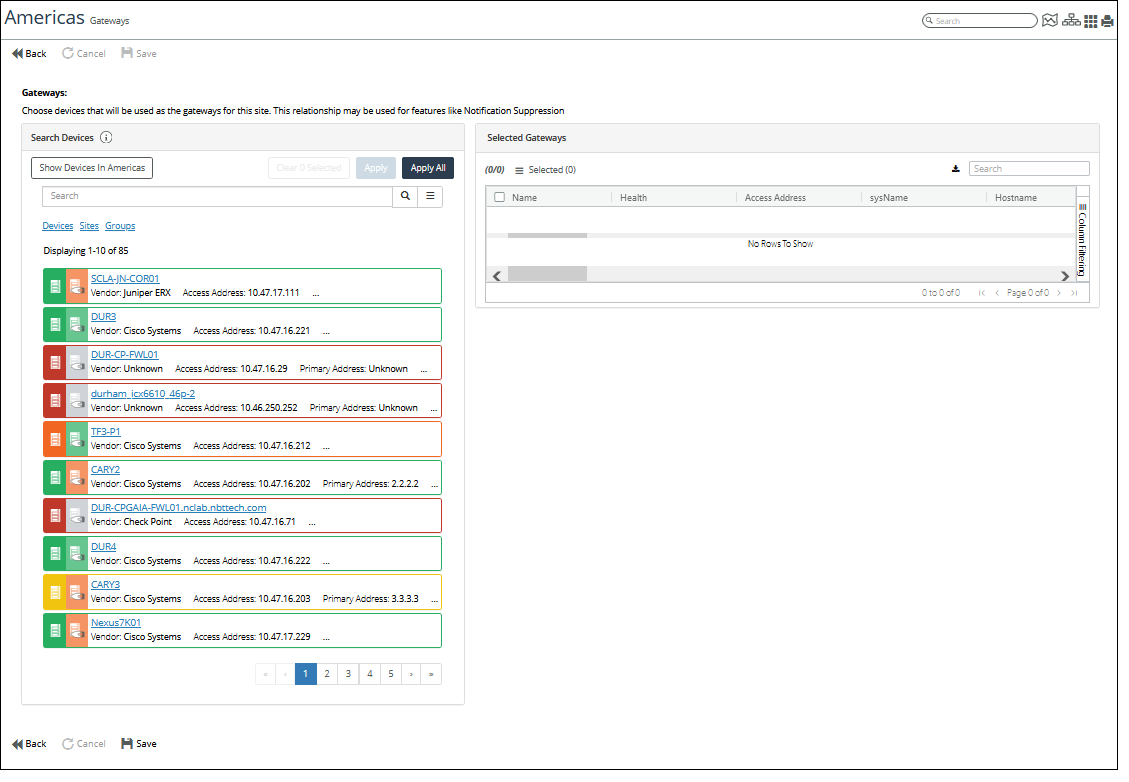
4. To assign or unassign a Site Gateway, click the pencil icon under the Actions column for the site of interest. The following screen appears:
5. To select one or more Gateway Devices for the site, do one of the following:
– (Optional) Use the Search utility to find devices of interest.
– To add all devices, click the Apply All button.
– To add one or more devices, click on the device entry box for each device to highlight the entry, and then click the Apply button.
You can remove devices by selecting the device(s) and then clicking on the hamburger menu and selecting Remove or Remove all.
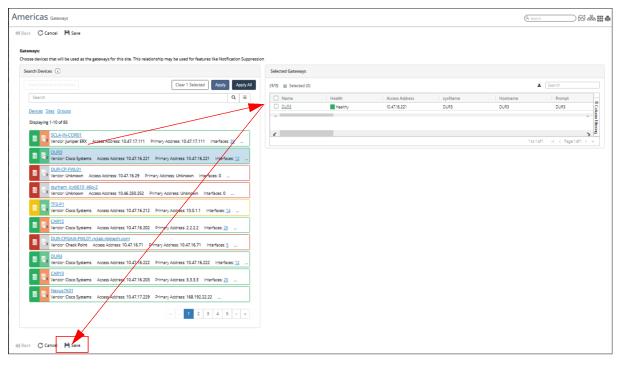
6. When you are satisfied with your selection, click the Save button in the lower left of the page.
The following screen shows the CISCO DUR3 device being selected as a Gateway Device for the Americas site:
The following screen shows the CISCO DUR3 device listed as a Gateway Device for the Americas site on the Site Gateways page:
7. (Optional) Gateway Notification Suppression is enabled by default. However, You can globally disable Gateway Notification Suppression from the CONFIGURE->All Settings->Customize->General Settings page by unchecking the Site Down Suppression check box, as shown in the following screen:
8. (Optional) You can view the Site Down Notification Templates on the CONFIGURE->All Settings->Alerts->Notification Templates page, as shown in the following screen:

 - Adds an SNMP Trap Destination Configuration
 - Edits the SNMP Trap Destination Configuration
 - Deletes the SNMP Trap Destination Configuration



 icon in the Action column of the threshold of interest.