Using AppNetwork Path Analysis
NetIM provides Application Network (AppNetwork) Path Analysis, which is the determination of the Layer-2 and Layer-3 path through the network between a given source-destination pair. The result of this analysis is a graphical representation of the path. The result also includes detailed identification of each device and interface in that path.
This section includes the following topics:
Requirements for AppNetwork Path Analysis
Note the following requirements for AppNetwork Path analysis:
• Network access to devices is required using one of the following:
– Telnet (port 23)
– SSH (port 22)
• You must have already provided the credentials needed for CLI login to devices in the network domain of interest.
Calculating an AppNetwork Path Analysis
To conduct an AppNetwork Path analysis and view the results in the AppNetwork Path Analysis screen, follow these steps:
1. Open the AppNetwork Path Analysis dialog by clicking the

icon in the
Home, Search, or
Metrics screen or by clicking on the

icon in the
Topology screen.
The AppNetwork Path Analysis dialog appears, as follows:
2. In the dialog, enter the IP address of a source device and the IP address of a destination device.
If you are calculating an AppNetwork Path from within the Topology screen, check Include Reverse Path if you want to generate both the forward (source to destination) and the reverse (destination to source) paths.
3. Click Calculate.
– AppNetwork Path Analysis must find a Telnet- or SSH-accessible device to use as the starting point in the path. It first attempts to consider the source device as the starting point. If the source device is not accessible, AppNetwork Path Analysis uses known model data to determine the router that is closest to the source. If both techniques fail to find an accessible starting point, the path determination process fails, in which case you can supply the Default Router’s address at
step 1.
The same process applies for generating a reverse path, in which case the destination is considered to be the source.
– AppNetwork path analysis begins. It may take several minutes to generate the requested path(s), but each path is displayed progressively on the Application Path tab as it is analyzed.
An X in the path diagram means that the destination is unreachable from the device that is immediately before the X.
A cloud with a question mark or a gray box that is labeled Unknown in the path indicates that there is not enough information about this part of the path, typically because the device is not accessible or is outside the administrative boundaries of the organization.
Exploring an AppNetwork Path Analysis
After the AppNetwork Path is calculated, a path visualization, like the one shown below, appears. Each hop along the path is detailed, including the ingress and egress ports. as shown in the following screen:
You have the option to include the reverse path before calculating the AppNetwork Path when you launch the AppNetwork Path dialog from within the Topology Viewer.
Viewing Path Status
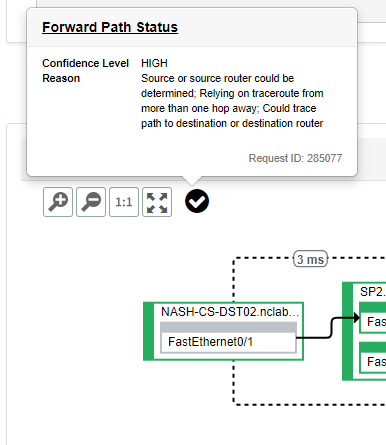
The AppNetwork Path calculation reports the confidence level of the path in an information panel. By mousing over the status icon

you can get a status overview for the forward and reverse paths, as shown in the following screen:
Show Info in AppNetwork Path
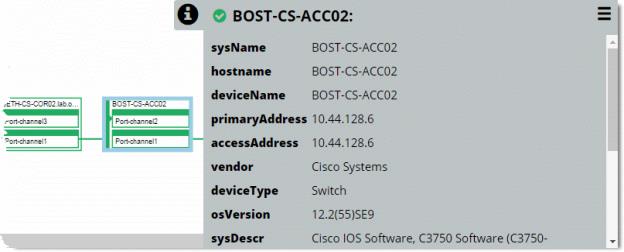
The following screen shows a forward and reverse path in the view. We have selected the device BOST-CS-ACC02 and clicked the Show Info icon to see more details about this device. Notice that by clicking on the menu icon in the upper right-hand corner, we can access more actions for the device in the pop-up menu.
For more information about the available actions, see
Topology Actions.
If you select an interface on a device, the Show Info panel opens automatically.
AppNetwork Path Confidence
NetIM assigns a confidence level to each generated AppNetwork path, as listed in the following table.
Status | Color | Confidence | Conditions |
Complete | Green | High | A complete path can be identified, which implies: • The source router could be determined • A path to the destination or destination router was found. |
Complete | Yellow | Medium | A complete path can be identified, but confidence is less than High because at some point on the path, a next hop was determined by traceroute from a device that is more than one hop back, rather than by traceroute or the routing table in the current hop. |
Complete | Orange | Low | A complete path can be identified, but the identified starting point is not Layer 3-adjacent to the source. |
Partial | Orange | Low | Only a partial path could be identified, such as in the following cases: • There are inaccessible devices in the path, or • There are unsupported devices in the path, or • The destination is unreachable |
Failed | Red | n/a | AppNetwork path analysis failed. The source and source router are not accessible because a starting point was not found. |
Path Monitoring
Application Network Path (AppNetwork Path) analysis is the calculation of the Layer-2 and Layer-3 path through the network between a given source-destination pair. The result includes detailed identification of each device and interface in that path to quickly troubleshoot whether network issues are a contributing factor or root cause of application issues.
NetIM’s Path Monitoring feature significantly enhances the existing AppNetwork Path analysis feature by adding:
• Scheduled polling of configured source-destination pairs
• Persistence of paths over time
• Equal Cost Multi-Path support
• Hop and path round-trip delay/latency support
• AppNetwork Path difference detection
• Historical path selection and visualization
• Enhanced AppNetwork Path visualization
– Multiple path display support
– Config change and round-trip delay/latency annotation on paths
• Path Monitoring metrics for alerting workflows
Configuring Path Monitoring
To configure path monitoring, follow these steps:
1. Log into the UI as admin.
2. Navigate to CONFIGURE->All Settings->Monitor->Path Monitoring
The following screen appears:
3. To add a new monitored path, click the Add button in the upper left of the page.
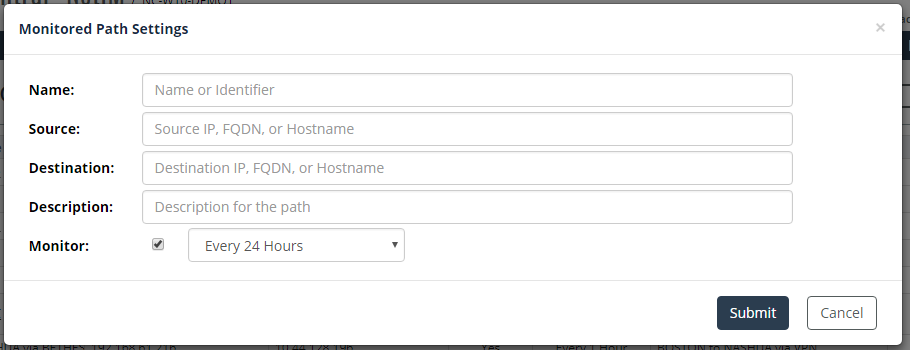
The following screen appears:
4. Provide a name and description for the path, the endpoints you want to monitor and the frequency with which you want to perform the AppNetwork Path analysis.
5. When you are satisfied with your choices, click the Submit button.
Viewing and Exploring Monitored Paths
All users have access to Path Monitoring viewing, navigation, and troubleshooting by navigating to More > Path Monitoring.
Additionally, all users can save an AppNetwork Path definition but only users with administrator privileges can set up that path to be monitored over time.
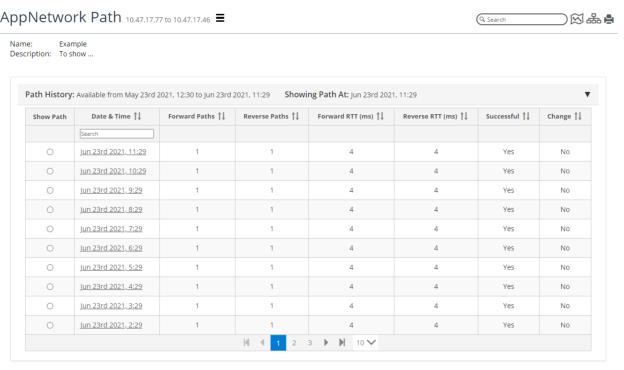
By clicking a path name, you can view the list of available historic paths. The Path History table displays important metrics about the number of forward and reverse paths, the maximum forward, and reverse round-trip times, and whether there was a path change detected from the previous path calculation, as shown in the following screen:
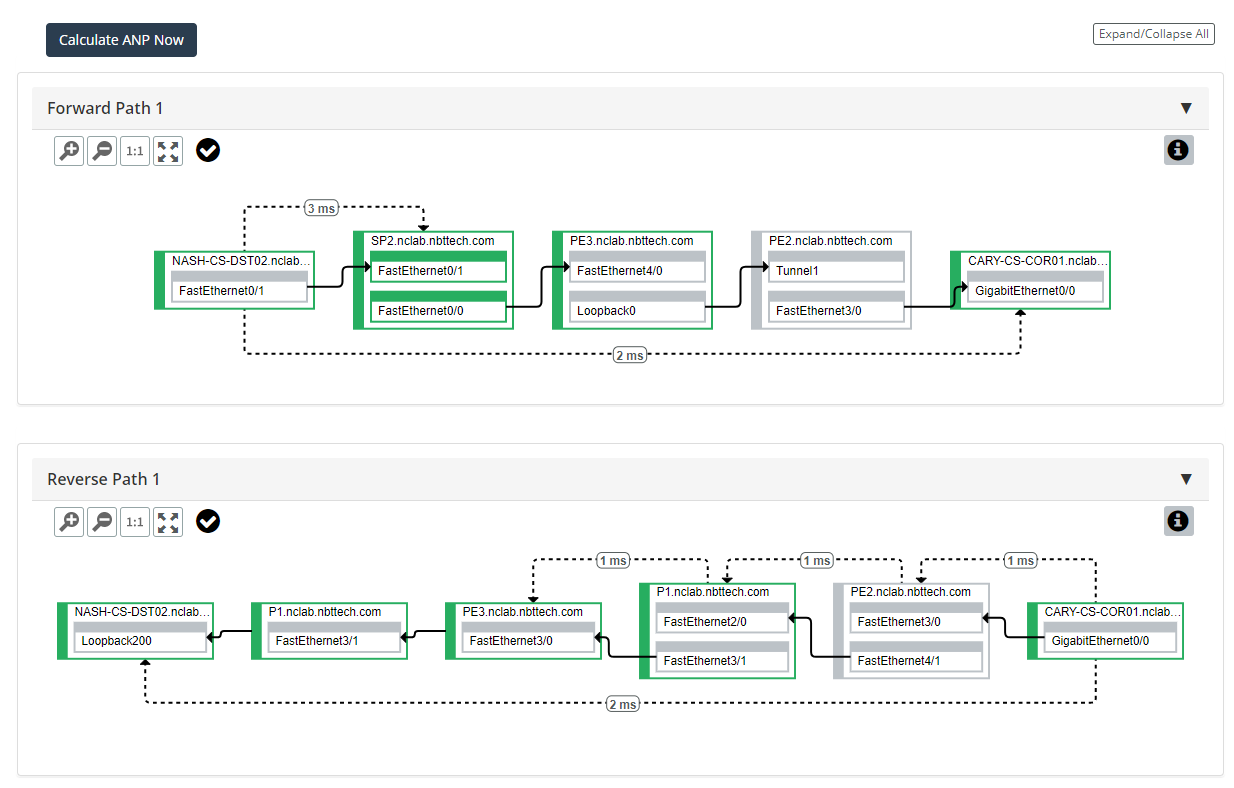
By default, when you click a path name from the Path Monitoring page, you are presented with the latest stored path in the path visualization section. You can select any historic path or click the Calculate ANP Now button to trigger a new AppNetwork Path calculation and display the results. The path visualization annotates the path with hop delays and path round-trip delays from when the path was calculated. Health indicators are provided and are the current health of the path element, as shown in the following screen:
Using the main hamburger menu

, you can make modifications to the monitored path name and path monitoring parameters or choose to download the AppNetwork Path log, as shown in the following screen. If you select Download Path Log, the AppNetwork Path session log for the displayed path will be downloaded to your browser as a text file. You can view the path log file off-line with any text editor or supply to Technical Support, if asked, as shown in the following screen:
You can view per-hop session logs, by selecting a specific device hop in the path view window and then, using the hamburger menu

in the information dialog, select
View Session Log, as shown in the following screen:
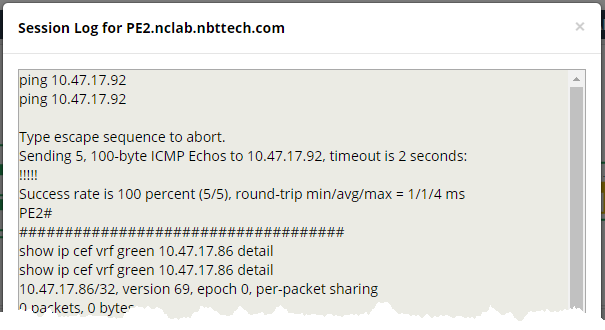
The session log for the selected hop will be shown in a popup window, as follows:
Monitored Path Alerting
Two metric classes are available to enable path alerting.
To set up monitored path alerting, follow these steps:
1. Log into the UI as admin.
2. Navigate to CONFIGURE->All Settings->Alert->Alert Profiles.
The following page appears.
3. To add a new alert profile, click on the

icon in the upper left of the page.
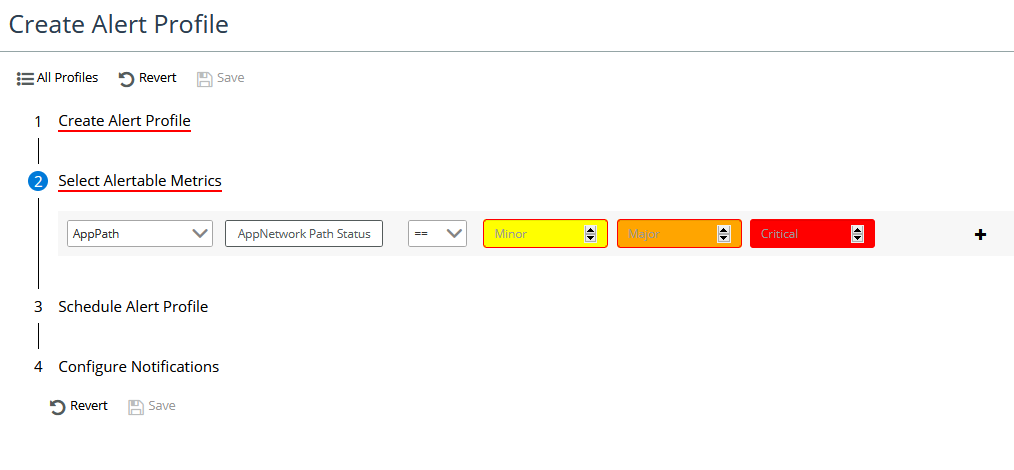
The following screen appears.
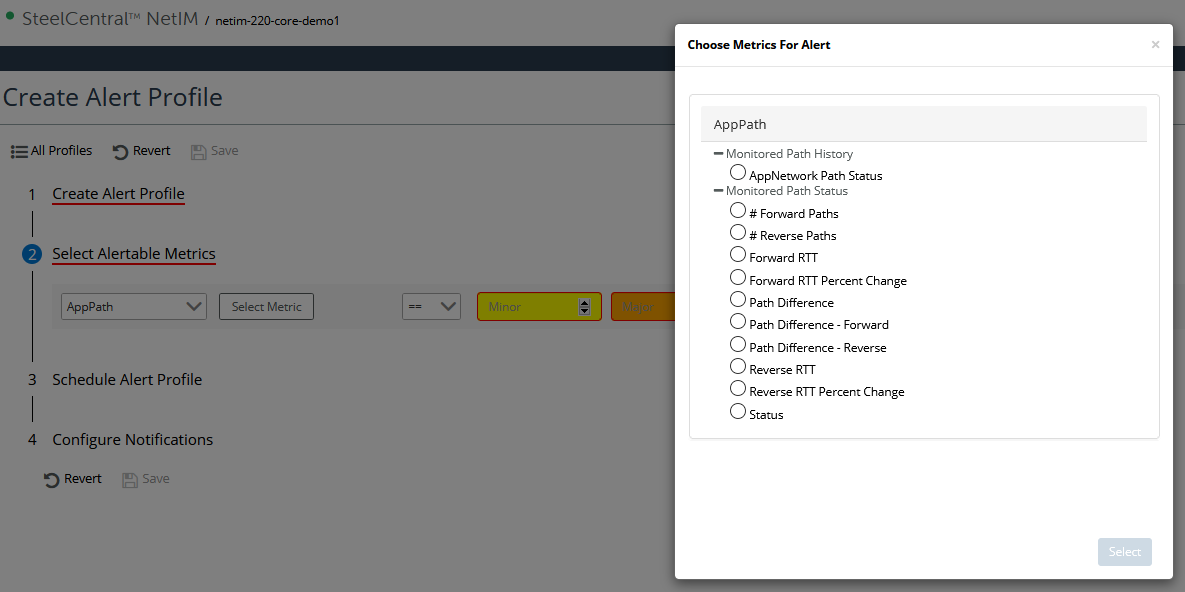
4. In the Select Available Metrics section, select AppPath and click in the Metrics box.
The following popup appears with a list of metrics to choose from for Monitoring Path History and Monitoring Path Status:
 icon in the Home, Search, or Metrics screen or by clicking on the
  icon in the Topology screen.
  icon in the Home, Search, or Metrics screen or by clicking on the
  icon in the Topology screen.
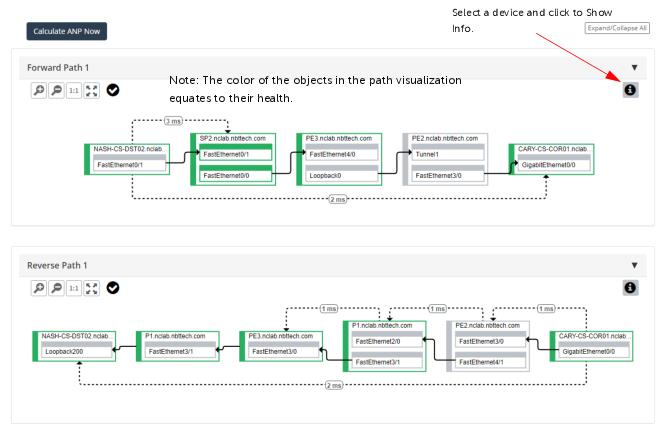
 you can get a status overview for the forward and reverse paths, as shown in the following screen:

 , you can make modifications to the monitored path name and path monitoring parameters or choose to download the AppNetwork Path log, as shown in the following screen. If you select Download Path Log, the AppNetwork Path session log for the displayed path will be downloaded to your browser as a text file. You can view the path log file off-line with any text editor or supply to Technical Support, if asked, as shown in the following screen:
 in the information dialog, select
