Navigating Topology
The Topology Viewer gives you an easy way to visualize your up-to-date network and to gather information about monitored network elements. To open the Topology Viewer, choose Topology from the menu bar.
To achieve the best results from the Topology Viewer, set up sites for your network infrastructure before viewing your topology. The Topology Viewer limits you to a display of 1,000 devices and 1,000 groups or fewer.
Grouping your infrastructure is a best practice for displaying your topology effectively. For more information, see
“Creating, Cloning, Modifying, Deleting, and Manually Running Grouping Rules".
Only sites are used by the Topology Viewer. Groups have no effect on the topology.
The Topology viewer also provide you with the means to quickly create, save, recall, and share custom topology views and layouts. You can:
• Filter to a set of sites
• Move devices
• Move sites
• Resize sites
• Insert link bends
• Save custom views
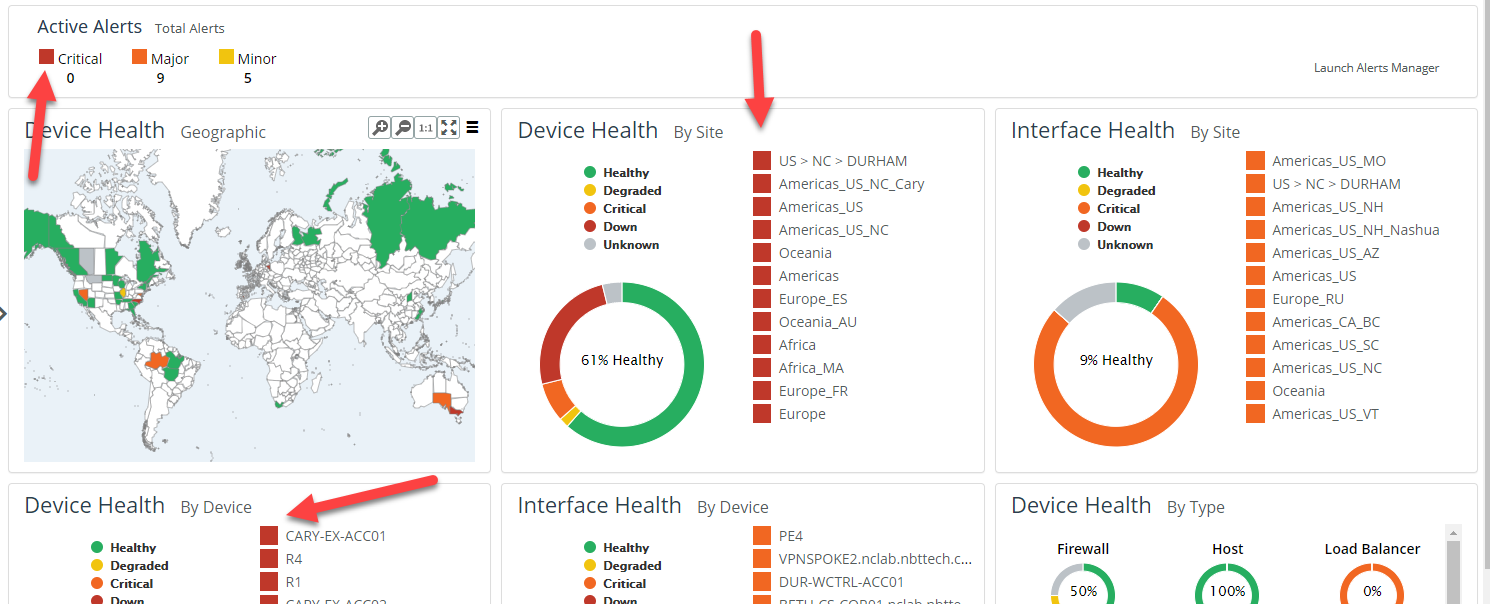
The health indicators continue to display current health of Sites, Groups, Devices, and Interfaces and active alerts, as shown in the following screen:
The health indicators continue to display current health of Sites, Groups, Devices, Interfaces, and active alerts.
The following topics are included in this section.
Viewing the Topology
The initial view, as shown in the following screen, displays top-level devices and site groups, and you can drill down to more information from there. In the following example, showing topology grouped by geography, “US” is a site group that contains other site groups (states). Within each state group are more site (city) groups. This is one way you might group your network elements.
The interface names now use the shortest name (either ifName or ifDescription).
Actions such as zoom and pan, and object selections persist for the duration of your NetIM session unless you reload the page in the web browser.
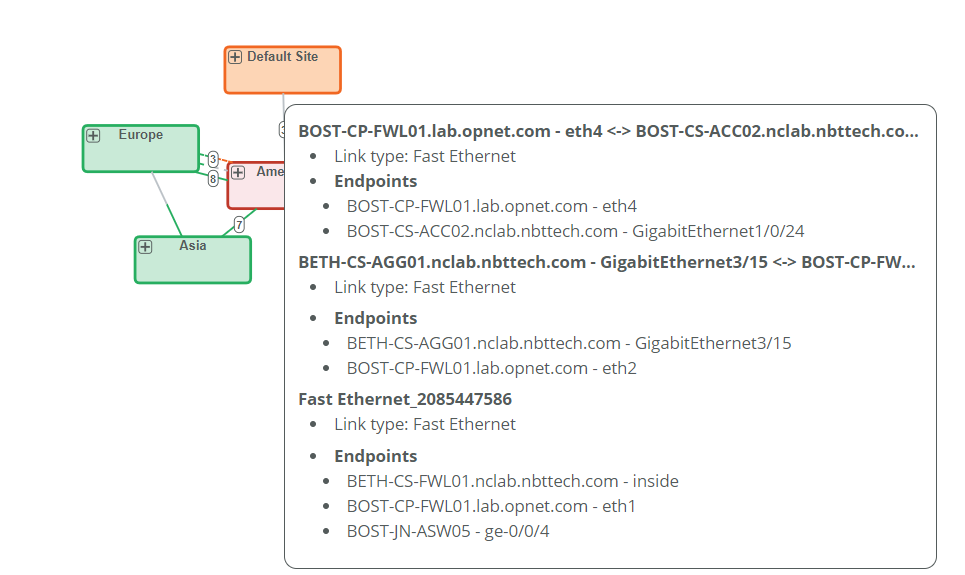
Mouse-over information is displayed for the interfaces, as shown in the following screen:
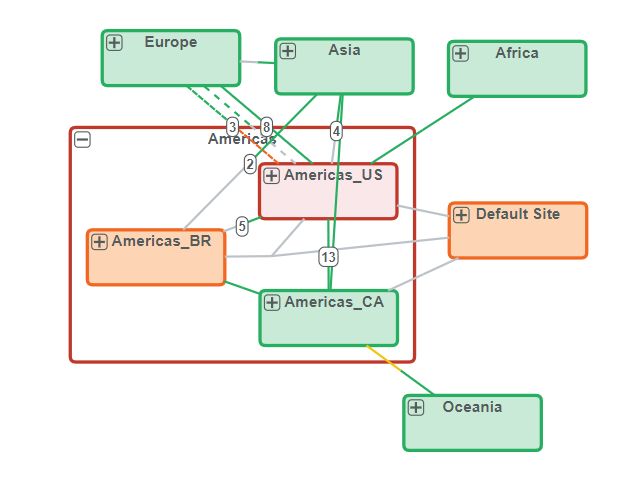
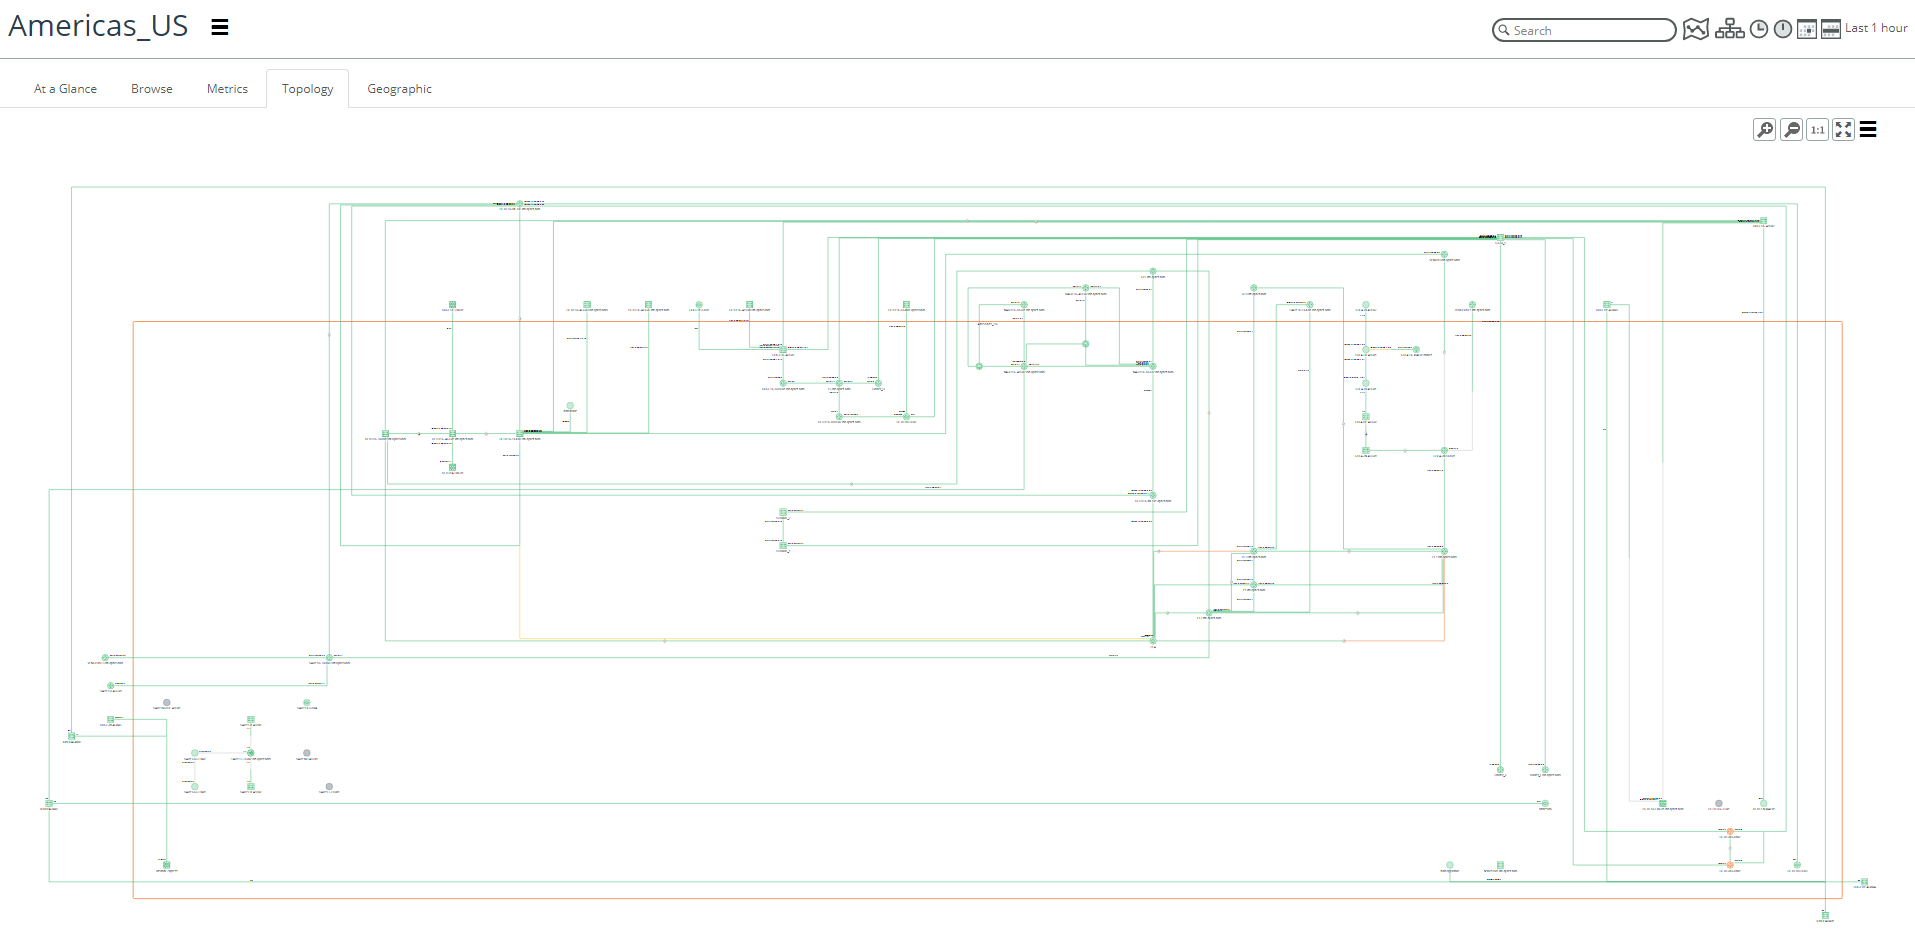
You can also drill down on the topology, by clicking on a site, as shown in the following screen in which America has been expanded:
To clear your Topology selections, use the Deselect All action. To return to the top-level (default) view, use the - icon in Topology controls.
For more information on stepping through a topology, see
Topology NavigationControls in the Topology Viewer
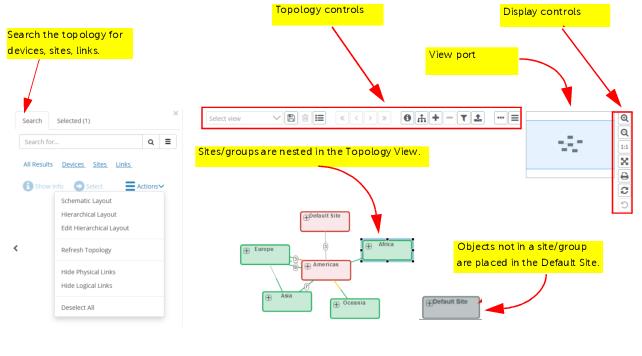
The available controls in the Topology Viewer provide you with ways to quickly navigate through your infrastructure, as well as to find more information. The following controls are described in this section.
Topology Element Controls
Topology element controls let you show information, expand or collapse all groups, perform actions on select elements, filter elements, or open the AppNetwork Path interface. The following table describes each control.
Icon | Control | Description |
| Select view | Allows you to select saved views (global or personal) from a pull-down menu. |
| Save View | Allows you to save a view for further reference. Saved views are displayed on the Topology Views page. |
| Delete View | Allows you to delete the current view if you are the owner of the view. |
| Manage Views | Takes you to the Topology Page, where you can edit or delete your saved topology views. |
| Show Info | Provides mouse-over information about Site/group, device, or link (for example, description). |
| Top-level Site-based layout | Returns to the default top-layer view of the topology. |
| Expand all groups | Expands all groups in the Topology view so long as the number of Sites/groups and devices does not exceed the limitations of the viewer (1,000 devices; 1,000 site groups). |
| Collapse all groups | Collapses all groups in the Topology view. |
| Filter | Lets you filter the devices displayed in the view by Device Vendor or Device Type. Filtering devices does not hide the devices. Rather it de-emphasizes them in the view. |
| AppNetwork Path | Launches the AppNetwork Path interface, which lets you find the path between a given source and destination, at the bottom of the screen. See “Using AppNetwork Path Microanalysis for more information. |
| Topology Actions | Displays a pop-up menu of actions for viewing the topology. For more information, see
Topology Actions. |
| Object Actions | Displays a pop-up menu with a series of display and edit options to perform on the selected object. For more information, see
Object Actions |
Topology Actions
The available actions for viewing the topology depend upon the object type and how many are selected.
.
Actions | Description |
Schematic/Organic Layout | Allows you to toggle back and forth from schematic to organic layout. |
Hierarchical Layout | Requires that devices are defined in hierarchical layer groups. |
Edit Hierarchical Layout | Allows the admin to determine what groups appear in the hierarchical layout. |
Refresh Topology | Updates the topology view. |
Show Neighbors | Displays all connected devices. |
Fully Expand Group | Expands all groups. |
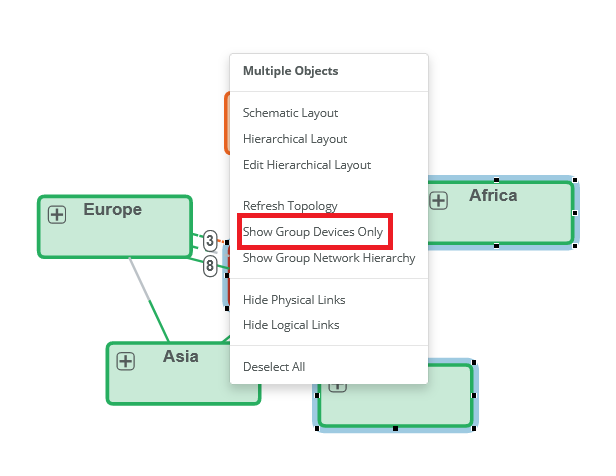
Show Group Devices Only | Limits view to group devices. |
Show Group Network Hierarchy | Displays the complete network hierarchy of groups. |
Hide Physical Links | Removes physical links form the display. |
Hide Logical Links | Removes logical links form the display. |
Deselect All | Deselects all objects selected in the topology. |
Object Actions
The available actions for a selected object depend upon the object type and how many are selected.
All objects have the Deselect All option available.
Options | Description |
View Site/Group/Device Overview | Launches the curated object view with the “At a Glance” tab selected. |
Browse Site/Group/Device | Launches the curated object view with the “Browse” tab selected. |
View in Metrics page | Launches the Metrics page with the object selected. You can add metrics or other objects to the Metrics page view. |
View Site/Group Topology | (Site/Group only) Launches the curated object view with the “Topology” tab selected. |
Delete | (Site/Group only) Allows you to delete a selected Site/Group. |
View Collected Files | (Devices only) Opens a window that displays the collected configuration file(s) for the device. |
Open CLI Live | (Devices only) Opens the CLI Live dialog, which lets you send commands to the device (for example, show interfaces). You must have an account with the NetIMAdmin role to run CLI Live. |
Open in Device Manager | (Devices only) Opens the Device Manager, in a new window, with the device highlighted. |
Add to Site/Group | Allows you to add a Site, Group, or Device to a Site or Group. |
Deselect All | Deselects all objects selected in the topology. |
Display Controls
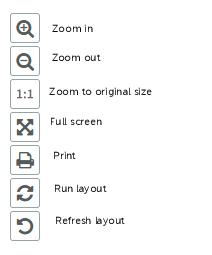
On the right-hand side of the Topology Viewer are display controls. These controls let you change the zoom level, print the display, refresh the display, and change the way you interact with the display, as follows:
The following table describes each control:
Control | Description |
Zoom in | Click to zoom in on the topology. |
Zoom out | Click to zoom out. |
Zoom to original size | Returns to the original aspect ratio for the topology view. |
Full screen | Creates a new full-screen page. |
Print | Unlike the “Print Screen” function on your computer, this option lets you print the topology view with no frames or additional dialog boxes or menus appearing. |
Run layout | Refreshes the layout, returning to the top-level model. |
Refresh layout | Refreshes the layout, returning you to the original zoom and aspect ration but not returning to the top-level model. |
Hierarchical Topology Layout
You can display sites and groups in a hierarchical layout. From a Site or Group
Topology tab’s ellipsis menu

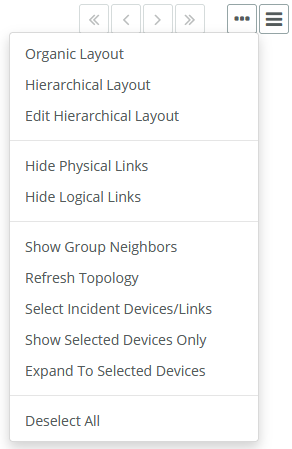
you can perform a variety of tasks and display the topology by a variety of layouts, including Organic and Hierarchical, as shown in the following screen.
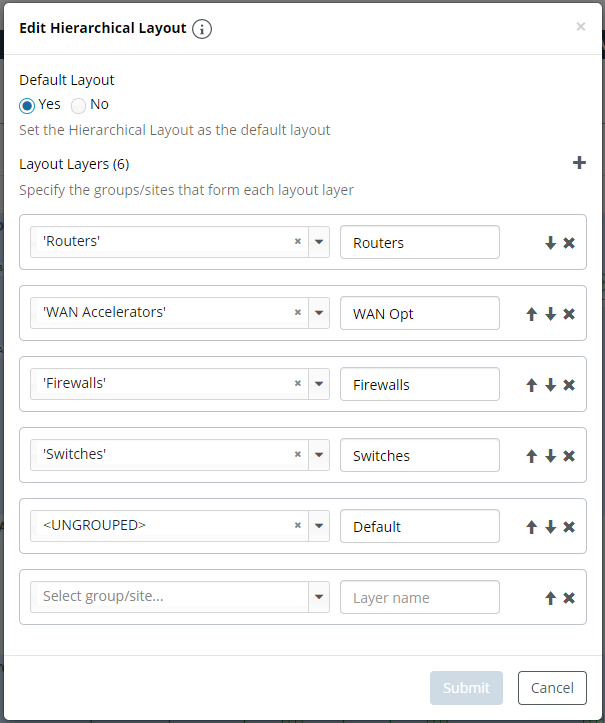
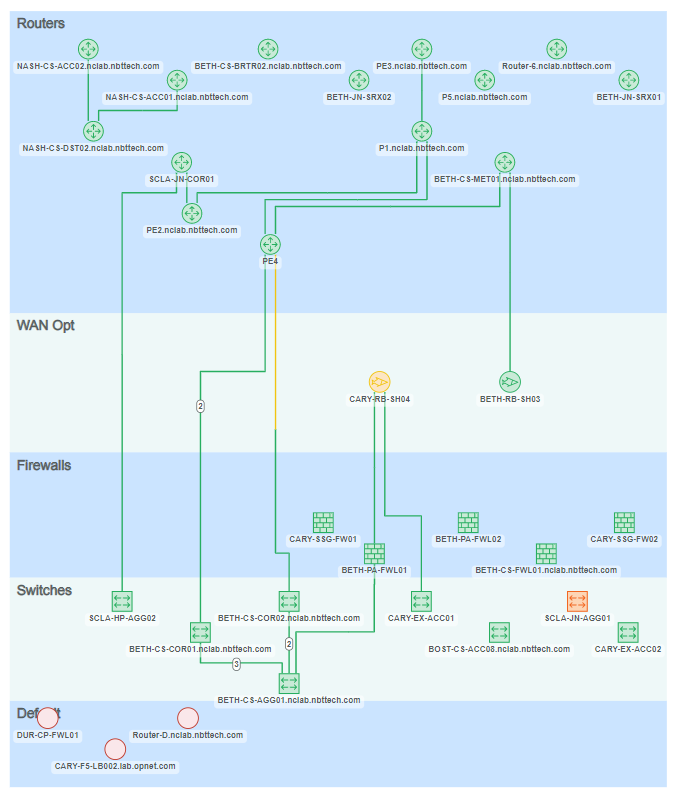
The Hierarchical layout defaults to a single layer, but you can define the layers and order and can set the hierarchical layout to be the default layout, as shown in the following screen:
Administrators can set up the layers for the hierarchical topology and make it the global default. However, if individual users set up their own configuration, the individual user’s configuration will be used until they delete all the layers.
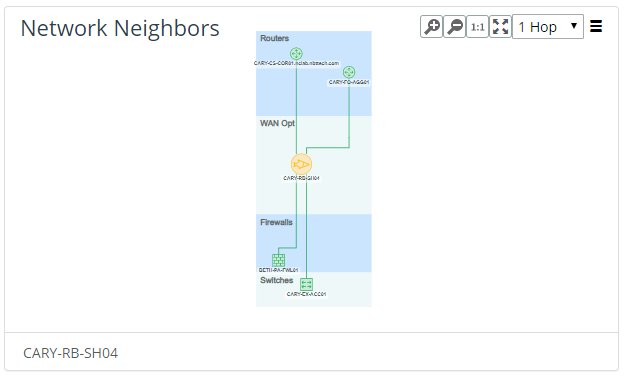
The layers and default you set here also apply to a device’s Network Neighbors panel. The following example is a Hierarchical layout applied to a site topology with layers assigned as indicated in the screen:
The following same hierarchy is applied to the Network Neighbors panel:
Similarly, in the
Topology Viewer, using the ellipsis menu

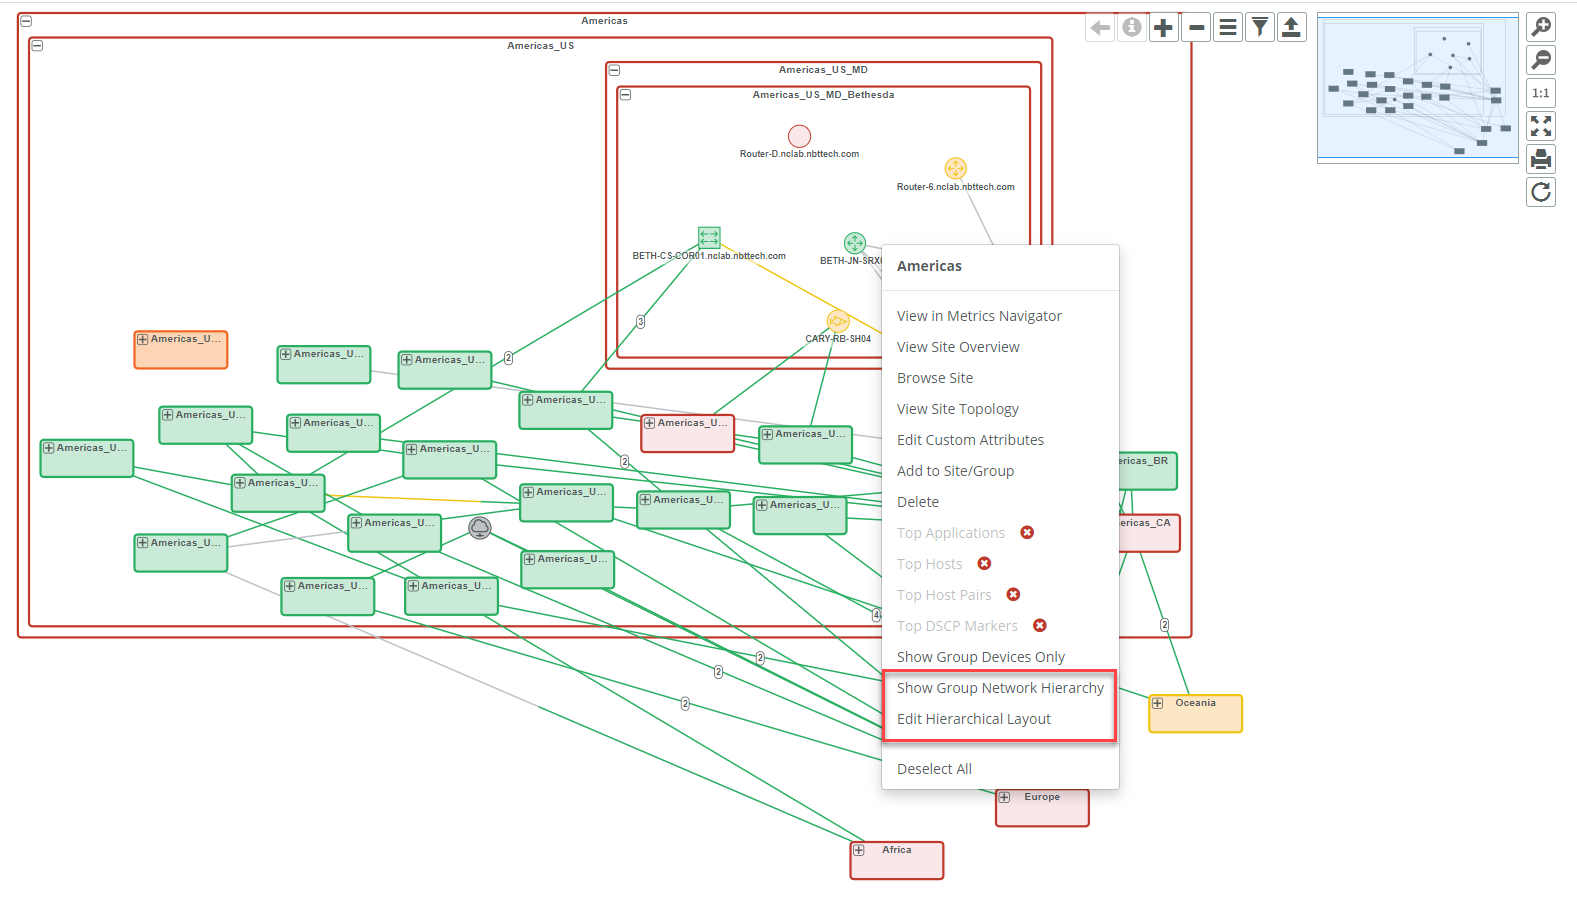
you can perform a variety of tasks and display the topology using a variety of layouts, including Organic and Hierarchical, as shown in the following screen.
You can also use the right-click menu to perform the same operations:
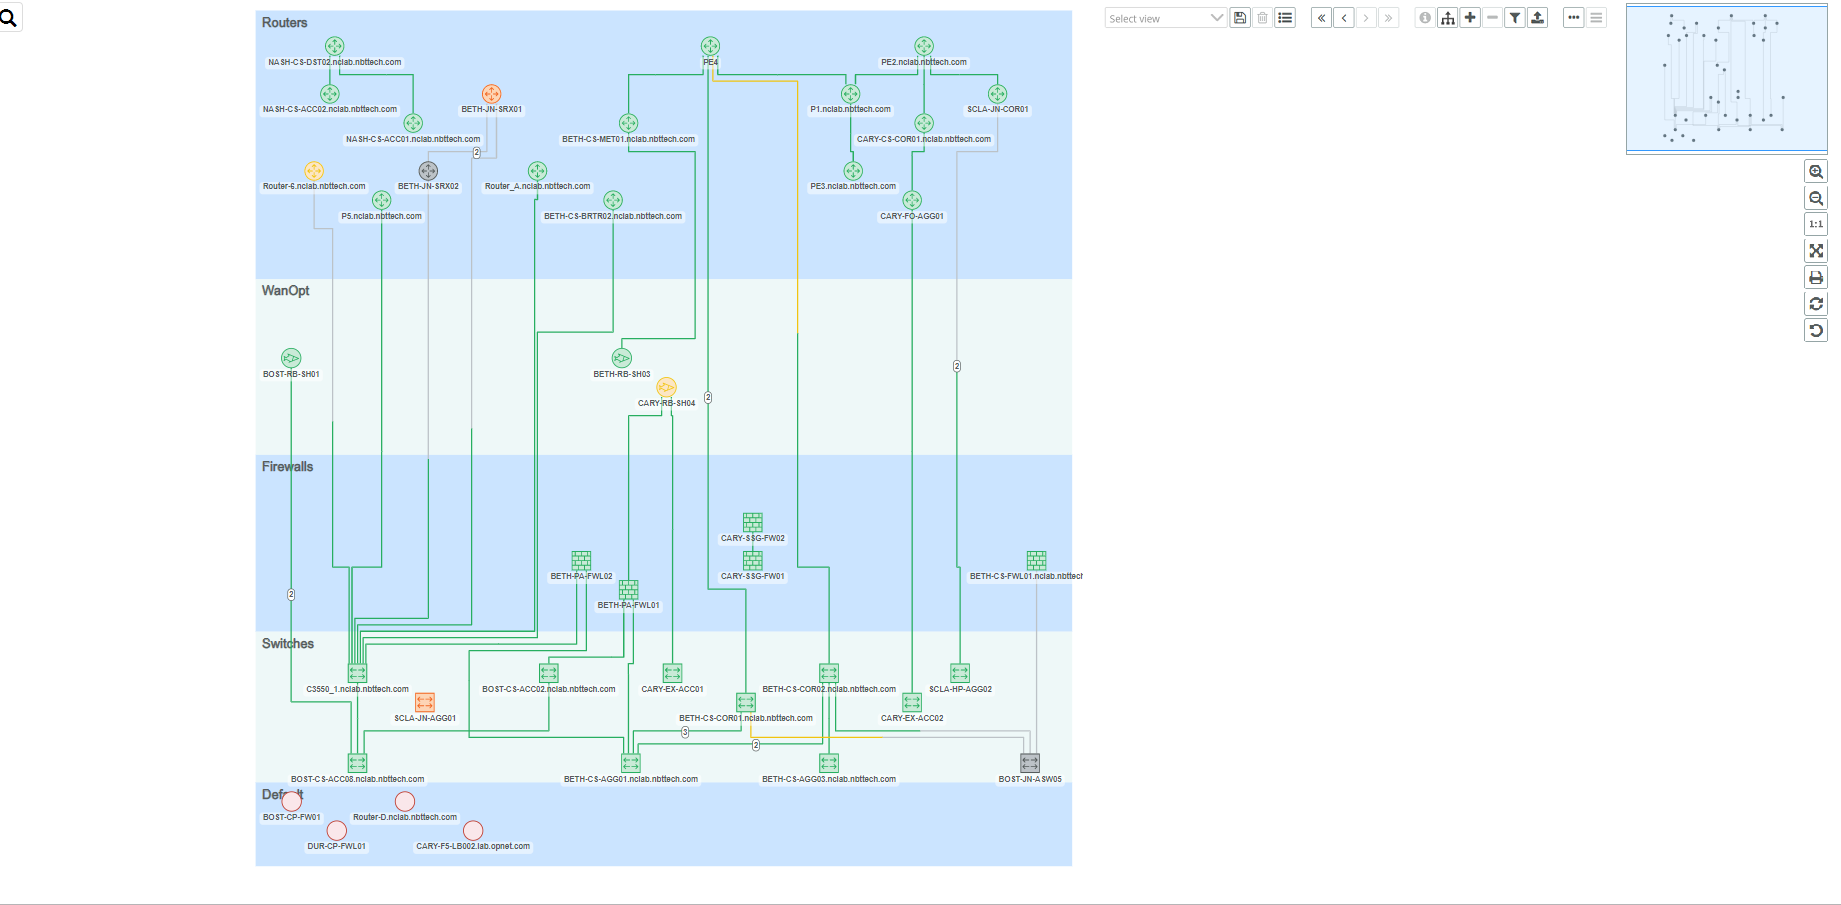
The hierarchy you define on the Network Topology page is independent of the hierarchy you define in the Site/Group Topology and Network Neighbors views, but is similar in capability as shown in the following screen.
Topology Navigation
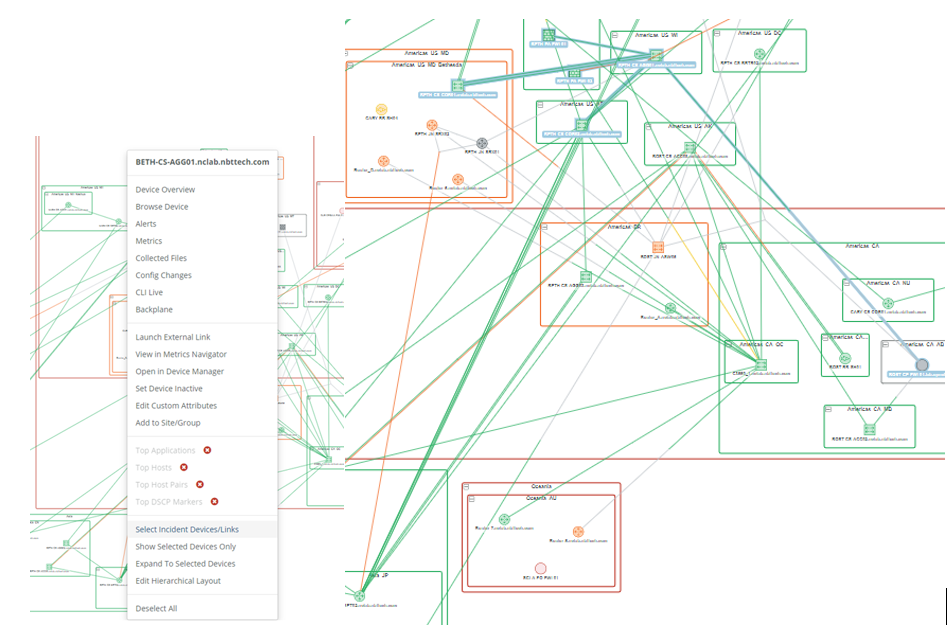
The Topology Viewer has a right-click menu option to “Select Incident Links/Devices.” This feature allows you to highlight a device’s connections, as follows:
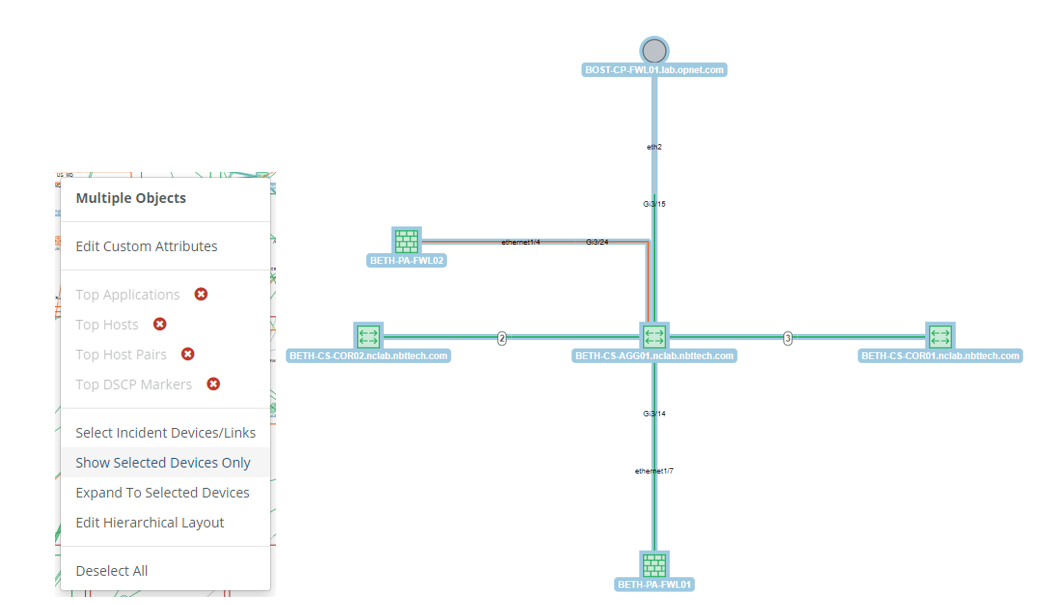
You can then choose the option to “Show Selected Devices Only” to further focus on just the device and its immediate neighbors, as follows:
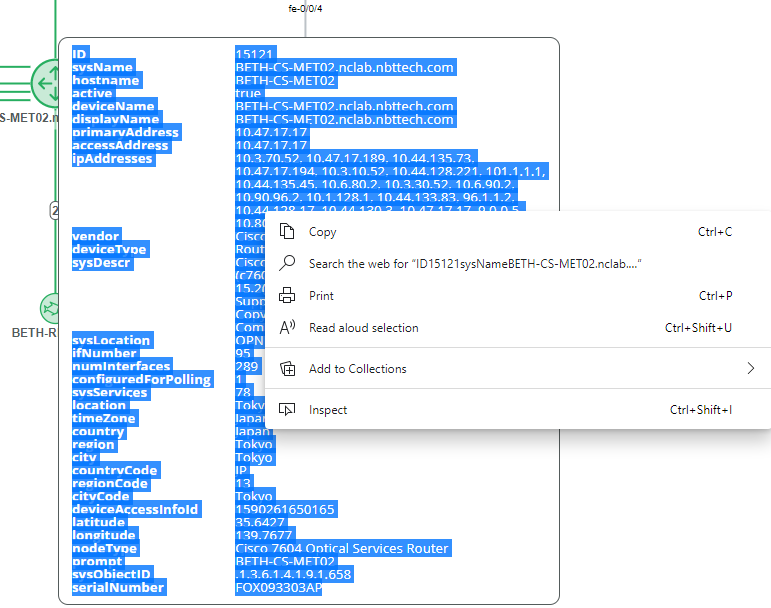
Additionally, the topology view’s mouse over tool-tip information can be selected and copy-pasted for reference in documents or presentations:
You can also use right-click mouse operations on an object in the topology in addition to left-click mouse selection and-the hamburger

menu.
Link objects are selectable and have associated device and interface endpoint information in the information panel in the Topology Viewer, as shown in the following screen:
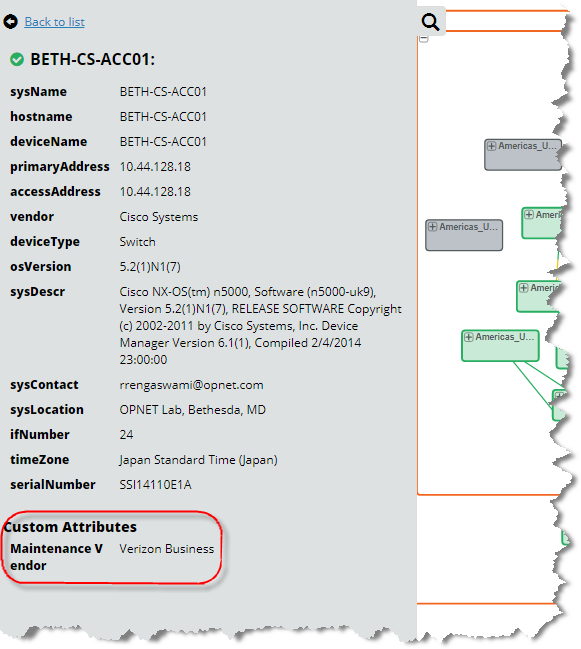
In addition to standard attributes, you can view custom attributes assigned to an object in the Object Details panel of the Topology Viewer, as follows:
When you navigate from the Topology Viewer and return to the Topology Viewer, the previous state is preserved including the state of the AppNetwork Path rendering.
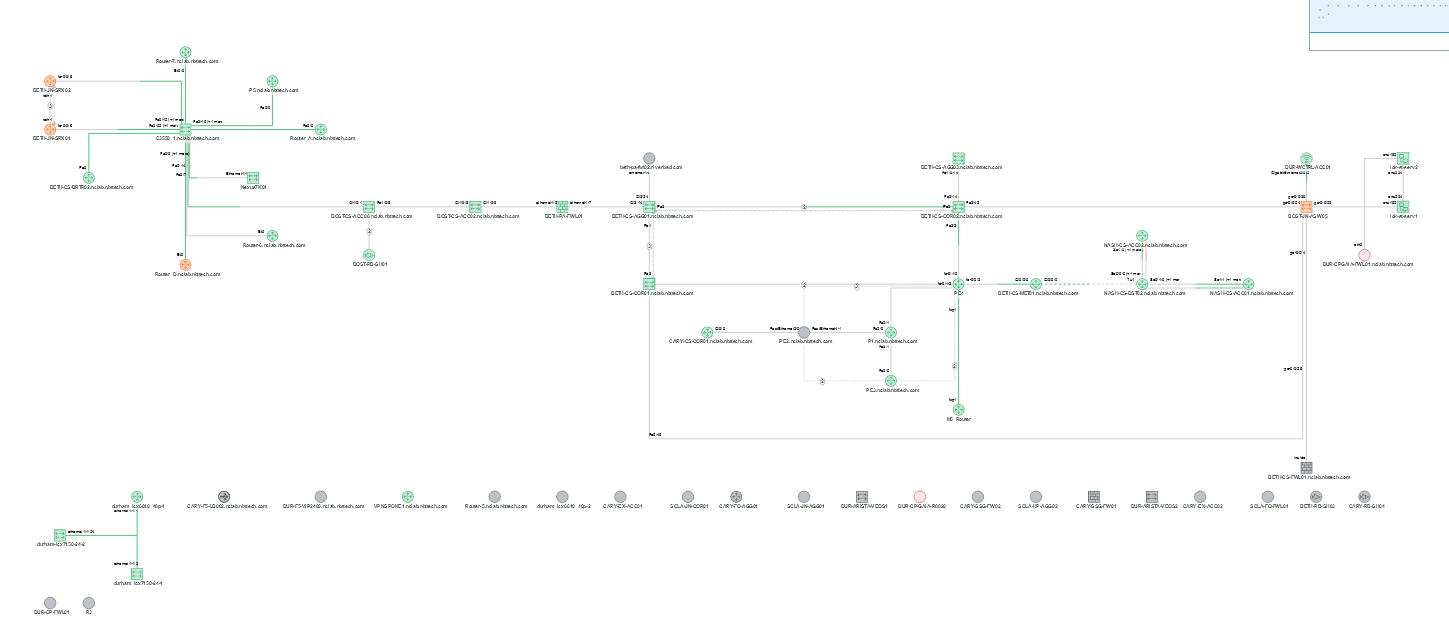
You can select multiple sites or devices and then select Show Group Devices Only to view the selected set of devices in a schematic layout, as shown in the following screens:
Use the back navigation button

to return to the standard topology view.
You can save any edit you make and save any type of topology view, including hierarchical views, for later recall or sharing. You can also manage your views from the Topology Views page, as shown in the following screen:
Monitoring Health within the Topology Viewer
In addition to the out-of-the-box default health and default alerts, NetIM allows you to provide your own parameterization for health and default alerts by using the
Alerts Profile Page, which now has a Health check box for alert profiles that you can use for calculating health. For more information, see
“Configuring an Alert“.
The Alerts wizard “Default Alert” and Default Thresholds page continue to control the default alerting and default health calculation. However, the default alerts are now on-crossing as opposed to continuous. This change from previous NetIM releases dramatically reduces the alert count through basic alert suppression and allows you to focus on “What things happened in the last hour” (or time scope of page).
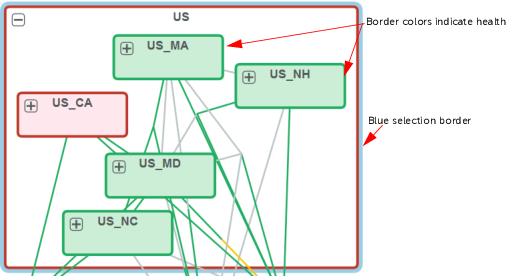
While in the Topology Viewer, you are still monitoring the health of your network. Notice that the health of a group is indicated by the color of the border and the fill. The colors used are the same as the colors indicating health elsewhere in NetIM, making it familiar and easy to detect problems when they occur. In the example below, we are looking at the border for a group. “US_NH” is a group within the “US” group. Its green border indicates 100% health. However, notice that the selection border (blue), has a red border within, which indicates at least one of the objects within the US group is down. The group “US_CA” is red, meaning that the down object is contained in this group. The color of the container and border indicates the health of the least healthy object contained in a given group, as shown in the following screen:
From the site level, you can drill-down to get more health information about children of the parent group. For more information about health, see
“Monitoring the Health and Status of Your Infrastructure".
Link coloring also indicates health. In the example shown below, a link from the “IL” group to the “US_MD” group is in a degraded state (yellow). Split health coloring is possible on the link, since each interface has its own health. In the example shown below, the health for the source interface in the IL group is degraded, while the destination interfaces are healthy. Notice the change from yellow to green, indicated by the arrows in the figure below.
Link Coloring
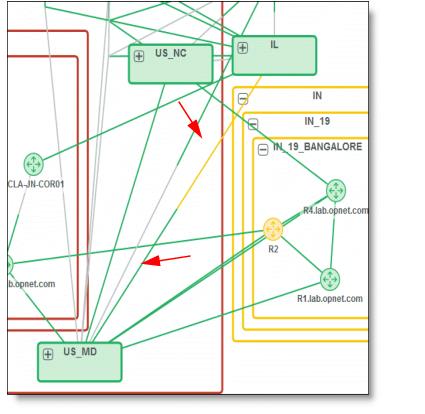
When a link represents an aggregate bundle, the color shown will represent the least healthy interface on that side of the bundle of links.
Searching the Topology
If you want to find a particular device, link, or group, you can use the Search functionality in the
Topology Viewer. To use Search, click the

icon on the left side of the
Topology Viewer. The following dialog box appears.
Searching the Topology
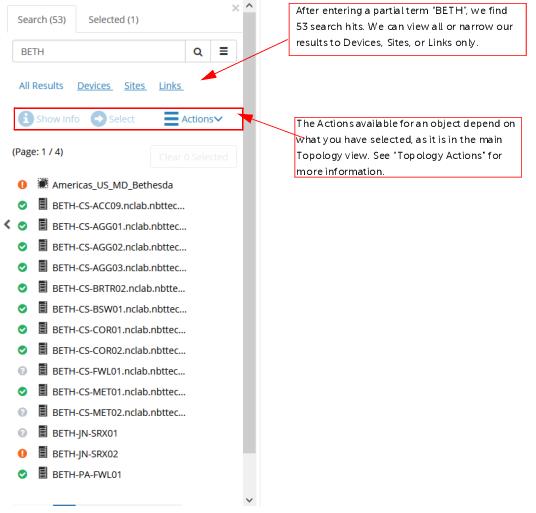
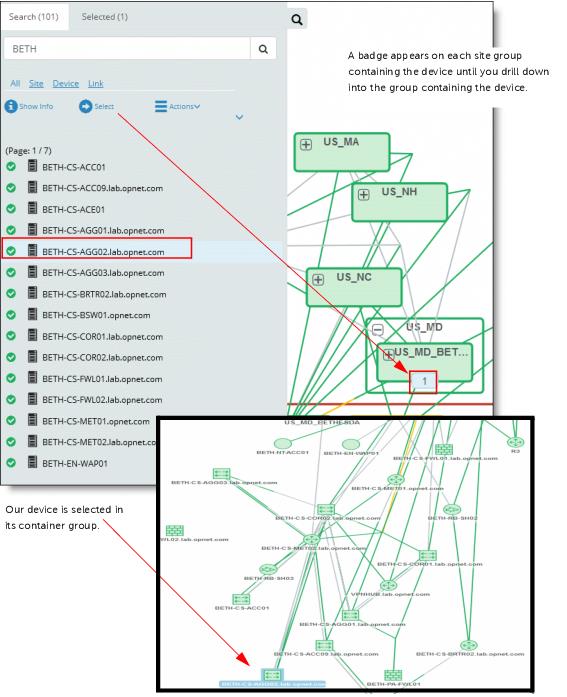
When you select an object in your search results, you may choose Show Info, which works the same way as the Show Info button in the main Topology view, or you may choose Select. In the example below, we have selected a device in our search results and pressed Select. Notice that there is a badge on the site group “US_MD”, which indicates that our selection is contained within that site group. Next, we drill down until we find the device in a site group. The device is selected for us in the topology.
Using the Select Function in Search
Topology View for Groups and Sites
The
Topology tab of the Group and Site pages allows you to view the connectivity and health. The layout in the
Topology tab now defaults to a high-value schematic layout and provides interface name annotations, object information panels using mouse over, object selection, and right-click operations. You can switch to the organic layout using-the hamburger

menu and expand to full-size by clicking the expand

icon, as shown in the following screen:
Working with the Host View
NetIM supports a Host object view page and drill-down to the connected device and connected interface.
To work with the Host view, follow these steps:
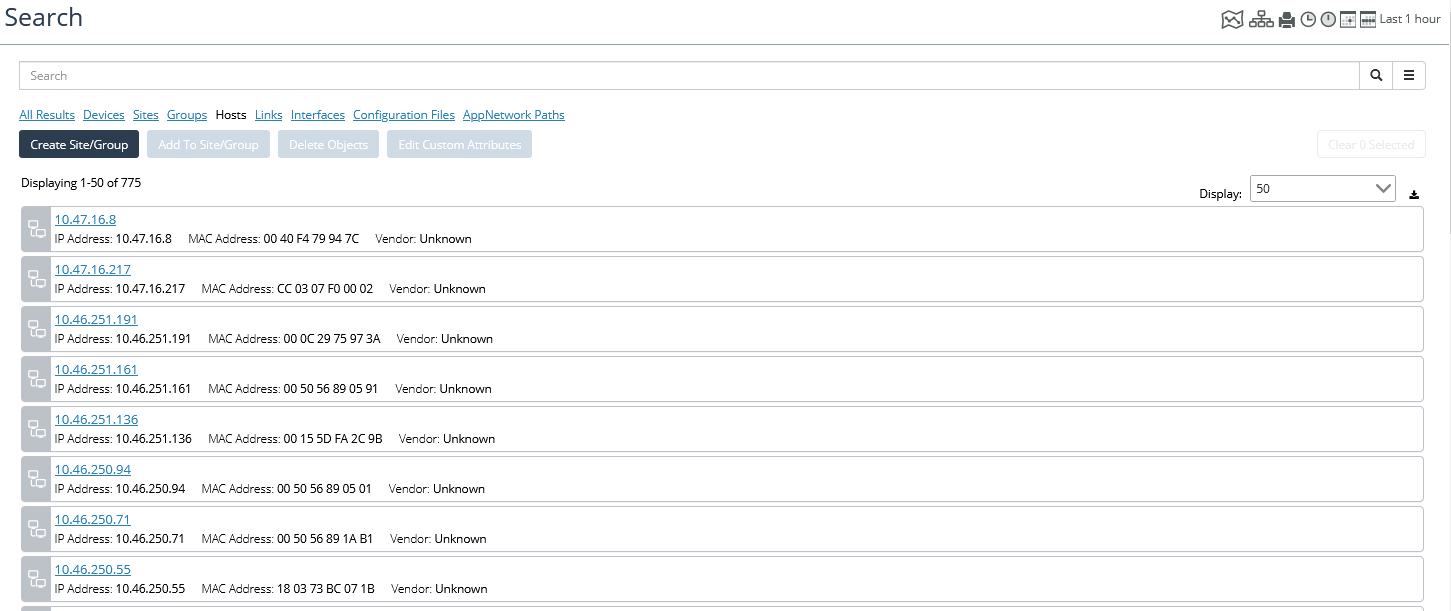
1. Click on the Hosts link on the Homepage, as shown in the following screen:
The Search page displays with a list of hosts, as shown in the following screen:
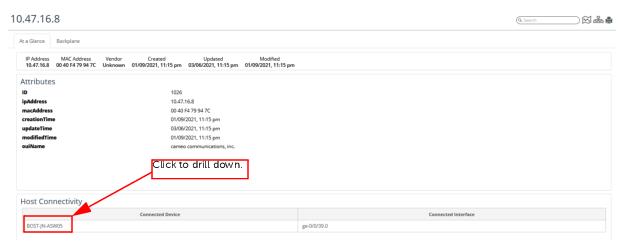
2. To view the host page for a host, click on the link associated with the host.
The Host page appears, displaying the At a Glance tab, as shown in the following screen:
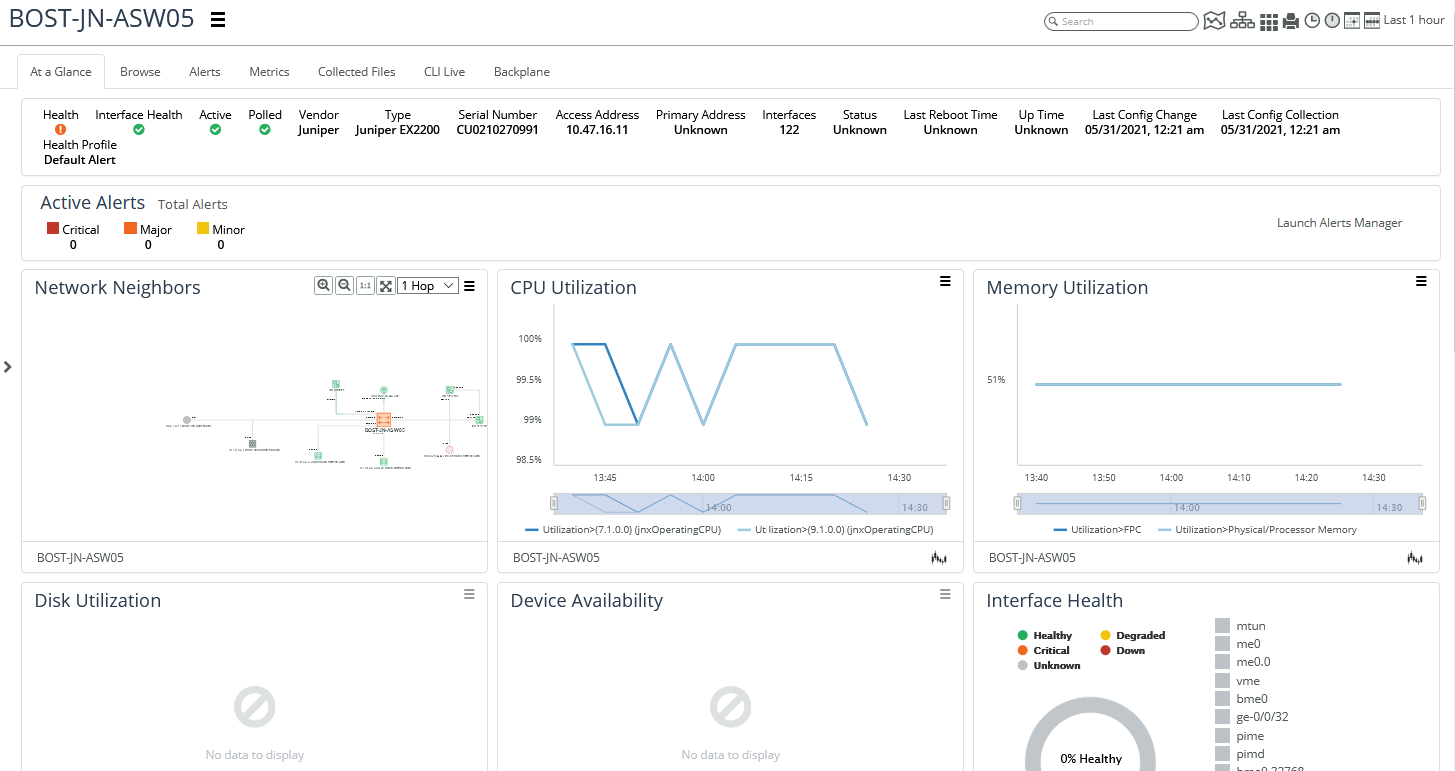
3. To drill down to the device information, click on the link in the Host Connectivity frame. A device page like the following appears:
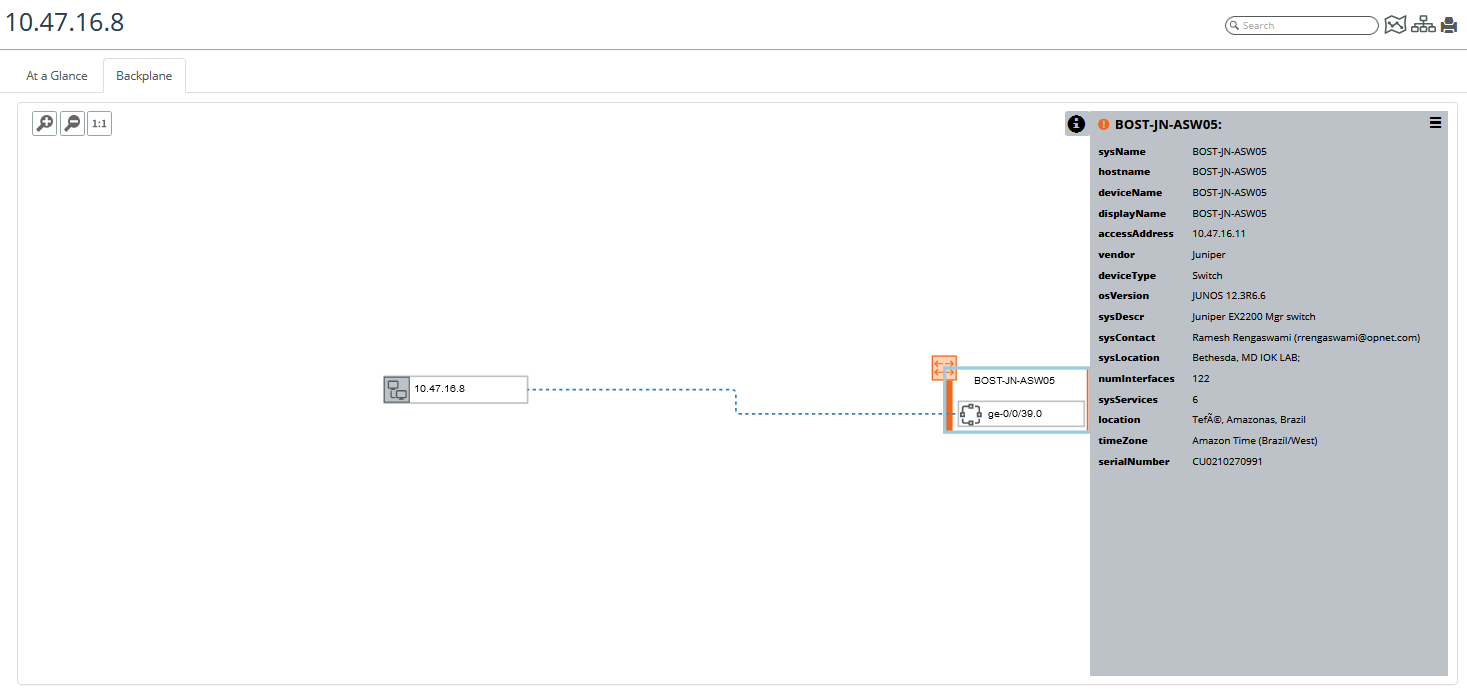
4. To view a schematic, click on the Backplane tab of the Host page.
A screen like the following appears:
5. To view information on the objects, highlight an object and then clink the info icon

in the upper right corner. A screen like the following appears:
The Device Page Backplane View
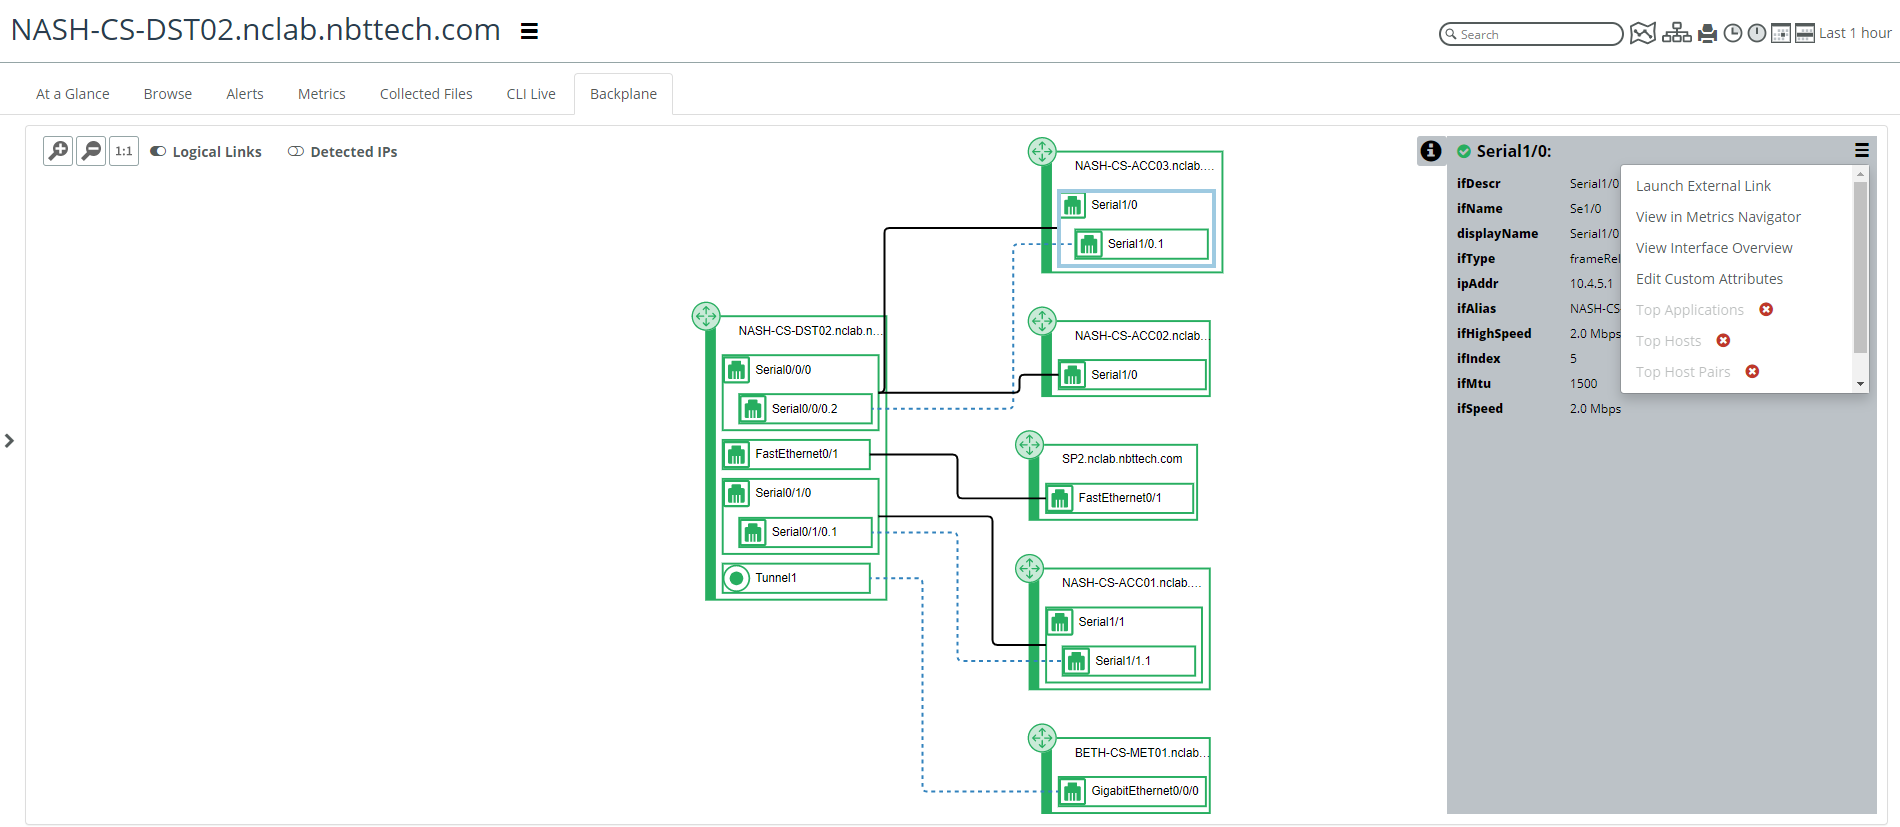
The Backplane tab of the Device page

provides the ability to view all direct neighbors of a device as well as the health and attributes of the device, its connected interfaces, its neighbor devices, and neighbor interfaces, as follows:
Additionally, the backplane view optionally provides logical link connectivity and host connections. The backplane view allows you to launch to the neighbor devices and interfaces using the

menu.
The Backplane View tab is also available on the Interface page and Host page to provide you with a graphical view of what is connected to the interface and host.
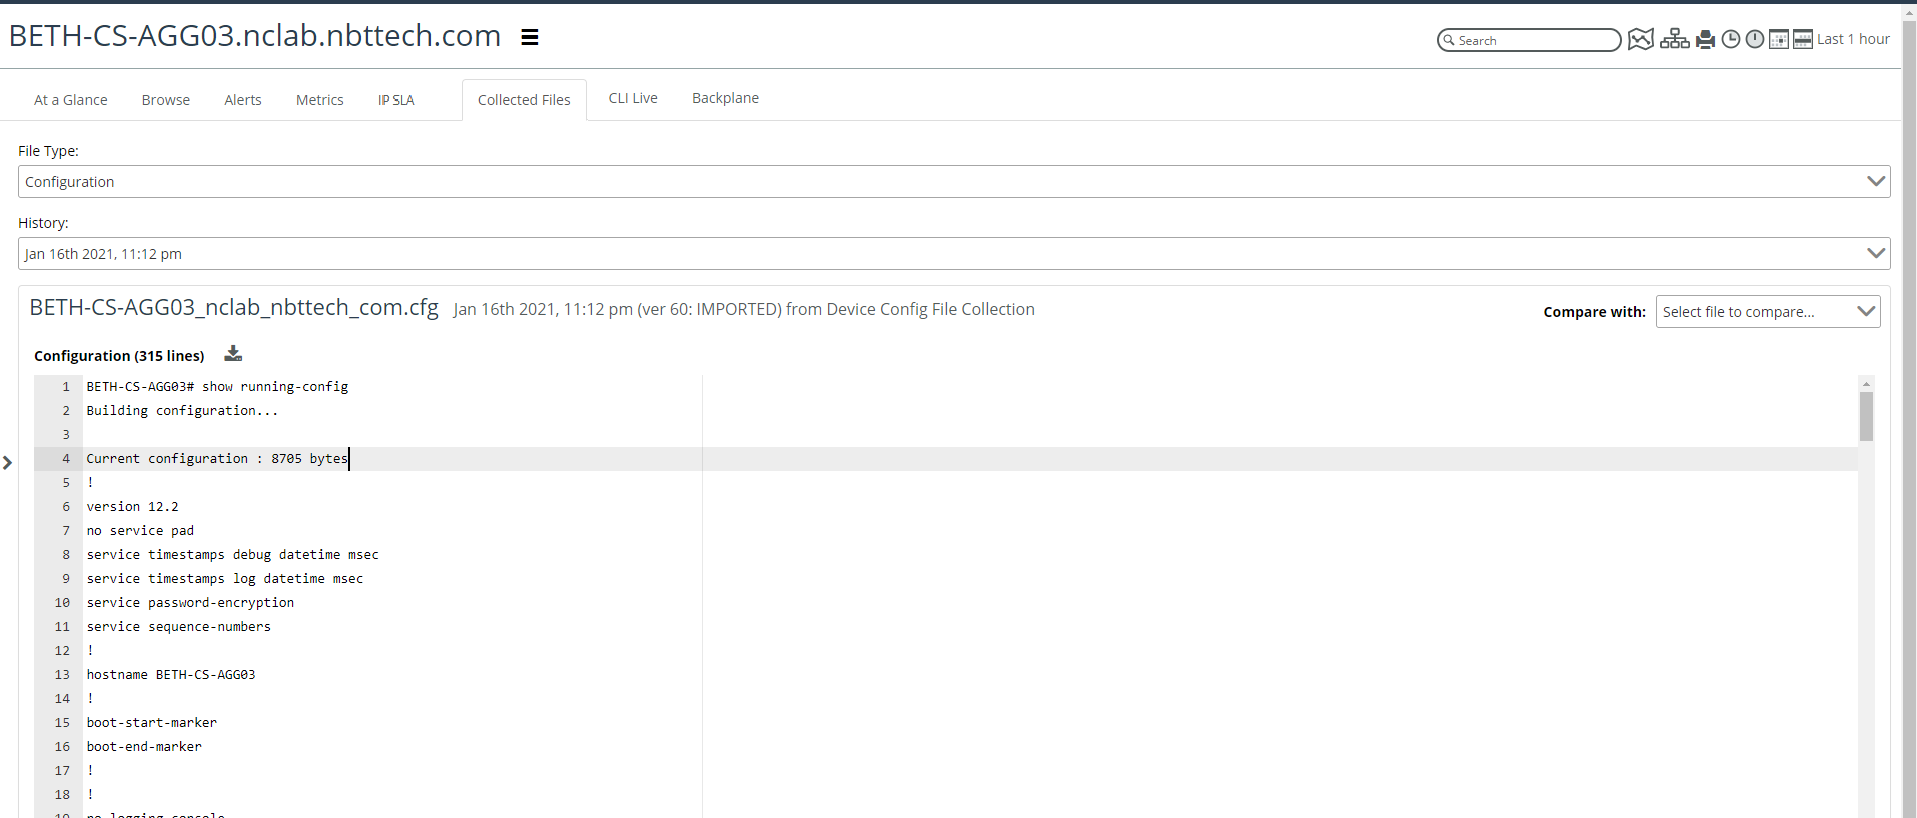
The Device Page Collected Files Tab
The Device page’s Collected Files tab has been re-architected and re-imagined to add additional functionality with a new, modern look-and-feel, as shown in the following screen:
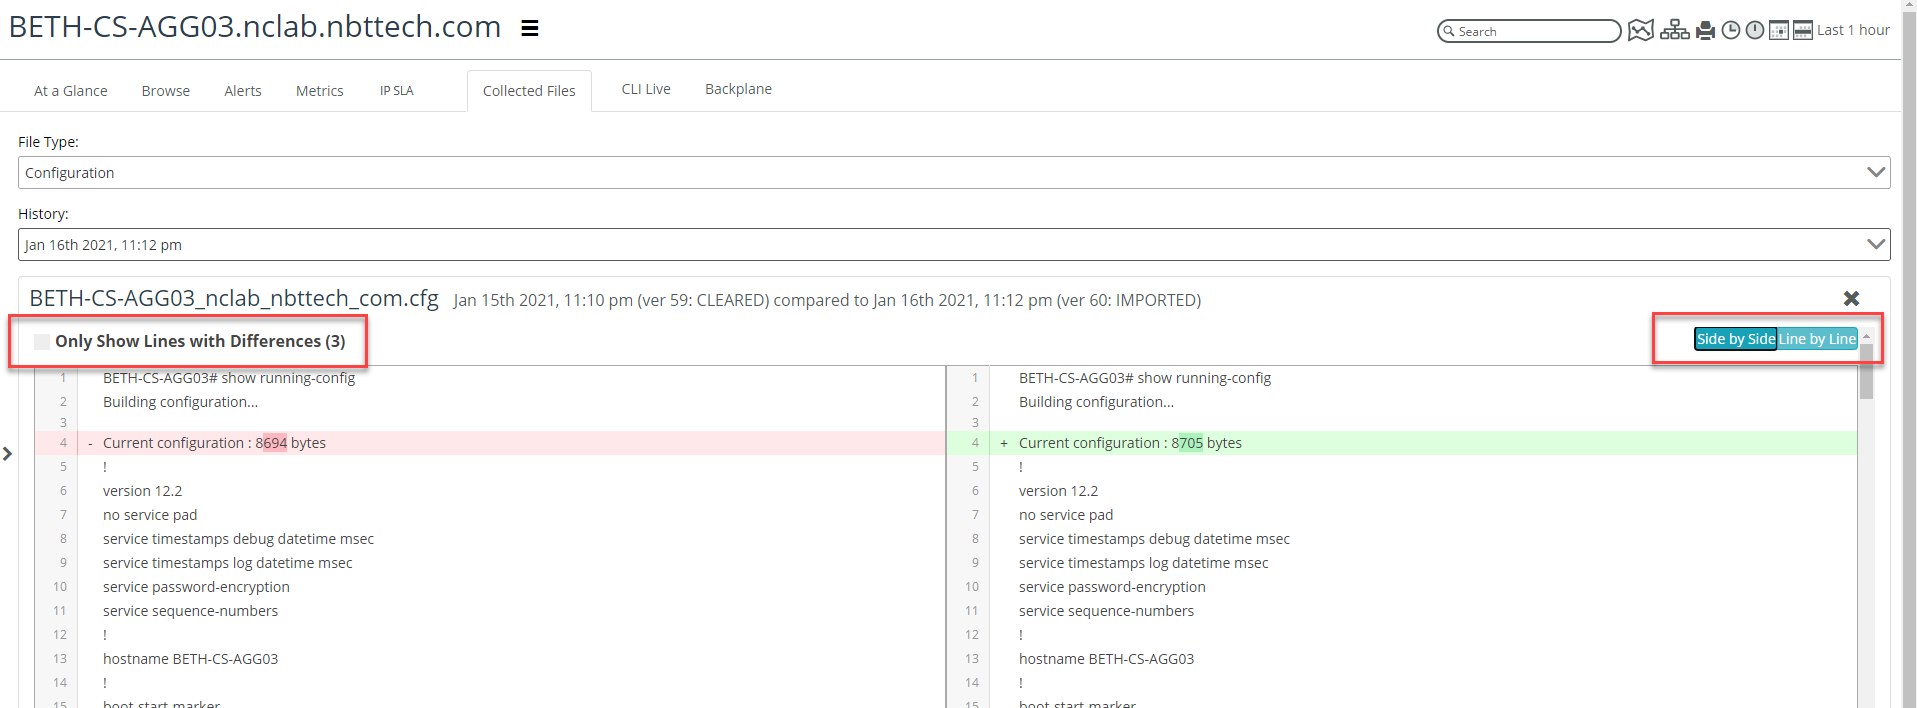
The side-by- side comparison feature has also been enhanced to display how the changed lines are displayed, so you now have the option to view the configuration file differences line-by-line or view just the differences using the Show Differences Only option, as shown in the following screen:
For API and browser scalability reasons, the maximum number of lines that can be displayed in the “Collected Files” tab of the Device page is 40,000 lines.
Saving and Managing Topology Views
You can save a topology view by clicking on the
Save View 
icon. The view is then saved on the
Topology Views page, which you can access by clicking on the
Manage Views 
icon, as shown in the following screen:
The Topology Views page defaults to your saved views, which you can view, edit, or delete by selecting the eye, pencil or x icon under the Actions column. You can also delete a view by selecting a view and clicking on the hamburger menu.
At the top of the page, you can toggle the My Views radio button to the left, which will include global views in the display, as shown in the following screen:




 menu.
menu.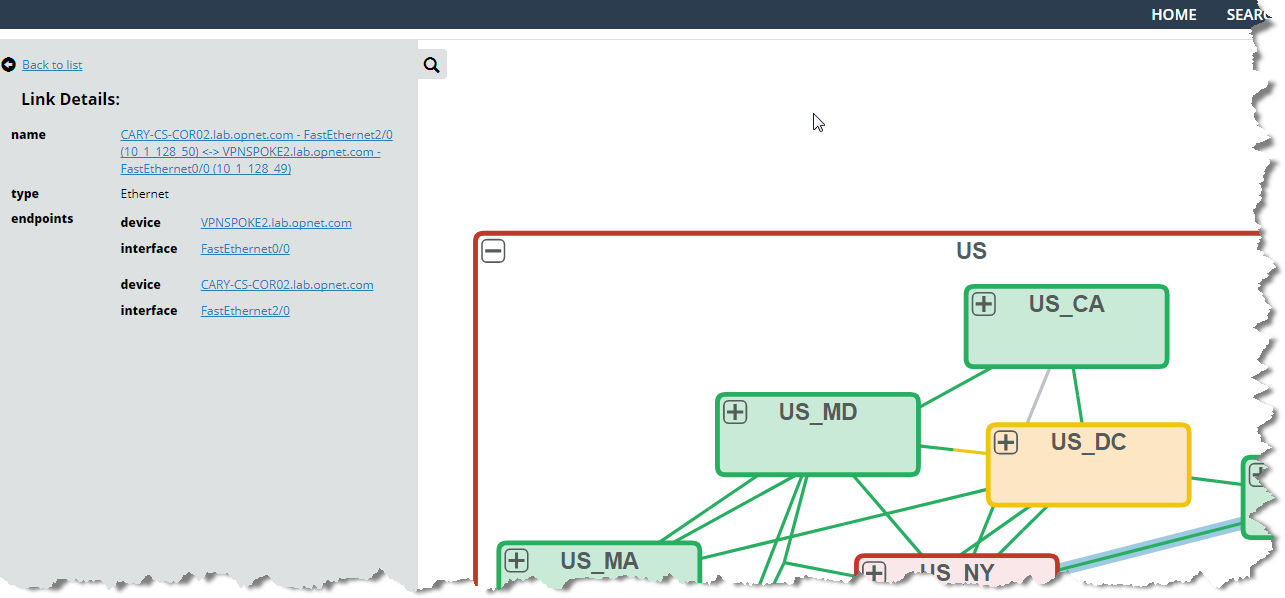
 to return to the standard topology view.

 icon on the left side of the Topology Viewer. The following dialog box appears.

 menu and expand to full-size by clicking the expand
  icon, as shown in the following screen:


 in the upper right corner. A screen like the following appears:
 provides the ability to view all direct neighbors of a device as well as the health and attributes of the device, its connected interfaces, its neighbor devices, and neighbor interfaces, as follows:
 menu.
menu.