Using the Metrics Page
The Metrics page provides visual analytics for your objects and their metrics. In the Metrics page, you can view metrics over time, as well as select and organize metrics information in a way that is meaningful to you and aids you in troubleshooting.
This section includes the following topic:
Viewing Metrics using the Metrics Page
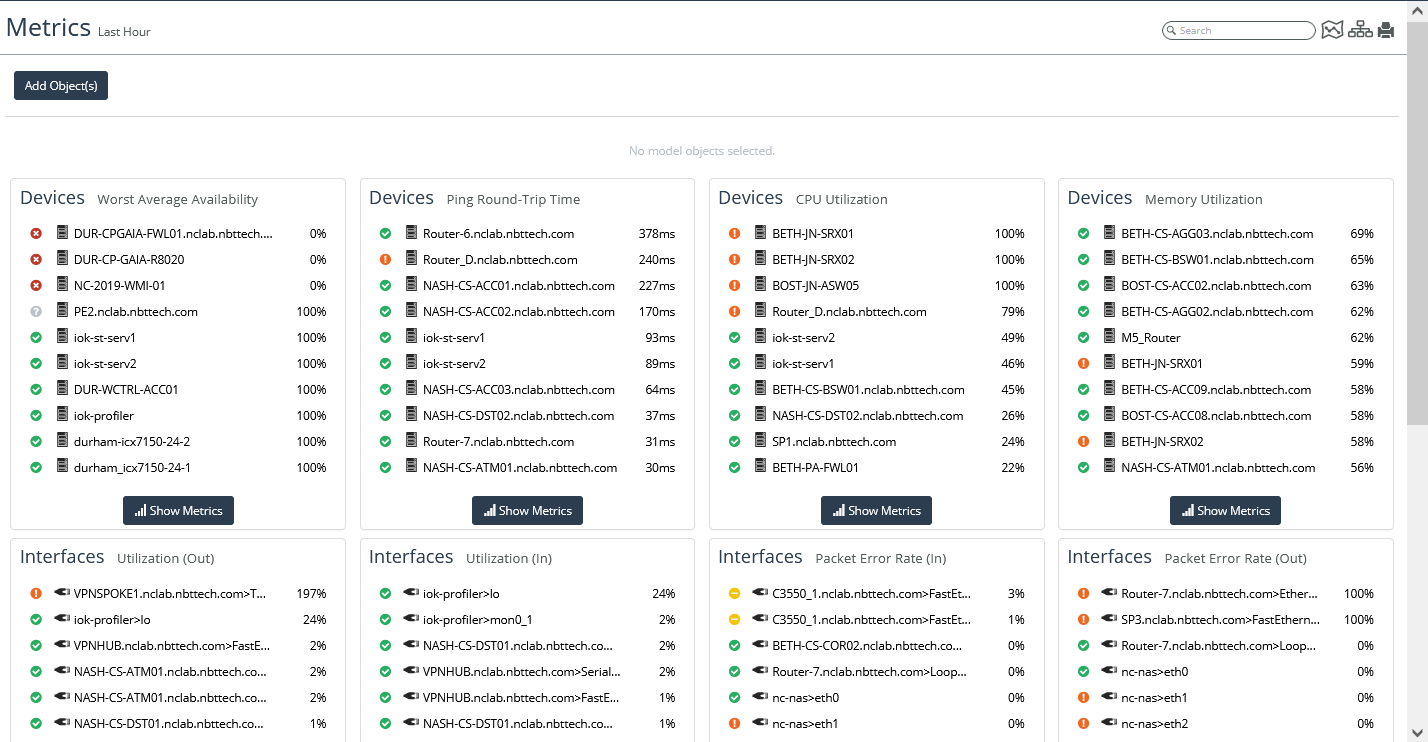
To launch the Metrics page, choose Metrics on the menu bar. A selection of metrics are immediately available in the Metrics page, as shown in the following screen:
Show Metrics
From the main screen, you can select objects in a panel and click the Show Metrics button to see the graphs of those metrics for the given object(s), as shown in the following screen:
You can add Object and Metrics to the display using the Object and Metrics buttons

You can also select tabular view from the display icons

, as shown in the following screen:
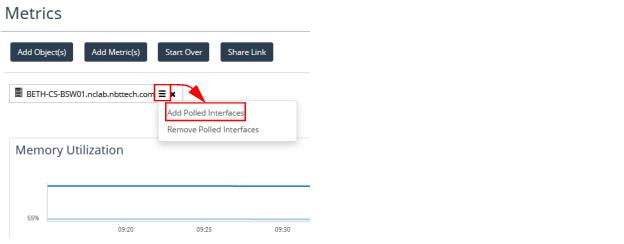
The Metrics page also gives you an option to add all of the polled interfaces for a device quickly. Choose the menu icon on a device and select Add Polled Interfaces, as shown in the following screen
A screen like the following appears:
After you add polled interfaces, an icon for each interface appears at the top of the screen.
• To display all interfaces, click the and n more icon.
• To hide those interfaces once they are all displayed, click the Less icon.
• To remove a single interface and its metrics from the navigator, click the X on the icon.
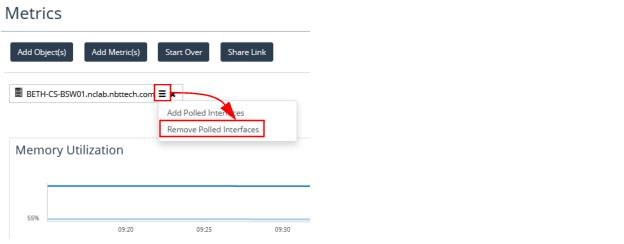
• To close all interfaces, select the device and choose Remove Polled Interfaces from the hamburger menu, as shown in the following screen:
You can also graph metrics that contain multiple components as an aggregate average or graph each component individually. For example, you can view CPU Utilization for each CPU of the firewall named Firewall-PA-2020 or you can view CPU utilization as an aggregate average of all the CPUs. By default, the Metrics page will display in the individual component view.
You can toggle between the two modes using the

and

buttons, as shown in the following screens:
Chart Controls in the Metrics Page
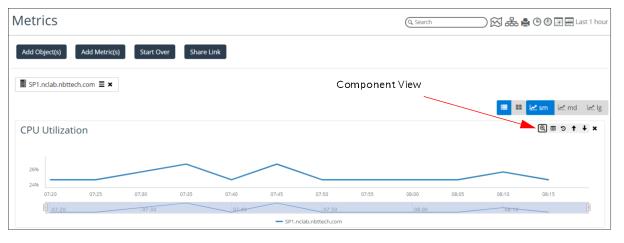
The chart controls are labeled as shown in the following screen:
Arranging Metrics in the View
The Move Up and Move Down icons let you reposition where the chart appears on the screen, so that you can arrange metrics for emphasis. Remove a chart if you decide you do not want to display it.
Available Actions in Metrics Page
The action buttons shown at the top of the Metrics page are described below.
Button | Visible in | Description |
Add Object(s) | All screens | Opens a Search dialog that lets you choose objects to add to the Metrics view. After you choose the object(s), click the Add Selected button. |
Add Metric(s) | Show Metrics | Opens a dialog that lets you choose additional metrics you want to view for your selected objects. See
“Adding Metrics". |
Start Over | Returns you to the main Metrics page screen with no objects or metrics selected. |
Share Link | After you have the Metrics view the way you want it, with all of the objects and metrics of interest, you can share this view with others. When you click Share Link, a hyperlink is shown, which you can then copy and paste into an email, for example. |
Adding Metrics
The following dialog appears if you choose to Add Metric(s). Select from Common Metrics quick-links or expand available metrics in the All Metrics list to choose specific metrics. In this case, since we are already viewing Memory Utilization for our device, we want to choose to also see the device’s availability to determine if there was any downtime during the displayed time period, as shown in the following screen:
The metrics selector is context-aware. If you have selected a device object, only device metrics will be shown.
Thresholds on Metric Graphs
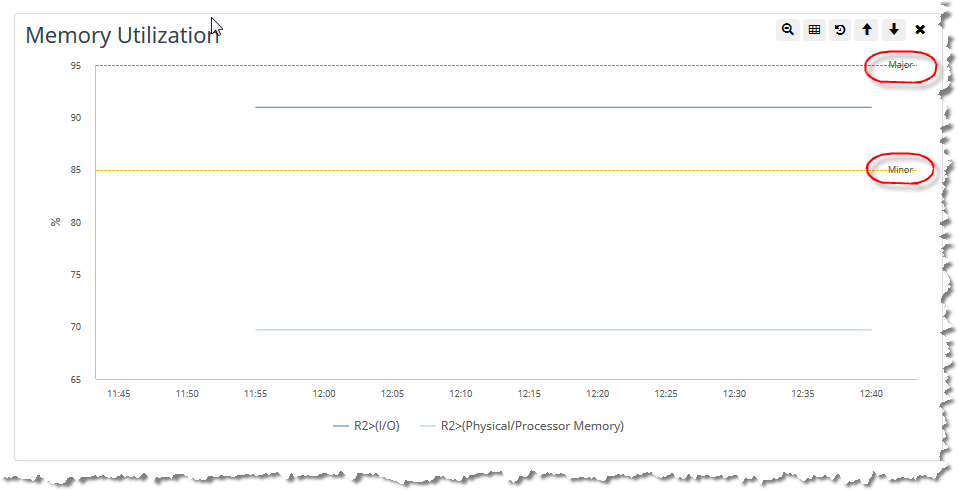
To aid in troubleshooting and problem identification, default thresholds that are defined for health calculations are superimposed on metric graphs in the At a Glance tab and Metrics Page, as shown in the following screen:



 and
and  buttons, as shown in the following screens:
