Monitoring Polling and Collection Status
This section discusses the Poller Status and the Collection Status pages, and consists of the following topics:
The
System Event Dashboard also reports on actions taken by the poller during initialization and refresh of the polling schedule and during polling. Fore more information, see
Using the System Event Dashboard.
The Poller Status Page
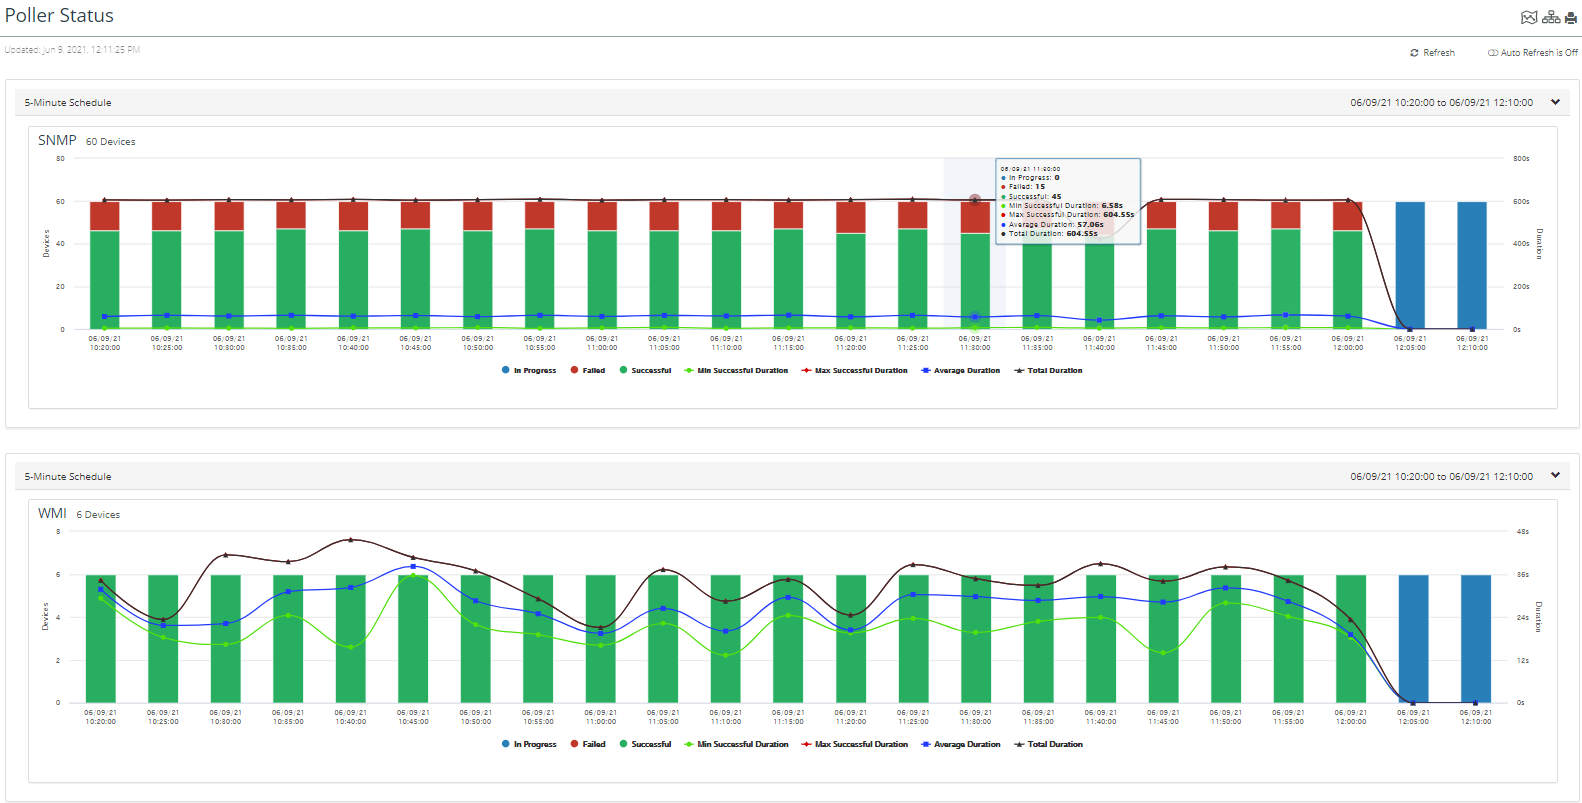
The Poller Status page provides the most recent 90 minutes of SNMP and WMI polling history in terms of polling duration and number of successfully polled devices, number of failed devices, and number of in progress devices. It provides at a glance status, with mouse-over information and drill downs.
This section discusses the following topics:
Accessing the Poller Status Page
To access the Poller Status page navigate to CONFIGURE->All Settings-Administer->Poller Status.
The following screen appears:
The Poller Status page initializes when processes start and shows polling results from that time forward. When you stop and restart processes, this display reinitializes.
Working with the Poller Status Page
The Poller Status page is designed to provide easy access to all relevant status on polling.
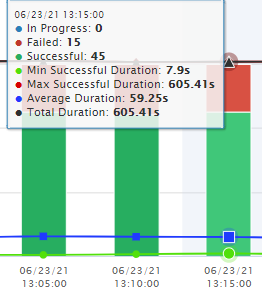
In addition to viewing at a glance the 90 minute polling colored-coded histograms in a trend line, you can mouse-over a histogram of interest, to display a tool-tip which contains summary information for that polling cycle, as shown in the following screen.
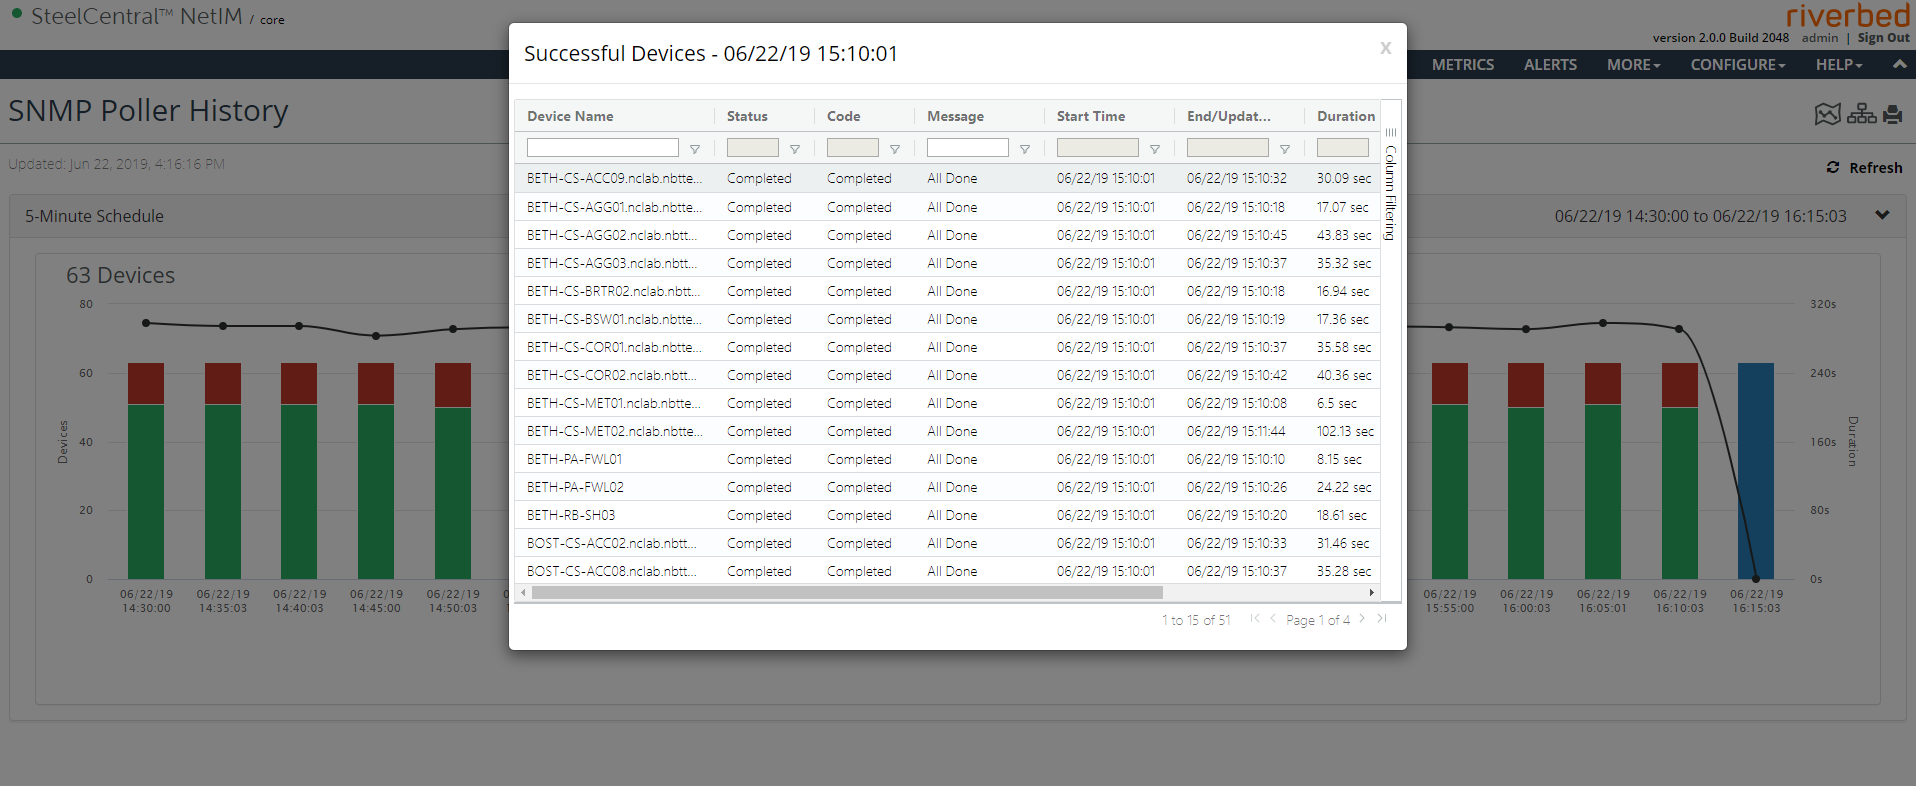
You can then drill down for more detailed status, by clicking on the color-coded status sections of the histogram for individual device polling details for the specific polling cycle. Similar to Device Manager, each column supports searching and filtering. Additionally, you can choose which columns you want to view by using the Column Filtering expander on the right side, as shown in the following screen
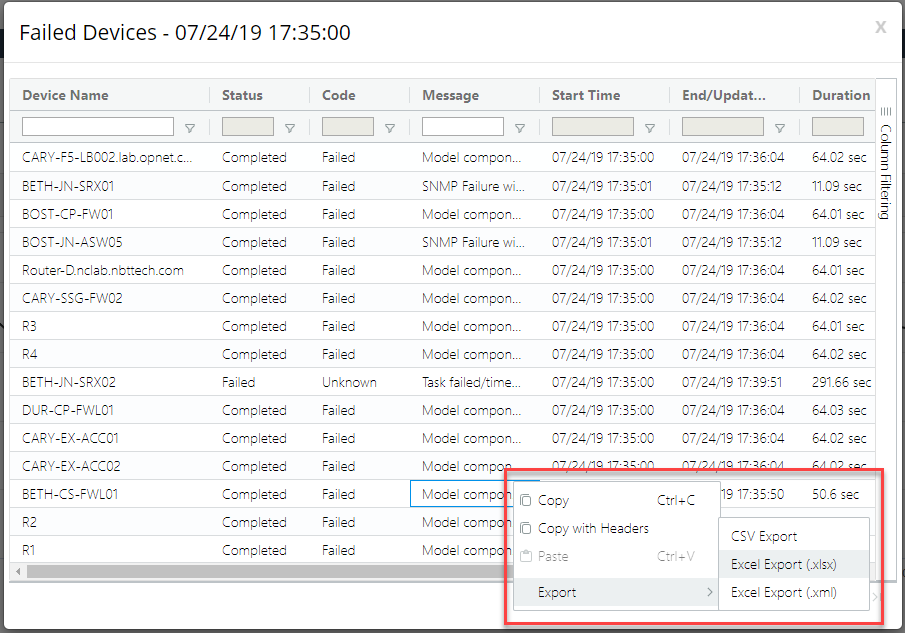
You can also copy-and-paste the table contents or export the contents of the table to CSV or Excel format by right-clicking in the table, as shown in the following screen:
The
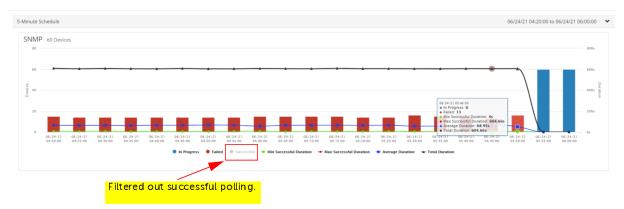
Poller Status page also supports filtering the histograms by clicking on or more items in the footer

to remove them from the display. The following screen shows successful polling removed from the display:
The Poller Status histogram colors are:
• Green—Polling is generally proceeding without issue.
• Yellow—Polling is proceeding with some cause for concern.
Indicates one or more of the following
– All devices failed to respond to the SNMP query
– A device was removed during that polling cycle because it reached its node polling failure tolerance
– A device was removed during a previously completed polling cycle. An LED is yellow due to a device removal, it will remain yellow (to notify you that one or more devices have been removed from that polling schedule) until you fix the issue, make the unreachable device(s) inactive, or the device(s) become reachable using SNMP.
• Red—Indicates that the poller is over provisioned and requires reconfiguration.
• Blue — Indicates in progress.
Devices are being skipped during polling because the poller cannot finish polling before it is time to start the next polling cycle for that time interval. See
“Poller Actions During Polling“ to learn more.
A green LED does not imply that all devices responded to the request during that polling cycle or that all responding devices provided a complete response. Transient device unresponsiveness is expected. Persistent issues will result in the device being removed from polling, and the LED will turn yellow.
Poller Actions During Initialization/Refresh
During initialization and refresh, the poller creates polling schedules or adds devices to an existing polling schedule. When this occurs devices can be:
• Dropped from polling—A device is dropped from polling if
– the device does not support any of the metric classes in its assigned polling profile
– NetIM does not contain the MIB data (that is, sysObjectID, ifIndex, and so on.) needed to poll that device. This can occur if the device is not reachable using SNMP or if the MIB data has aged out of NetIM.
• Skipped during initialization—Indicates the poller is over provisioned.
When the poller initializes or refreshes, it checks to determine if NetIM has sufficient memory before it adds devices to polling. When NetIM does not have sufficient memory to support additional polling, it skips the remaining devices. When this occurs, do one or more of the following:
– Reduce the number of devices/interfaces being polled
– Reduce the number of metric classes being collected by modifying one or more polling profiles
– Increase the amount of physical memory in the NetIM core.
“Contact Technical Support" for assistance in configuring the software to make use of additional memory.
Poller Actions During Polling
During polling, devices can be:
• Removed from polling— A device is removed from polling when it fails to respond to N consecutive polling requests, where N is the node polling failure tolerance specified in the polling profile.
– The default node polling failure tolerance is 5.
– When a device is removed from polling, it is removed for all intervals. For example, let’s assume that the polling profile for router A has 1 minute and 10 minute polling intervals and the default node polling failure tolerance of 5. If router A fails to respond to 5 consecutive polling attempts during 1 minute polling it is removed from polling at the fifth failed attempt and it is removed from both 1 minute and 10 minute polling.
• Skipped during polling—Indicates the poller is overprovisioned.
A device is skipped during polling when the polling time for a cycle expires before the poller starts to poll the device. This means that polling for the time interval cannot complete before the next cycle begins. Essentially, the poller is configured to conduct polling that it cannot finish in the specified time interval for the number of devices/interfaces and metric classes. When this occurs, do one or more of the following:
– Increase the polling interval
– Reduce the number of devices/interfaces being polled
– Reduce the number of metric classes being collected by modifying one or more polling profiles
– Move NetIM to a VM with a faster processor
Related Topics
The Collection Status Page
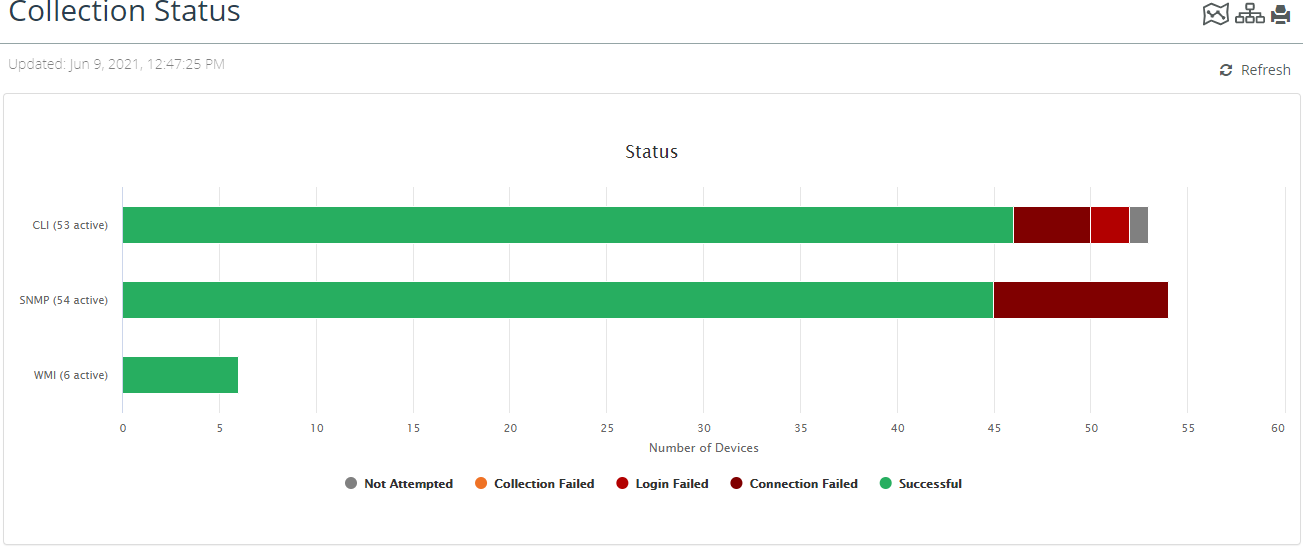
The Collection Status page provides a bar chart view of the CLI, SNMP and WMI collection status across all of your devices. The Collection Status page supports launching to the Device Manager where you can review and filter the collection status across all of your devices.
This section consists of the following topics:
Accessing the Collection Status Page
To access the Collection Status page, navigate to CONFIGURE->All Settings-Administer->Collection Status.
The following screen appears:
Working with the Collection Status Page
The Collection Status page indicates the highest-level indicator of the success or failure of NetIM‘s most recent efforts to perform Direct Collection, which shows the status of NetIM’s efforts to perform Direct Collection by means of CLI, SNMP, and WMI.
Each horizontal bar is subdivided into segments that represent the number of devices that share the same status.
The following status is tracked:
• Not Attempted
• Collection Failed
• Login Failed
• Connection Failed
• Successful
There are three ways to navigate the Collection Status bar:
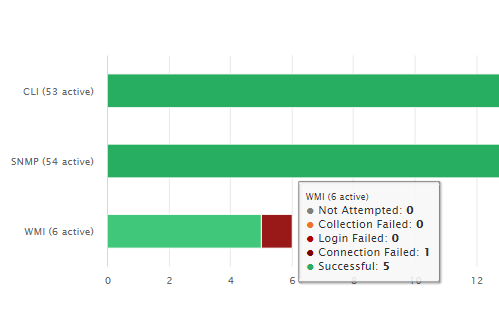
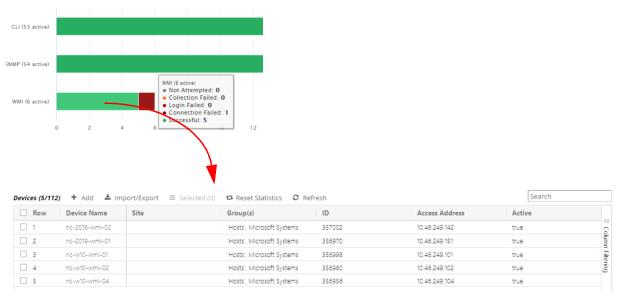
• Place the mouse pointer over a bar segment to display an overall status tool-tip as shown in the following screen:
• Click a bar segment. This action will take you directly to a Filter in the Device Manager that represents the set of devices that comprise the given status, as shown in the following screens:
You can then review status in the Device Manager, or click on a Device Name of interest to go to the device page.
• The
Collection Status page also supports filtering the status bar by clicking on or more items in the footer

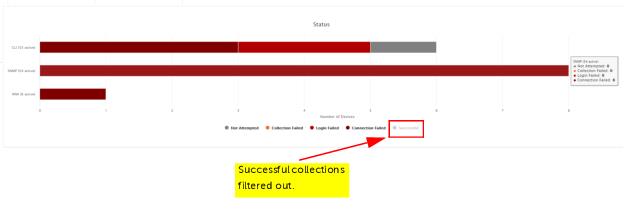
to remove them from the display. The following screen shows successful collections removed from the display:
Related Links

 to remove them from the display. The following screen shows successful polling removed from the display:
 to remove them from the display. The following screen shows successful collections removed from the display: