Monitoring and Troubleshooting Direct Collection
Direct Collection is the gathering of configuration data from network devices for the purpose of building a network model (as opposed to the purpose of gathering performance metrics). NetIM performs direct collection by means of the following:
• The Command Line Interface (CLI) of network devices. NetIM connects to devices by Telnet, SSHv1, or SSHv2.
• The Simple Network Management Protocol (SNMP). NetIM uses SNMP to access device configuration data that may be stored in devices’ Management Information Bases (MIBs).
• The Windows Management Instrumentation (WMI) service of Windows hosts.
As NetIM attempts to build a network model through Direct Collection of device configurations, it stores statistics on the success and failure of those attempts. Those statistics, plus per-device settings in the Device Manager, make it possible to troubleshoot Direct Collection on a per-device basis.
Both SNMP and WMI are also used to gather performance metrics, but SNMP and WMI activities for the purpose of gathering performance metrics do not affect the Direct Collection statistics described in this chapter.
This section includes the following topics:
Monitoring Direct Collection from the Device Manager
This section explains monitoring the direct collection of device data using the Device Manager, which you access by navigating to CONFGIURE->Device Manager, and consists of the following topics:
Monitoring Collection Status from the Device Table
In the Device Manager you can determine the SNMP and WMI collection status by doing the following:
Perusing the Columns of the Device Table
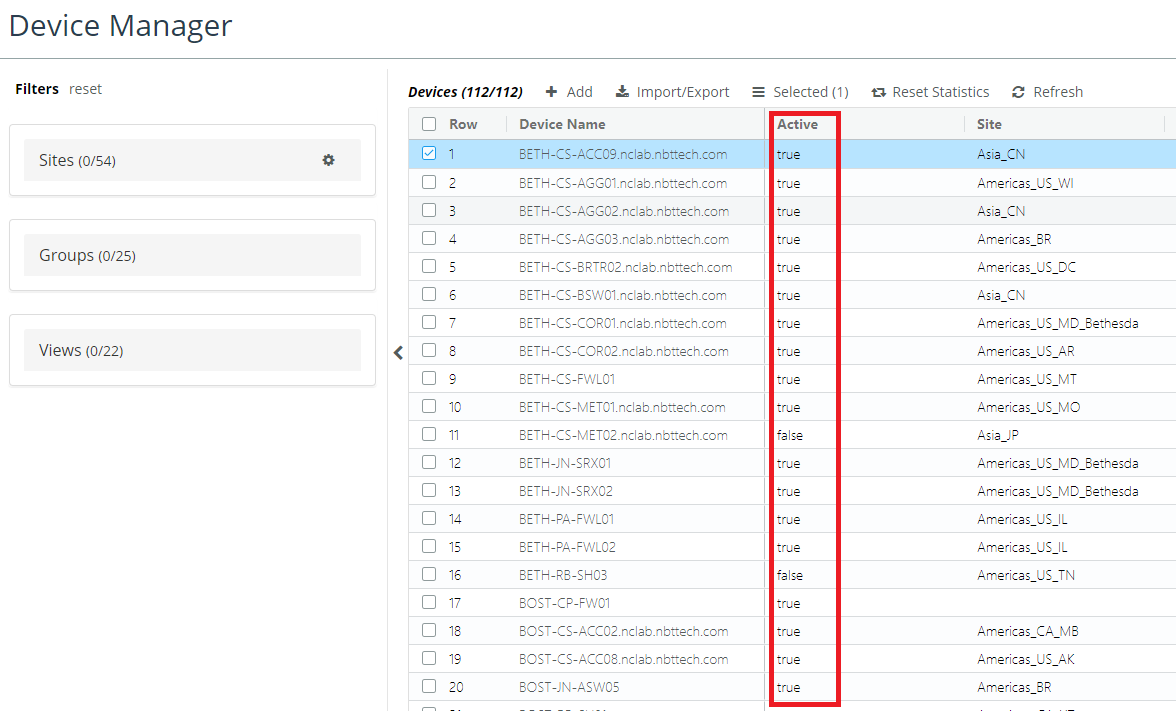
You can determine device status by scrolling through the column headings in the Device Table. For example, to see if a device is active, you can check the Active column the Device Table, as shown in the following screen:
View SNMP Collection Status Columns
To view the SNMP collection status for a device, review the relevant columns in the Device Table listed in the following table:
SNMP Columns of Interest in the Device Manager | Description | |
Active | (Check, or blank) This must be set for CLI Collection to occur. | |
Device Name | Unique name of this device in the Device Manager; the same as System Name unless you change it. | |
Latest SNMP Status | (Green Check, Red X, or Gray Question Mark)
If Red, at least one of CLI Connection, CLI Login, and CLI Commands must be Red.
If Gray, the next three must be Gray. | |
Last SNMP Collection | Date/time of last collection | |
View WMI Collection Status Columns
To view the WMI collection status for a device, review the relevant columns in the Device Table listed in the following table:
WMI Columns of Interest in the Device Manager | Description | View Collection History |
Active | (Check, or blank) This must be set for WMI Collection to occur. | |
Device Name | Unique name of this device in the Device Manager; the same as System Name unless you change it. | Allows click-through to the device page. |
WMI User Name | Displays the WMI user name | |
WMI Password | Displays asterisk for the password | |
WMI Domain | Displays the WMI domain name | |
Using the Views Filter
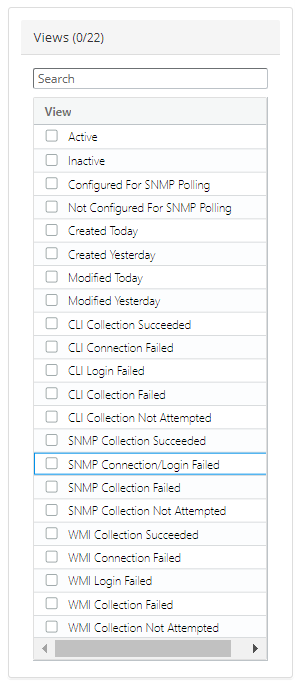
The Views filter, located in the left-most frame of the Device Manager, is a powerful tool that supports quick monitoring and troubleshooting by vectoring into the Device Table with the following filter options:
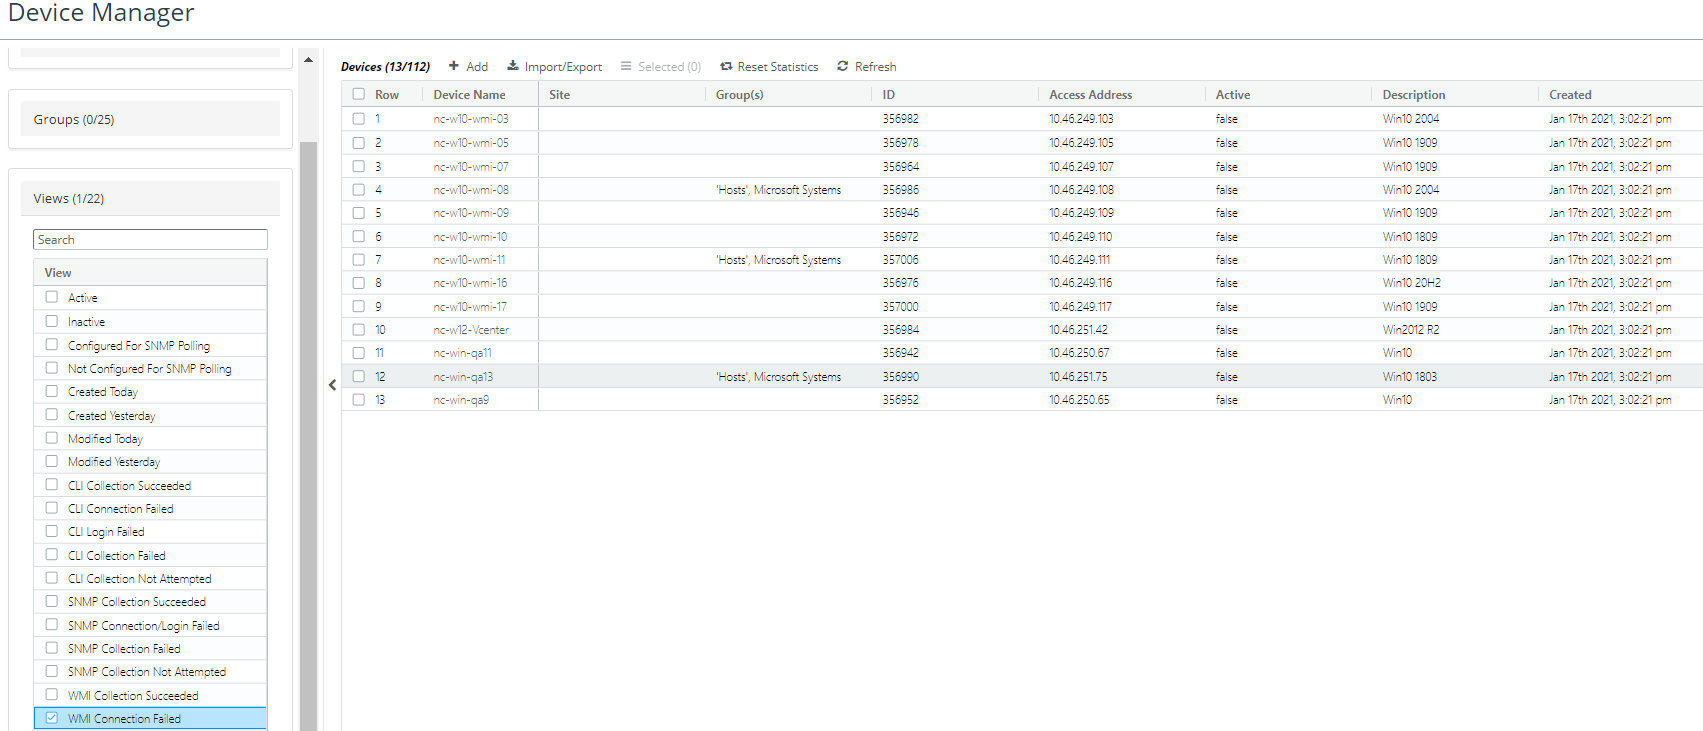
If, for example, you wanted to see if any WMI devices failed collection, you would click that box in the View menu and only those WMI devices that failed collection would appear in the Device Table, as shown in the following screen:
You can then drill-down to the device page by clicking on the
Device Name, as well as check the entire WMI collection history as explained in
“Viewing CLI, SNMP, and WMI Collection History" or continue to filter WMI views for additional troubleshooting information.
Viewing CLI, SNMP, and WMI Collection History
For detailed CLI, SNMP, or WMI collection history, do the following:
1. Select a device from the Device Table.
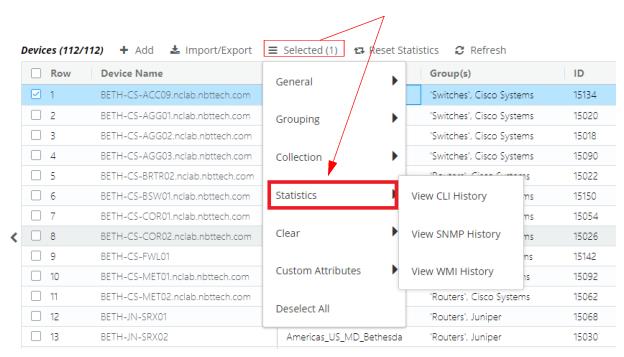
2. From the hamburger menu (

) at the top of the page, select
Statistics. You are presented with three choices, as shown in the following screen:
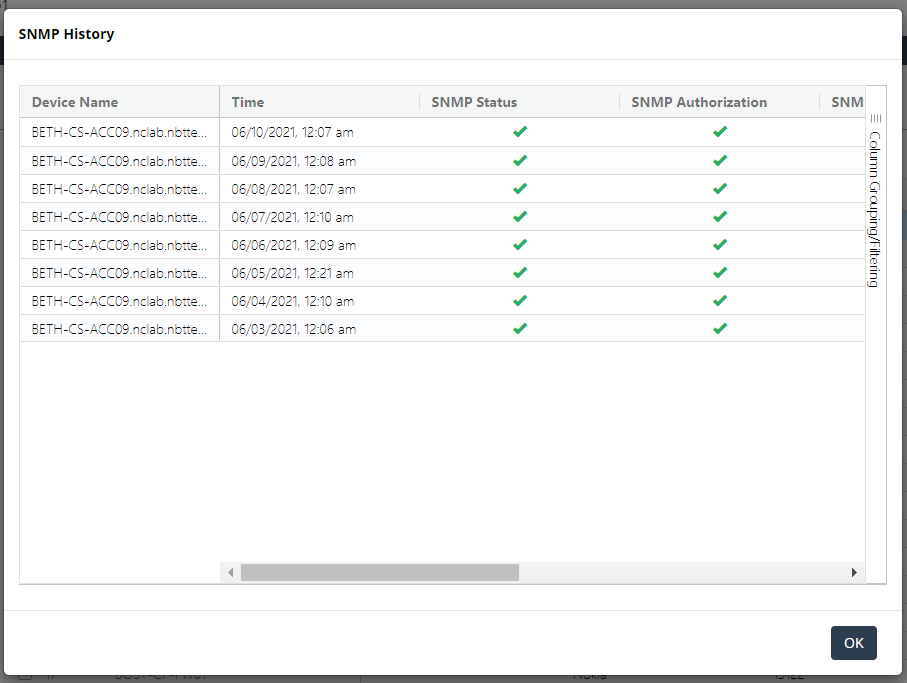
3. Select the history you want to review, and a screen like the following for appears (which shows SNMP history):
From the history screen you can scroll through the various entries for the selected device to review the collection history, as shown in the following tables:
SNMP Collection History |
SNMP Status | (Green Check, Red X, or Gray Question Mark)
If Red, at least one of CLI Connection, CLI Login, and CLI Commands must be Red.
If Gray, the next three must be Gray. | |
SNMP Authorization | (Green Check, Red X, or Gray Question Mark)
Whether SNMP authentication was successful.
If Red, the next one must be Red.
If Gray, the next one must be Gray. | |
SNMP Collection | (Green Check, Red X, or Gray Question Mark)
Whether the device’s MIBs were successfully queried by SNMP. | |
Tables Collected/Expected | Expressed as integers, for example 39/62 | |
OIDs Received/Sent | Expressed as integers, for example 4713/288 | |
Duration | How long the last collection lasted. | |
WMI Collection History. |
Latest WMI Time | (a date and time if attempted, or Gray Question Mark if not attempted)
If Gray, Latest SNMP Status must be Gray. | |
Latest WMI Status | (Green Check, Red X, or Gray Question Mark)
If Red, at least one of CLI Connection, CLI Login, and CLI Commands must be Red.
If Gray, the next three must be Gray. | |
WMI Connection | (Green Check, Red X, or Gray Question Mark)
Whether a connection was established to the device’s WMI. If Red, the next two must be Gray. | |
Login | (Green Check, Red X, or Gray Question Mark) | |
WMI Classes | (Green Check, Red X, or Gray Question Mark)
Whether the device’s WMI Classes were successfully. | |
Namespaces Successful/Expected | Expressed as integers, for example 4/4 | |
Classes Successful/Empty/Expected | Expressed as integers, for example 5/0/5 | |
Duration | How long the last collection lasted. | |
Monitoring Direct Collection on the System Event Dashboard
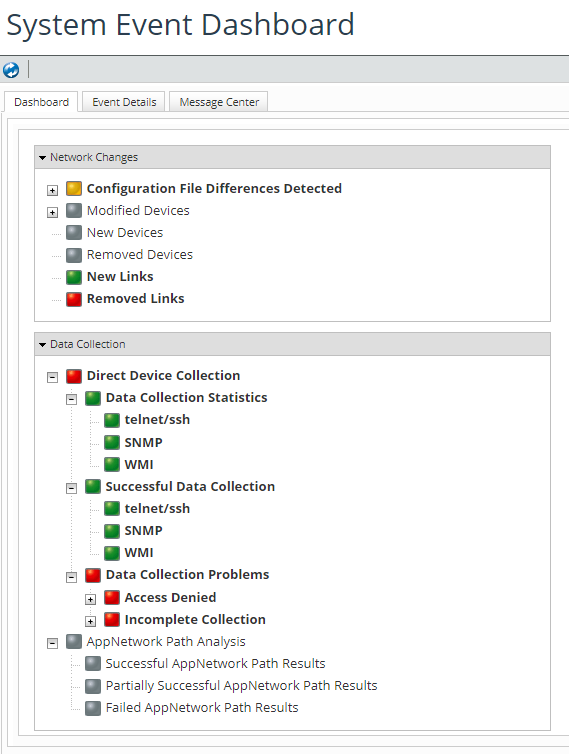
The System Event Dashboard, which you can access from CONFIGURE->All Settings->Administer->System Event Dashboard, presents a log of the adapters and schedule chains that ran in order to perform Direct Collection of device data, as shown in the following screen:
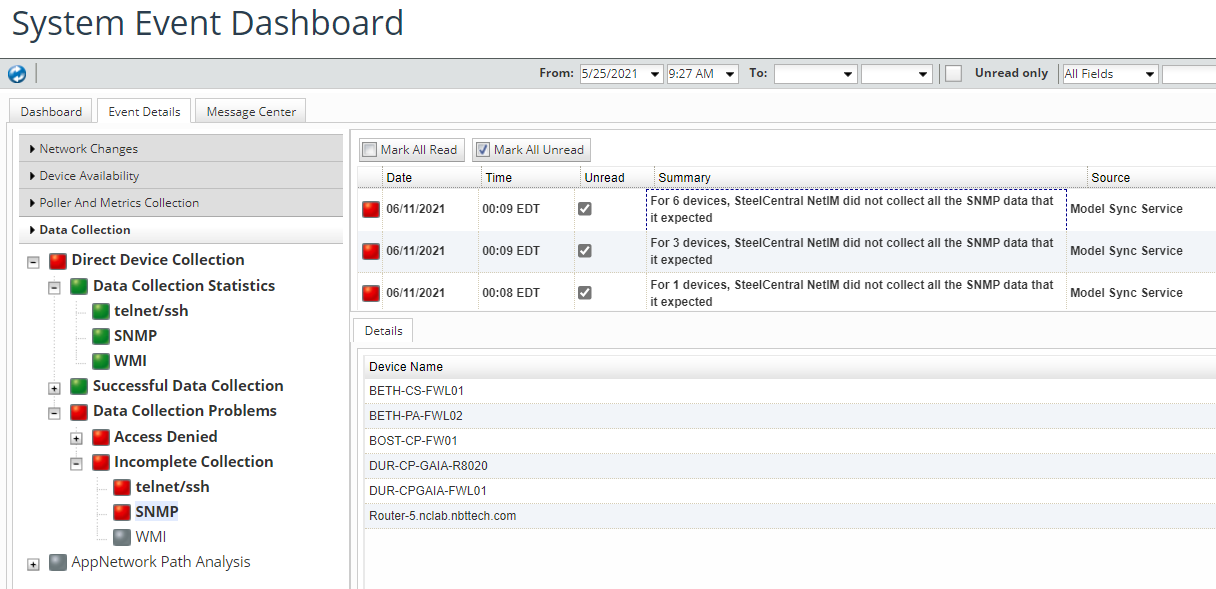
Drill down by clicking the boxes, as shown in the following screen which shows SNMP devices that had incomplete collection:
For more information on the
System Event Dashboard, see
Using the System Event Dashboard.
Monitoring Collection Status on the Collection Status Page
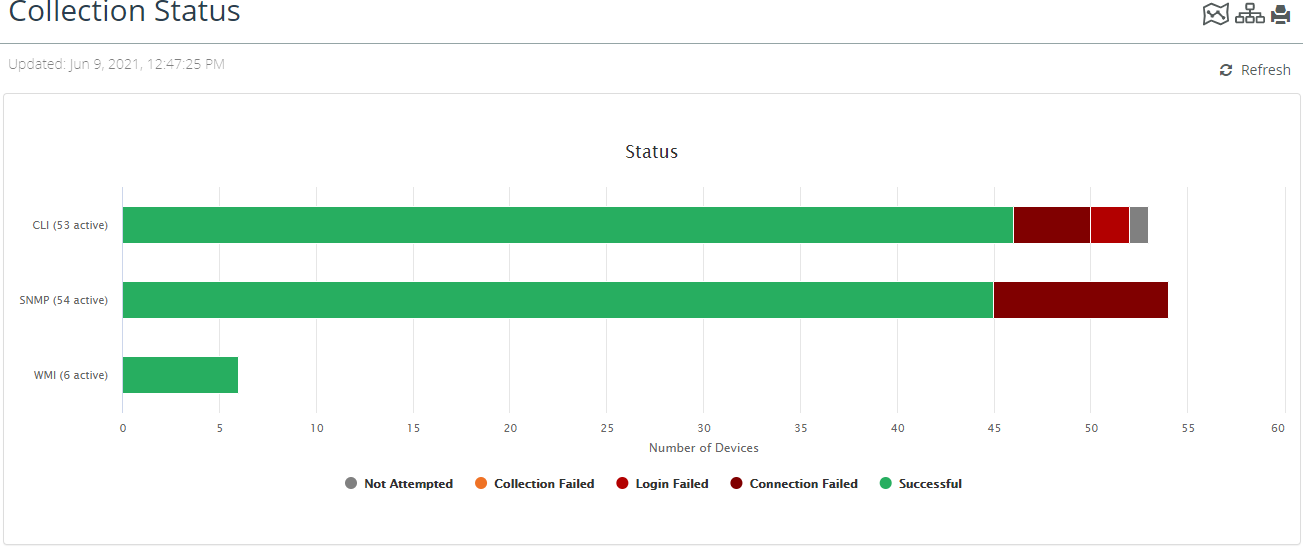
The Collection Status page, which you can access from CONFIGURE->All Settings->Administer->Collection Status, provides a high-level graphic overview of collection status, as shown in the following screen:
The
Collection Status page also supports click throughs to the
Device Manager displaying a list of appropriately filtered devices automatically selected from the View frame. For more information on the View filtering display, see
Using the Views Filter.
For more information on using the
Collection Status page, see
The Collection Status Page.
Troubleshooting Direct Collection Problems
If you discover problems with direct collection, you can attempt to remedy them before contacting Technical Support.
A best practice for troubleshooting collection problems is to start on the high-level Collection Status page and then drill down to the Device Manager.
This section discusses the following troubleshooting actions you can take to resolve problems with direct collection:
Reset Connection Statistics
In the Device Manager, you can reset connection statistics for selected devices. After connection statistics are reset, every SNMPand WMIstatus and history for every device changes to unknown (a gray question mark), and remains unknown until collection is run again (according to the defined schedule).
When you reset collection statistics, all historical direct connection statistics in the database are removed. The Device Manager will show unknown status for all devices until collection is run again (either initiated manually or by a schedule chain running with an appropriate adapter).
To reset connection statistics, follow these steps:
1. Login to the UI as a user with administrative privilege.
2. Navigate to CONFIGURE->Device Manager.
The following screen appears:
3. Select one or more devices of interest from the Device Table.
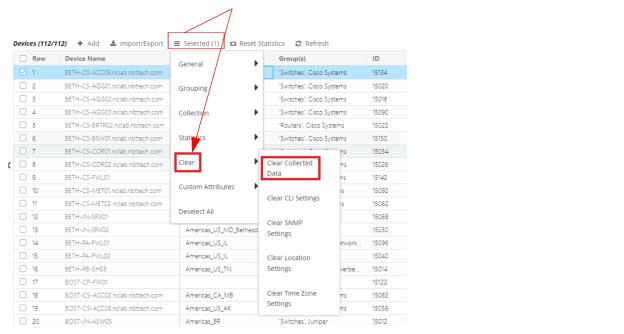
4. Click on the Hamburger menu (

) at the top of the page, and select
Clear. The following screen appears:
5. Select Clear Collected Data. You are prompted with a warning.
This operation cannot be undone.
6. Click OK to delete all device statistics.
Autoconfigure Devices
To autoconfigure a device is to automatically clear and re-populate its SNMP and WMI settings in the Device Manager. Assuming NetIM has network access to the device, it queries the Global Credentials List for one of several potentially correct login credentials, accesses and attempts to log in to the device, and repeats the process until a login is found to be successful. When login is finally successful, NetIM then ascertains additional settings for the device.
The technique of repeated attempts might be detected by a network security mechanism, which could result in the device locking out a particular username or blocking communication from NetIM’s IP address entirely.
To initiate automatic configuration of one or more devices, follow these steps:
1. Login to the UI as a user with administrative privilege.
2. Navigate to CONFIGURE->Device Manager.
The following screen appears:
3. Select one or more devices of interest from the Device Table.
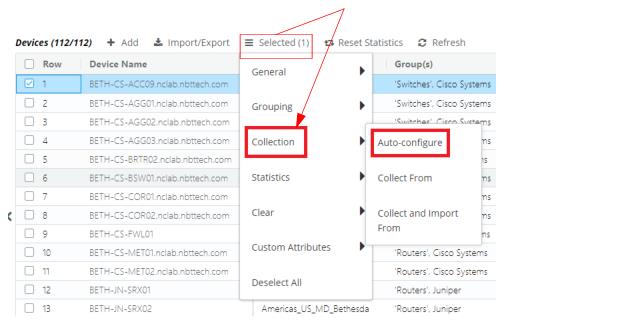
4. Click on the Hamburger menu (

) at the top of the page, and select
Collection. The following screen appears:
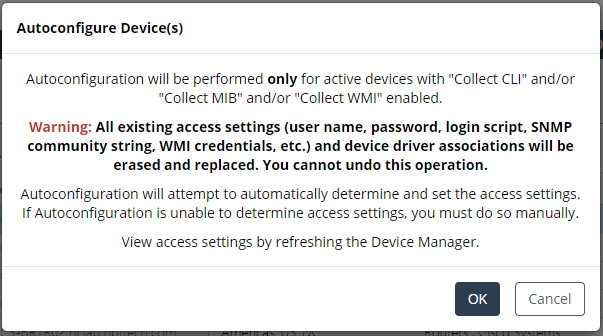
5. Select Auto-configure. The following warning screen appears:
6. Click the OK button to run auto-config on the selected device or devices.
After Autoconfiguring devices, wait until the model is refreshed automatically.
Troubleshoot SNMP Collection
The SNMP Collection Status listings in the following tables match the columns in the device table of the
Device Manager filtered by the
Views menu, as explained in
“Using the Views Filter". Use the listings to troubleshoot problems with SNMP collection.
SNMP Collection Status | Description | Next Steps |
SNMP Collection Succeeded | NetIM connected, was authenticated, and queried the device’s MIBs by means of SNMP. | no action |
SNMP Collection Not Attempted | SteelCentral NetIM did not attempt collection. | |
SNMP Connection/Login Failed | NetIM could not establish a connection to the device, or could not log in, so Collection was not even attempted. | |
SNMP Collection Failed | NetIM connected and logged in to the device, but OIDs were not successfully queried. | |
Troubleshooting ‘SNMP Collection Not Attempted’
Possibility | Where to Look | Resolution | Follow-up |
The device’s Active flag was not set, so NetIM does not interact with it. | Device Manager-> Active column | Set it in the Device-> Hamburger Menu-> General -> Edit checkbox in the appropriate tabs. | wait until the model is refreshed automatically (by tomorrow). |
The device’s SNMP checkbox was not set, so NetIM does not attempt to perform Direct Collection by means of SNMP. | View/Edit Device-> Hamburger Menu-> General -> Edit -> SNMP checkbox | Set it. | wait until the model is refreshed automatically (by tomorrow). |
The v1/v2 Read Community String or v3 settings are missing. | Check CONFIGURE-> All Settings -> Global Discovery Settings | Verify that the community string for this device exists in the credentials list, then
“Autoconfigure Devices"(s). | wait until the model is refreshed automatically (by tomorrow). |
View/Edit Device-> Hamburger Menu-> General -> Edit -> SNMP. Community strings always appear as “****”, so you won’t know if a string is incorrect or missing just by looking on the SNMP tab. | Supply credentials by hand on this tab, or
“Autoconfigure Devices". | wait until the model is refreshed automatically (by tomorrow). |
Troubleshooting ‘SNMP Connection/Login Failed’
Before using this table, be certain that connection was attempted.
Possibility | Where to Look | Resolution | Follow-up |
SNMP v1/v2 or v3 settings are incorrect. | View/Edit Device-> Hamburger Menu-> General -> Edit -> SNMP. Community strings always appear as “****”, so you won’t know if a string is incorrect or missing just by looking on the SNMP tab. | Re-type the community strings onto the SNMP tab if you know them. | wait until the model is refreshed automatically (by tomorrow). |
Check CONFIGURE-> All Settings -> Global Discovery Settings and unhide the community strings, then verify that the correct community string appears in the set. Then
“Autoconfigure Devices". | sit until the model is refreshed automatically (by tomorrow). |
Device is not reachable through network. | Check firewalls and network health. Verify that device is up and listening for SNMP on port 161. Use Wireshark to verify that packets are returning from the device. | | |
Device is reachable through network, but you’re not sure whether SNMP agent is returning requested OIDs. | | Verify that the device’s sysName can be queried. | |
Troubleshooting ‘SNMP Collection Failed’
Before using this table, be certain that login was successful.
Possibility | Where to Look | Resolution | Follow-up |
NetIM encountered unexpected SNMP response. | See
“SNMP Troubleshooting Using the Built-In MIB Browser" and verify that the device’s sysName can be queried. | Set sysName on the device (which is required for correct operation of SNMP). | sit until the model is refreshed automatically (by tomorrow). |
SNMP Troubleshooting Using the Built-In MIB Browser
The following procedure describes the basic steps for accessing a device and checking its sysName.
1. To access any device’s SNMP agent, open a command prompt on NetIM core and run:
app.sh MIB_BROWSER
This is a UI-based utility. You must use X or an xrdp session.
2. In the MibBrowser’s Host and Community fields, enter the host name and read community string of the target host.
3. Press Enter and wait for the device’s MIB structure to load into the MibBrowser.
4. Navigate to and select the sysName variable in the MIB tree.
5. Click Get SNMP Variable in the toolbar.
6. See the result in the Display area. In this example, the sysName is NC-WIN-DVNES3.opnet.com.

 ) at the top of the page, select Statistics. You are presented with three choices, as shown in the following screen: