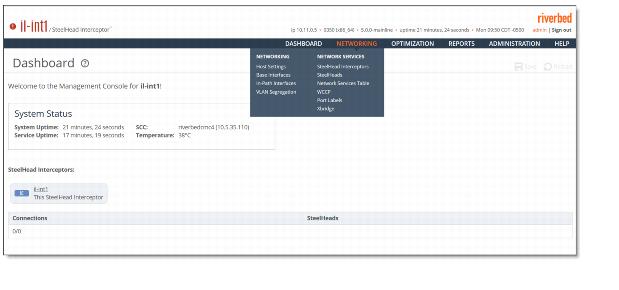
Figure: Dashboard (Standard Mode)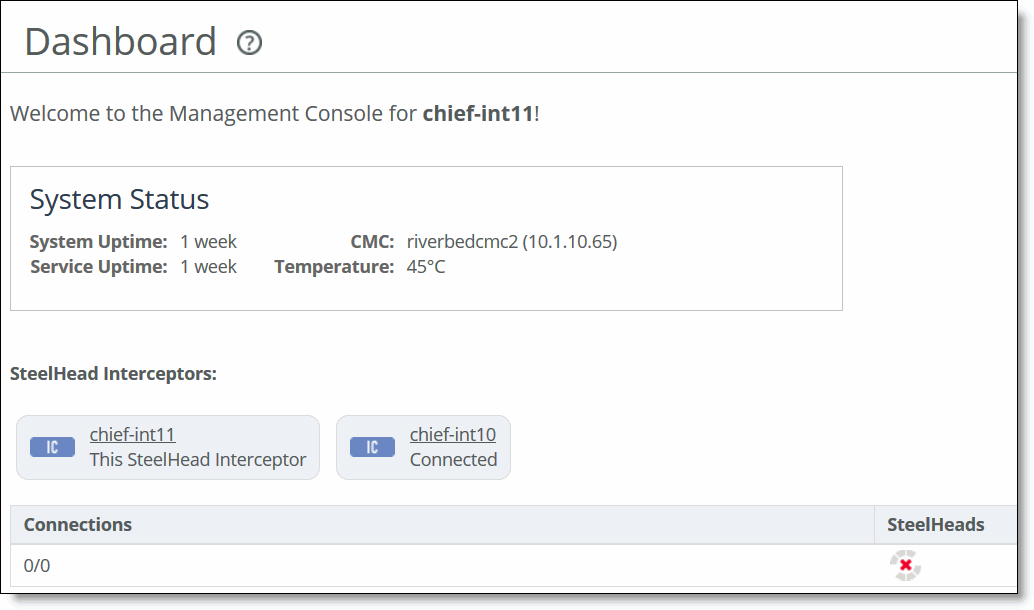
Field | Description |
System Status | Displays the current state of the system. |
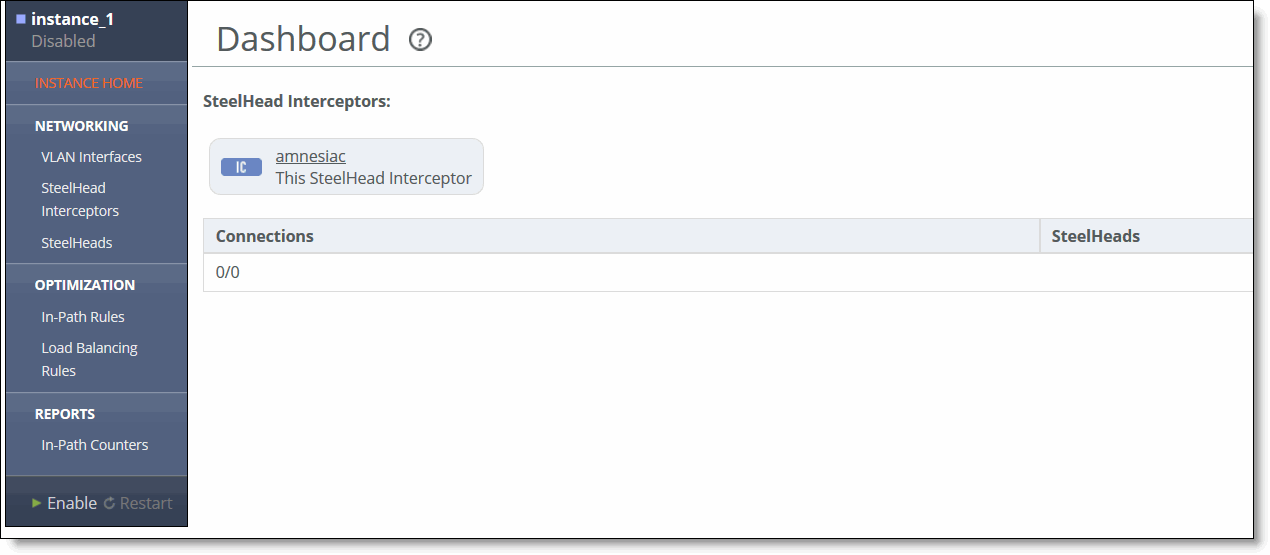
SteelHead Interceptors | Displays the current and other SteelHead Interceptors (if configured in the system). If another SteelHead Interceptor is configured as the failover SteelHead Interceptor to the SteelHead Interceptor that you are logged into, the failover relationship is displayed as a set of two arrows between the SteelHead Interceptors, pointing in opposite directions. Selecting the name of a SteelHead Interceptor displays the Networking > Network Services: SteelHead Interceptors page. The SteelHead Interceptors page displays details about that SteelHead Interceptor and allows you to configure the SteelHead Interceptor’s settings, such as its name and IP address, and whether it will be used as the failover SteelHead Interceptor. For more details, see Configuring Interceptor-to-Interceptor Communication. |
Connections | Displays the number of connections routed to the connected SteelHeads. |
SteelHeads | Displays the SteelHeads configured for the current SteelHead Interceptor. Selecting a SteelHead icon displays the Networking > Network Services: SteelHeads page. The SteelHeads page displays details about that SteelHead and allows you to configure some of the SteelHead settings, such as its name and IP address. For more details, see Configuring Interceptor-to-SteelHead Communication. |
Icon | Description |
Indicates a connected SteelHead. The eight segments show the percentage of connections. The pale segments in this icon indicate that there are very few or no connections running on the SteelHead. | |
Indicates a connected SteelHead. The dark green segments indicate that the SteelHead is running at about thirty percent of its capacity for connections. | |
Indicates a connected SteelHead. The dark green segments indicate that the SteelHead is running at about 87% of its capacity for connections. | |
Indicates that severe pressure is being triggered on the SteelHead. Pressure is associated with CPU and memory constraints, not the number of connections, so the red icon does not indicate that the maximum number of connections has been reached on the SteelHead. | |
Indicates that the SteelHead has not fully connected yet. This icon does not show connections or pressure. | |
Indicates that the SteelHead is not connected. This icon does not show connections or pressure. | |
Indicates that a connected SteelHead is in a paused state. This occurs only when you manually pause a SteelHead in the SteelHead page (Networking > Network Services: SteelHeads page). | |
Indicates that a connected SteelHead is resynchronizing, a transient state that is set by the Interceptor process. The arrow disappears when resynchronization is complete. | |
Indicates that the SteelHead is in a handshaking state while it connects to another device. | |
Indicates that the version of the connected SteelHead is not fully compatible with the Interceptor. |
Field | Description |
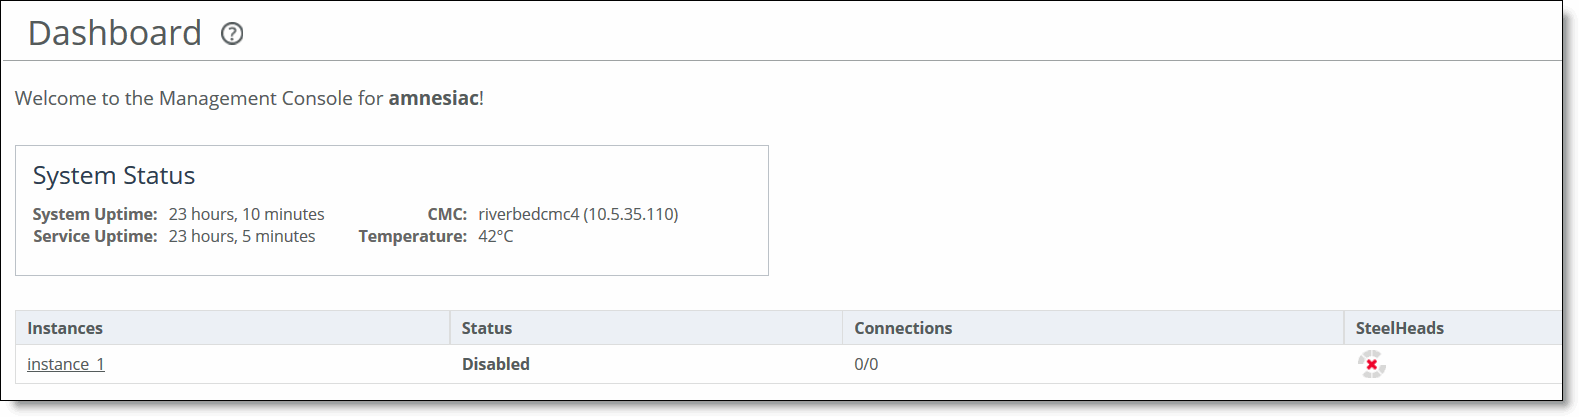
System Status | Displays the current state of the system. |
Instances | Displays the names of the instances. Selecting an instance name displays the instance dashboard. For more details about the instance dashboard, see Instance Dashboard in VLAN Segregation Mode. |
Status | Displays the state of the Interceptor service for the instance. • Enabled - Indicates that the instance is running. • Disabled - Indicates that the instance is stopped. • Enabled (Restart Required) - Indicates that changes have been made to the instance configuration settings, and a restart is required before the new configuration takes effect. Note: To restart an instance that is disabled or requires a restart, see Starting, Stopping, and Restarting the Service. |
Connections | Displays the ratio between the number of current connections and the maximum number of connections possible on the SteelHeads in the instance. |
SteelHeads | Displays an icon for each SteelHead in the instance. To go to the configuration page for that SteelHead, click the icon. |
Menu | Submenus |
Dashboard | Displays summary information about the appliances in the SteelHead Interceptor system. |
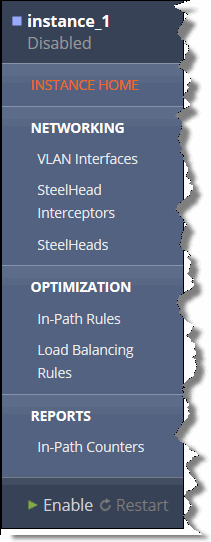
Networking | Networking - Configure host settings, base interfaces, in-path interfaces, and VLAN segregation. For details, see Modifying Host and Network Integration Settings. Note: When the SteelHead Interceptor is running in VLAN segregation mode, the controls for defining SteelHead Interceptors and SteelHeads appear in the instance configuration page, because these are instance-specific settings. For details, see Working with Instances |
Network Services - Configure path selection, Quality of Service (QoS) and Differentiated Services Code Point (DSCP) marking, and flow export collectors. For details, see Configuring Network Services. | |
Network Integration Features - Configure Web Cache Communication Protocol (WCCP), setting port labels, configuring communication between SteelHeads and Interceptors, and enabling Xbridge. For details, see Configuring Network Integration Features. | |
Optimization | Optimization - Configure traffic redirection, general service settings, in-path rules, load-balancing rules, fair peering, pressure monitoring, tracing rules, and hardware assist rules. For details, see Configuring Optimization Settings. |
Reports | Networking - Display interface counter statistics. For details, see Viewing the Interface Counters and In-Path Counters Reports. |
Diagnostics - Display and download Interceptor diagnostic reports such as user and system logs, alarms status, system snapshots, system dumps, TCP dumps, and user permissions. For details, see Viewing Diagnostic Reports and Logs. | |
Report Data - Export reports. For details, see Exporting Report Data. | |
Administration | Maintenance - Start and stop system services, schedule jobs, manage licenses, upgrade software, back up configurations, and reboot or shut down the appliance. For details, see Maintaining Your System. |
Security - Configure general security settings, user permissions, RADIUS, TACACS+, ACL and web settings. For details, see Configuring Security Settings. | |
System Settings - Configure announcements, alarms, date and time, SNMP settings, email settings, log settings, administrator password, and configuration files. For details, see Configuring System Settings. | |
Help | Displays online help, contact information for Riverbed Support, appliance details such as the model, revision type, serial number, and software version, and appliance MIB files. For details, see SteelHead Interceptor Management Information Base (MIB) |
Step | Reference |
1. Configure in-path rules. Order your list so that you pass through or deny traffic you do not want to optimize first; then list redirect rules for traffic you do want to optimize. | |
2. Configure Interceptor-to-SteelHead communication. | |
3. Configure Interceptor-to-Interceptor communication (if your deployment includes failover or support for clusters when parallel routes are taken). | |
4. Configure load-balancing rules. | |
5. Review and, if you choose, modify the SteelHead Interceptor default host and networking settings. | |
6. Configure SteelHead-to-Interceptor communication. | |
7. Verify connections among your network devices by viewing Interceptor Management Console reports. | |
8. Configure path selection for the SteelHead Interceptor cluster. |