11.8. Reports, Sections and Widgets
In the application framework, a report is a single web page that displays one or more widgets of data retrieved from one or more data sources associated with the installation.
11.8.1. Overview
The Web UI version of a report is comprised of:
Criteria
A set of form fields for the user to fill in that serve as inputs to the back-end when running the report. This includes selection fields, drop-down lists, text boxes that define the context for the report.
There standard criteria such as start/end times and traffic filter expressions. The report creator may also define custom criteria that is specific to this report or analysis functions required to generate.
Widgets
Charts and tables that display the data associated with the report. Each widget is independently rendered JavaScript. Typical widgets include time series charts, pie and bar charts, tables, and map widgets.
Under the covers, the report is built from multiple pieces defined in a single Python source file:
Widgets
A widget defines how a table’s data will be displayed in the web UI. Some widgets may have specific requirements about the structure of the data in the attached table. For example, time series widget require that one of the columns is a date/time column. Pie charts require at least one key column. Note that while each defined widget must be bound to a table, the reverse is not necessarily true as some tables may be defined that are inputs to other tables. In addition, it is possible to tie 2 or more widgets to the same table, providing different UI renderings of the same underlying data.
Sections
Widgets are grouped into sections. This division is currently solely for the purpose allowing for unique criteria per section.
Reports
The report is the highest level container for the UI rendering of all the sections and widgets in the report configuration source file. By default, all reports are listed in the “Reports” menu. In the Web UI, the report is displayed as a single page.
11.8.1.1. Sample Report Source File
Below is a sample report file:
from steelscript.appfwk.apps.report.models import Report
import steelscript.appfwk.apps.report.modules.yui3 as yui3

from steelscript.netprofiler.appfwk.datasources.netprofiler \
    import NetProfilerGroupbyTable, NetProfilerTimeSeriesTable
from steelscript.netshark.appfwk.datasources.netshark \
    import NetSharkTable

# Define the report and a single section
report = Report.create("Overall")
report.add_section('Main')

# Define a Overall TimeSeries showing Avg Bytes/s
table = NetProfilerTimeSeriesTable.create('timeseries')

table.add_column('time', label='Time', datatype='time', iskey=True)
table.add_column('avg_bytes', label='Avg Bytes/s', units='B/s')

report.add_widget(yui3.TimeSeriesWidget, table, "NetProfiler Overall Traffic")

# Define a table, group by location
table = NetProfilerGroupbyTable.create('locations', groupby='host_group')

table.add_column('group_name',    label='Group Name', iskey=True, datatype="string")
table.add_column('response_time', label='Resp Time',  units='ms', sortdesc=True)
table.add_column('network_rtt',   label='Net RTT',    units='ms')
table.add_column('server_delay',  label='Srv Delay',  units='ms')

# Adding a widget using the Report object will apply them
# to the last defined Section, here that will be 'Locations'
report.add_widget(yui3.TableWidget, table, "Locations by Avg Bytes", width=6)
This will get rendered as follows:
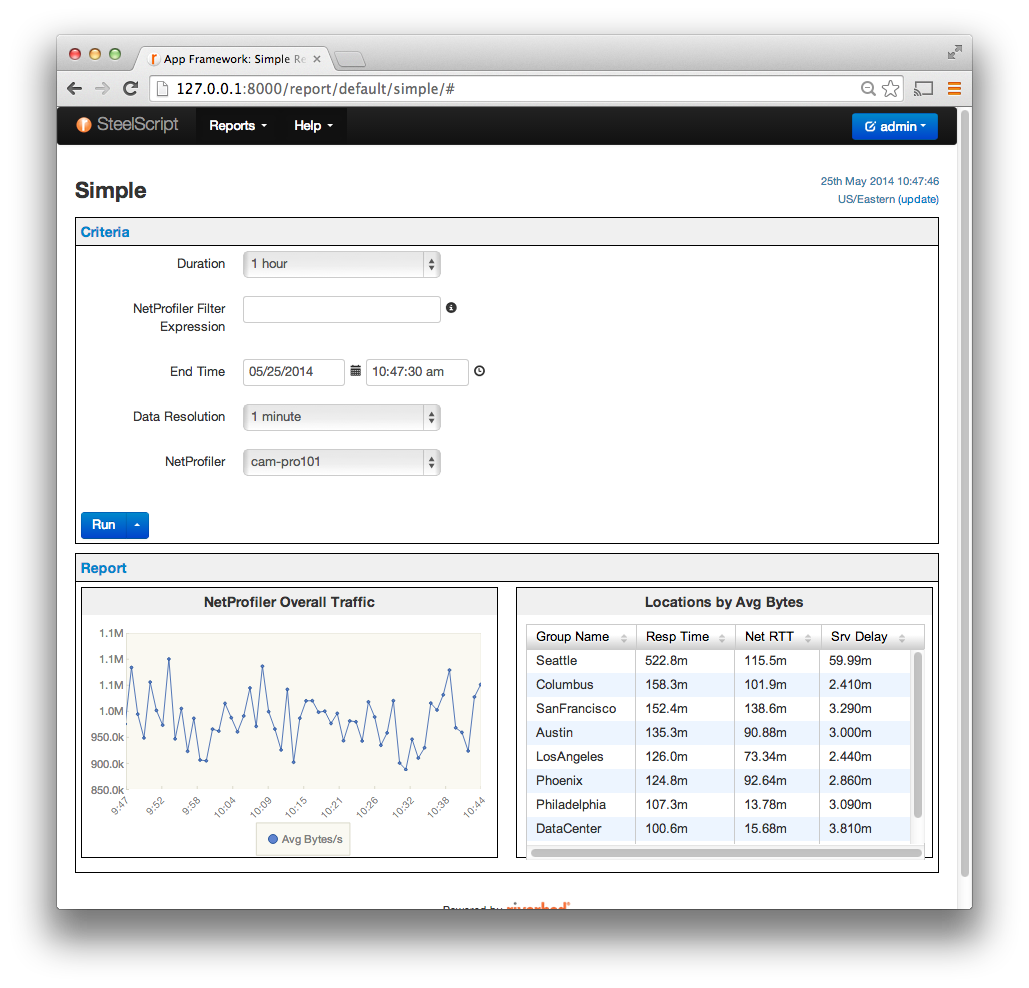
Notice that the criteria section has several fields for user input yet
the report source file does not declare any criteria. This is because
each data source table (NetProfilerTimeSeriesTable and
NetProfilerGroupbyTable) declares a set of criteria that it
requires in order to collect data for that report.
11.8.2. Creating a Report
Report objects are Django model instances and thus once a report object is instantiated and saved, the properties of the report are saved in the database.
Report objects are created via Report.create():
-
classmethod
Report.create(title, **kwargs)¶ Create a new Report object and save it to the database.
Parameters: - title (str) – Title for the report
- position (float) – Position in the menu for this report.
By default, all system reports have a
positionof 9 or greater. - field_order (list) – List declaring the order to display criteria fields. Any fields not list are displayed after all listed fields.
- hidden_fields (list) – List of criteria fields to hide from UI
- hide_criteria (bool) – Set to true to hide criteria and run on load
- reload_minutes (int) – If non-zero, report will be reloaded automatically at the given duration in minutes
- reload_offset (bool) – In seconds, the amount of time to consider
a reload interval to have passed. This avoids waiting until
half of the reload interval before turning over to next interval.
This also affects how the report gets reloaded in the browser,
if this offset value is smaller than the interval, it will be used
to delay the report reloads.
For example, given
reload_minutesof1andreload_offsetof10, the browser will reload all the widgets every minute at 10 seconds past the minute. - auto_run (bool) – Set to true to run report automatically. This will only run the report once, versus the reload options which setup continuous report reloads.
- static (bool) – Set to true to read data from WidgetDataCache. To populate WidgetDataCache for static reports, run the report by setting live=True in url.
11.8.2.1. Adding Sections to a Report
Section objects are Django model instances and backed by the database. All sections must be bound to a Report.
The preferred method for creating a section is to use
Report.add_section(). This ensures that the the section is
properly attached to the report.
-
Report.add_section(title=None, **kwargs)¶ Create a new section associated with this report.
Parameters: title (str) – Title for the section. Defaults to section<n>.See
Section.create()for a complete description and a list of validkwargs.
-
classmethod
Section.create(report, title='', position=None, section_keywords=None, default_field_mode=None, keyword_field_modes=None)¶ Create a Section of a report and define field modes.
Parameters: - report – the report this section applies to
- title (str) – section title to display
- position (float) – relative position for ordering on display, if None (default), this will be added as the last section of the current report
- default_field_mode – the default mode for how to
handle fields. If None (default),
INHERITwill be used - keyword_field_modes – dict of keyword to mode to
override the
default_field_mode. Each entry in this dict will result in a SectionFieldMode object
11.8.2.2. Adding Widgets to a Report
Widget objects are Django model instances and backed by the database. All widgets must be bound to a section.
The preferred method for creating widgets is to use
Section.add_widget() or
Report.add_widget().
-
Section.add_widget(cls, table, title, **kwargs)¶ Create a new widget associated with this section
Parameters: - cls – UI class that will be used to render this widget
- table – Table providing data for this widget
- title (str) – Display title for this widget
See the specific
cls.create()method for additional kwargs.
-
Report.add_widget(cls, table, title, **kwargs)¶ Create a new widget associated with the last section added.
Parameters: - cls – UI class that will be used to render this widget
- table – Table providing data for this widget
- title (str) – Display title for this widget
See the specific
cls.create()method for additional kwargs.
The cls parameter to the add_widget method is the class
reference for the specific UI. The following UI widget classes are
currently supported:
| UI Widget Class | Description |
|---|---|
| yui3.TableWidget | Table of rows and columns |
| yui3.ChartWidget | Generic YUI3 chart widget, base for Bar/Line |
| yui3.BarWidget | Vertical bar chart |
| yui3.LineWidget | Line chart, X-Axis is labels, Y-Axis is values |
| yui3.PieWidget | Pie Charts |
| yui3.TimeSeriesWidget | Line chart where X-Axis is time/date |
| maps.MapWidget | Overlay data on a map |
| raw.TableWidget | Unprocessed raw data display (testing/debug) |
11.8.2.3. yui3.TableWidget
-
classmethod
TableWidget.create(section, table, title, width=6, cols=None, rows=1000, height=300, stack_widget=False)¶ Create a widget displaying data in a two dimensional table.
Parameters: - width (int) – Width of the widget in columns (1-12, default 6)
- height (int) – Height of the widget in pixels (default 300)
- rows (int) – Number of rows to display (default 1000)
- cols (list) – List of columns by name to include. If None, the default, include all data columns.
- stack_widget (bool) – stack this widget below the previous one.
11.8.2.4. yui3.ChartWidget
-
classmethod
ChartWidget.create(section, table, title, width=6, rows=10, height=300, keycols=None, valuecols=None, charttype='line', dynamic=False, stack_widget=False)¶ Create a widget displaying data as a chart.
This class is typically not used directly, but via LineWidget or BarWidget subclasses
Parameters: - width (int) – Width of the widget in columns (1-12, default 6)
- height (int) – Height of the widget in pixels (default 300)
- rows (int) – Number of rows to display (default 10)
- keycols (list) – List of key column names to use for x-axis labels
- valuecols (list) – List of data columns to graph
- charttype (str) – Type of chart, defaults to ‘line’. This may be any YUI3 ‘type’
- dynamic (bool) – columns will be added later from criteria if True
- stack_widget (bool) – stack this widget below the previous one.
11.8.2.5. yui3.BarWidget
-
classmethod
BarWidget.create(*args, **kwargs)¶ Create a widget displaying data as a bar chart.
Parameters: - width (int) – Width of the widget in columns (1-12, default 6)
- height (int) – Height of the widget in pixels (default 300)
- rows (int) – Number of rows to display (default 10)
- keycols (list) – List of key column names to use for x-axis labels
- valuecols (list) – List of data columns to graph
- charttype (str) – Type of chart, defaults to ‘line’. This may be any YUI3 ‘type’
- stack_widget (bool) – stack this widget below the previous one.
11.8.2.6. yui3.LineWidget
-
classmethod
LineWidget.create(*args, **kwargs)¶ Create a widget displaying data as a line chart.
Parameters: - width (int) – Width of the widget in columns (1-12, default 6)
- height (int) – Height of the widget in pixels (default 300)
- rows (int) – Number of rows to display (default 10)
- keycols (list) – List of key column names to use for x-axis labels
- valuecols (list) – List of data columns to graph
- charttype (str) – Type of chart, defaults to ‘line’. This may be any YUI3 ‘type’
- stack_widget (bool) – stack this widget below the previous one.
11.8.2.7. yui3.PieWidget
-
classmethod
PieWidget.create(section, table, title, width=6, rows=10, height=300, stack_widget=False)¶ Create a widget displaying data in a pie chart.
Parameters: - width (int) – Width of the widget in columns (1-12, default 6)
- height (int) – Height of the widget in pixels (default 300)
- rows (int) – Number of rows to display (default 10)
- stack_widget (bool) – stack this widget below the previous one.
The labels are taken from the Table key column (the first key, if the table has multiple key columns defined). The pie widget values are taken from the sort column.
11.8.2.8. yui3.TimeSeriesWidget
-
classmethod
TimeSeriesWidget.create(section, table, title, width=6, height=300, stacked=False, cols=None, altaxis=None, bar=False, stack_widget=False)¶ Create a widget displaying time-series data in a line or bar chart
Parameters: - width (int) – Width of the widget in columns (1-12, default 6)
- height (int) – Height of the widget in pixels (default 300)
- stacked (bool) – If True, show multiple series as stacked
- cols (list) – List of columns by name to graph. If None, the default, graph all data columns.
- altaxis (list) – List of columns to graph using the alternate Y-axis
- bar (bool) – If True, show time series in a bar chart.
- stack_widget (bool) – stack this widget below the previous one.
As an example, the following will graph four columns of data:
section.add_widget(yui3.TimeSeriesWidget, 'Bytes and Packets',
                   stacked=True, width=12, height=450,
                   cols=['bytes', 'rtxbytes',
                         'packets', 'rtxpackets'],
                   altaxis=['packets', rtxpackets'])
The columns ‘bytes’ and ‘rtxbytes’ will be graphed against the left Y-axis, ‘packets’ and ‘rtxpackets’ on the right (alternate) Y-axis.
11.8.2.9. maps.MapWidget
-
classmethod
MapWidget.create(section, table, title, width=6, height=300, lat_col=None, long_col=None, val_col=None, label_col=None, url_col=None, min_bounds=None)¶ Create a widget displaying data overlayed on a map.
Parameters: - width (int) – Width of the widget in columns (1-12, default 6)
- height (int) – Height of the widget in pixels (default 300)
- lat_col, long_col (float) – are optional pairs of columns indicating the latitude and longitude values of data to plot. If these are omitted, the first column with the attribute ‘iskey’ will be used as the means for determining where to plot.
- val_col (str/col) – the data column to graph, defaults to the first non-key column found assigned to the table.
- label_col (str/col) – column to use for marker labels when when defining lat/long columns.
- url_col (str) – column to use for URL to redirect to when marker gets cliecked.
- min_bounds (tuple) – tuple of (lat, lng) points
representing the minimum extents that the map should
include. Useful to avoid the close zoomed-in effect when
two close-in points would be plotted. For example, to
have continental US always shown, the argument could be:
((33.184833, -116.999540), (45.561302, -67.956573))
Each column argument may be a Column object or the string name.
11.8.2.10. raw.TableWidget
-
classmethod
TableWidget.create(section, table, title, width=6, rows=1000, height=300)¶ Create a widget displaying data in a two dimensional table.
This is similar to
yui3.TableWidgetexcept the key and data values are minimally formatted to show raw data values. Usually only used for testing and debug.Parameters: - width (int) – Width of the widget in columns (1-12, default 6)
- height (int) – Height of the widget in pixels (default 300)
- rows (int) – Number of rows to display (default 10)