Viewing Reports and Logs
You display system reports and user and system logs to evaluate performance or troubleshoot, including:
• Networking reports
• Optimization reports
• Diagnostic reports
• Branch Services reports
• Report Data reports
• Rules Statistics reports
About the report format
This section describes the report format basics, before describing individual reports.
All of the time-series reports are clear, interactive, and easy to navigate. The statistics presented in this report format are readily accessible, and all updates to the report window appear in real time. This section describes the report format in detail.
Navigating the report layout
The time-series report format not only makes data easily accessible, but also enhances your ability to explore data in context. An example of a typical report appears in
Figure: A Time-Series report, with the key areas labeled. For details about individual reports, see the report description.
A Time-Series report
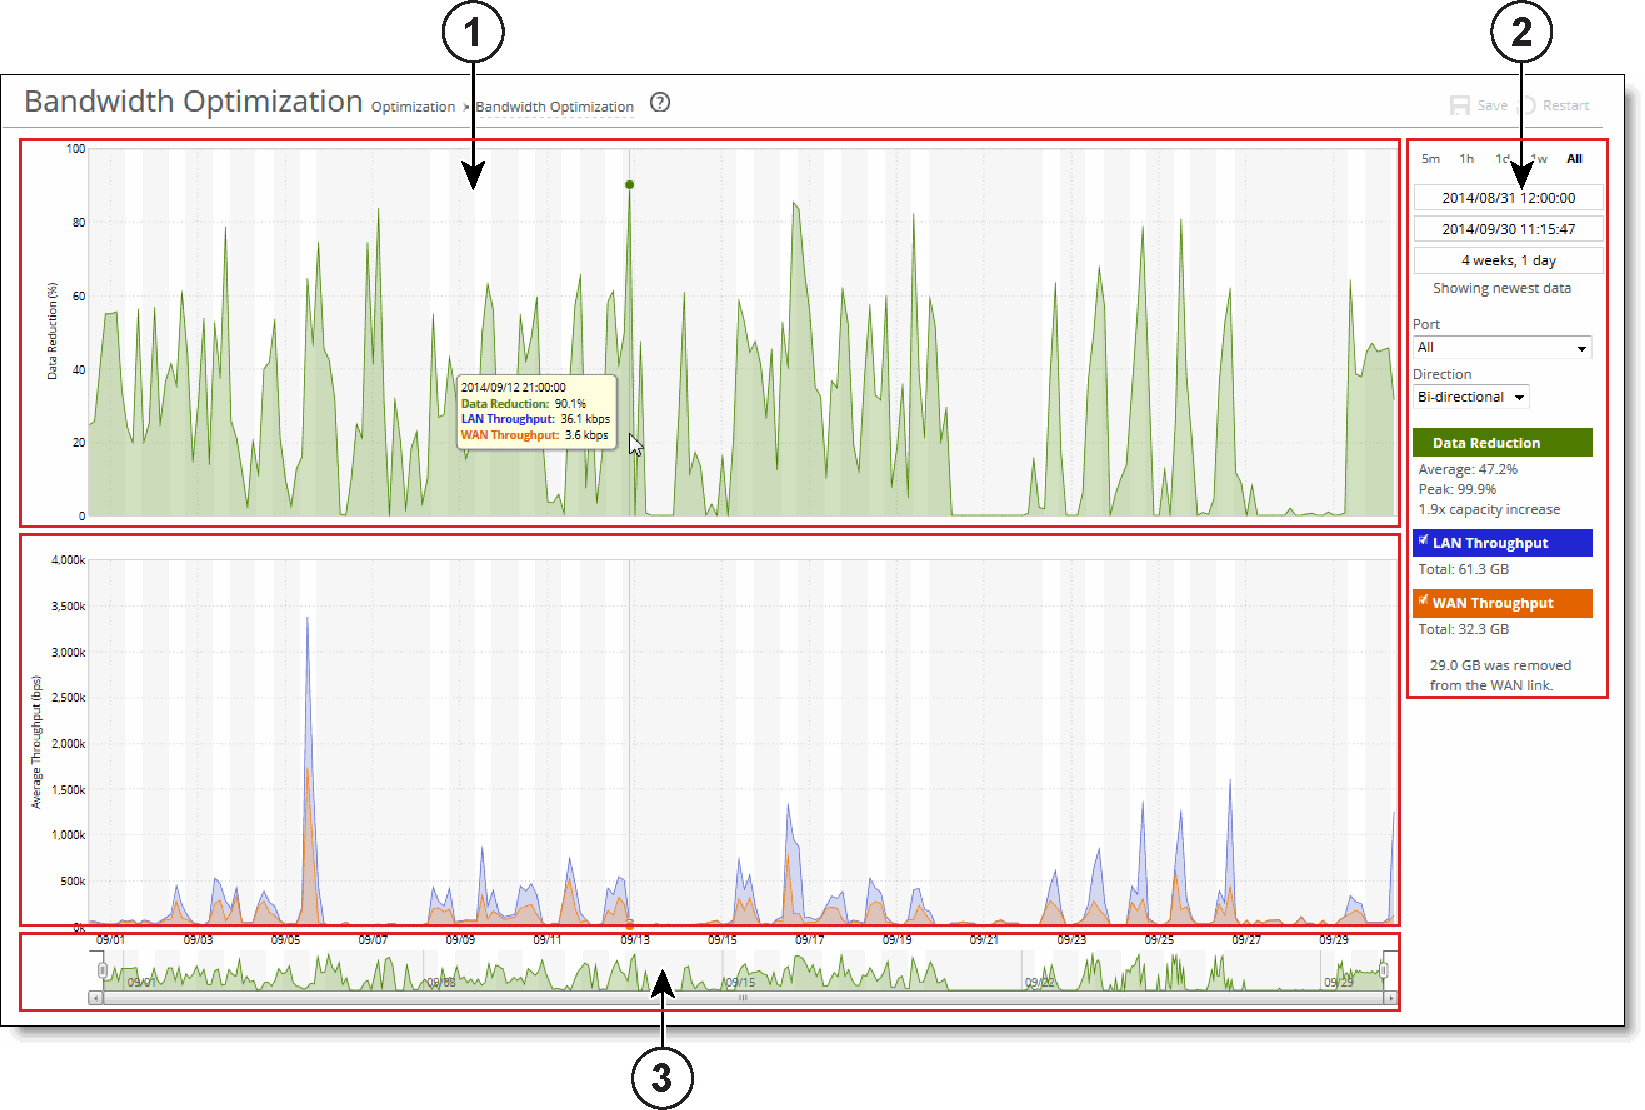
1 - Plot area
The plot area is where the data visualization occurs. Reports can display either a single-pane or dual-pane layout. In a dual-pane layout, both panes remain synchronized with respect to the x-axis. Each pane is capable of having two y-axes (a primary one on the left and a secondary one on the right).
The reports present the majority of data series as simple line series graphs, but some reports display area series graphs where appropriate. The types of area series graphs are:
• Layered series, which appear on top of each other in the z direction. These are identified by transparent colors.
• Stacked area series, which appear on top of each other in the y direction. RiOS uses stacked area graphs to depict an aggregate broken down into its constituent parts. In this type of graph, each series is a mutually exclusive partition of some aggregate data set, identified by opaque colors. A stacked series is appropriate when the sum of all the series is meaningful.
Mouse over a specific data point to see what the y values and exact time stamp are in relation to peaks.
To view the time stamp and value of each data series at that time, mouse over the plot area.
A tool tip displays the time stamp and the value of each data series at that time. The plot area colors the series names appropriately, and the data values have their associated units.
The plot area also displays subtle shading to denote work hours (white background) and nonwork hours (gray background). RiOS defines work hours as 8:00 AM to 5:00 PM (0800 to 1700) on weekdays. You can’t configure the work hours.
To zoom the plot area, mouse over the plot area, and then click and hold the left mouse button. Move the mouse left or right and release the left mouse button to zoom in.
2 - Control panel
Use the control panel to control how much data the chart displays, chart properties, and whether to view or hide the summary statistics.
To change the chart interval. Click a link: 5m (5 minutes), 1h (1 hour), 1d (1day), 1w (1 week), or All (all data). All data includes statistics for the last 30 days
If the current size of the chart window matches any of the links, that link appears in bold black text; the system ignores any clicks on that link. If the time duration represented by any of the links is greater than the total data range of the chart, those links are dimmed.
More window-related controls appear below the chart window interval links. These controls offer more precise control of the window and also display various window properties. From top to bottom:
• Text field containing the left edge (starting time) of the chart window.
• Text field containing the right edge (ending time) of the chart window.
• Text field containing the chart window interval. The chart window interval in this text field isn’t always exactly correct, but it is correct to two units (with the units being days, hours, minutes, and seconds). For example, if the chart window interval is exactly two days, three hours, four minutes, and five seconds, this text field displays 2 days, 3 hours.
• Link or static text that represents the chart window state of attachment to the end of the chart. When the chart window is attached, the report replaces the link with the static text Showing newest data. When the chart is showing newest data, you can see new data points as the system adds them automatically to the chart every 10 seconds. This automatic data point refresh can be powerful when you launch a new configuration and need to analyze its impact quickly. You can’t change the 10-second default.
When the chart window isn’t attached to the end of the chart, the report replaces the static text with a link that displays Showing newest data. Click this link to slide the chart window to the end of the chart range of data and attach the window.
All three text fields validate your input; if you enter text in an invalid format, an error message appears. If you enter valid text that is logically invalid (for example, an end time that comes before the current start time), an error message appears. With all three text fields, if the focus leaves the field (either because you click outside the field or press Tab), the chart window updates immediately with the new value. Pressing Enter while in one of these fields has the same effect.
Below the chart window controls is an optional section of custom, report-specific controls. The custom controls vary for each report. In
Figure: A Time-Series report, the Bandwidth Optimization report displays Port and Direction drop-down lists.
When you change the value of a custom control, the system sends a new request for data to the server. During this time, the control panel is unavailable and an updating message appears on the chart. When the report receives a response, the system replaces the chart, populates it with the new data, and makes the control panel available again.
The chart legend correlates the data series names with line colors and contains a few other features.
You can hide or show individual data series. When a white check box icon appears next to the data series name, you can hide the series from the plot area.
To hide individual series from the plot area, clear the check box next to the data series name.
To display individual series in the plot area, select the check box next to the data series name.
You can’t toggle the visibility of all series, because it doesn’t always make sense to hide a series (for example, if there’s only one data series in the chart). For these series, a white check box doesn’t appear next to the series name. In
Figure: A Time-Series report, you can hide the LAN Throughput and WAN Throughput series, but you can’t hide the Data Reduction series.
The legend also displays statistics. Each report defines any number of statistics for any of the data series in the chart. The system bases the statistics computation on the subset of each data series that is visible in the current chart window. The statistics display changes immediately if you change the chart window. The plot area reflects the changing chart window, as do the associated controls in the control panel.
The reports also support nonseries statistics (for example, composite statistics that incorporate the data from multiple data series); these statistics appear at the bottom of the legend, below all the series.
The three most popular statistics calculations are:
• Average—the average of all the data points
• Peak—the maximum of all the data points
• Total—the integral of the series (area under the curve). It is important to note that the total reported under each Throughput color in the chart legend displays the total amount of data transferred during the displayed time interval.
3 - Navigator
Directly above the scroll bar is the navigator, which shows a much smaller and simpler display of the data in the plot area. The navigator displays only one data series.
Use the navigator to navigate the entire range of chart data. The scroll bar at the bottom shows you which portion of the total data range is displayed in the plot area.
The navigator display can appear very different from the plot area display when an interesting or eye-catching series in the plot area isn’t the series in the navigator.
To resize the current chart window, move the handles on either side of the chart window in the navigator.
The charts have a minimum chart window size of five minutes, so if you resize the chart window to something smaller, the chart window springs back to the minimum size.
You can also click the data display portion of the navigator (not the scroll bar) and the chart window moves to wherever you clicked.
Setting user preferences
You can change report default settings to match your preferred style. When you customize any report-specific settings, the system immediately writes them to disk on the SteelHead. The system saves all of your custom settings, even after you log out, clear your browsing history, or close the browser. When you view the report again, your custom settings are intact.
The system saves the chart window. Whenever you change the chart window, the next time you view any report, the chart window is set to the last chart window used.
Viewing the Current Connection report
The Current Connections report displays the connections the SteelHead detects, including the connections that are passing through unoptimized.
You can search and customize the display using filters to list connections of interest. When you click Update, the report retrieves a listing of up to 500 real-time current connections. Navigating to the report or refreshing the page automatically updates the connections display.
The Current Connections report answers these questions:
• What traffic is the SteelHead optimizing?
• How many connections are established?
• What’s the data reduction on a per-connection basis?
• How many connections are closing?
• How many connections are being passed through either intentionally or unintentionally?
• How many connections are being forwarded by a connection-forwarding neighbor?
You view the Current Connections report under Reports > Networking: Current Connections.
Current Connections report
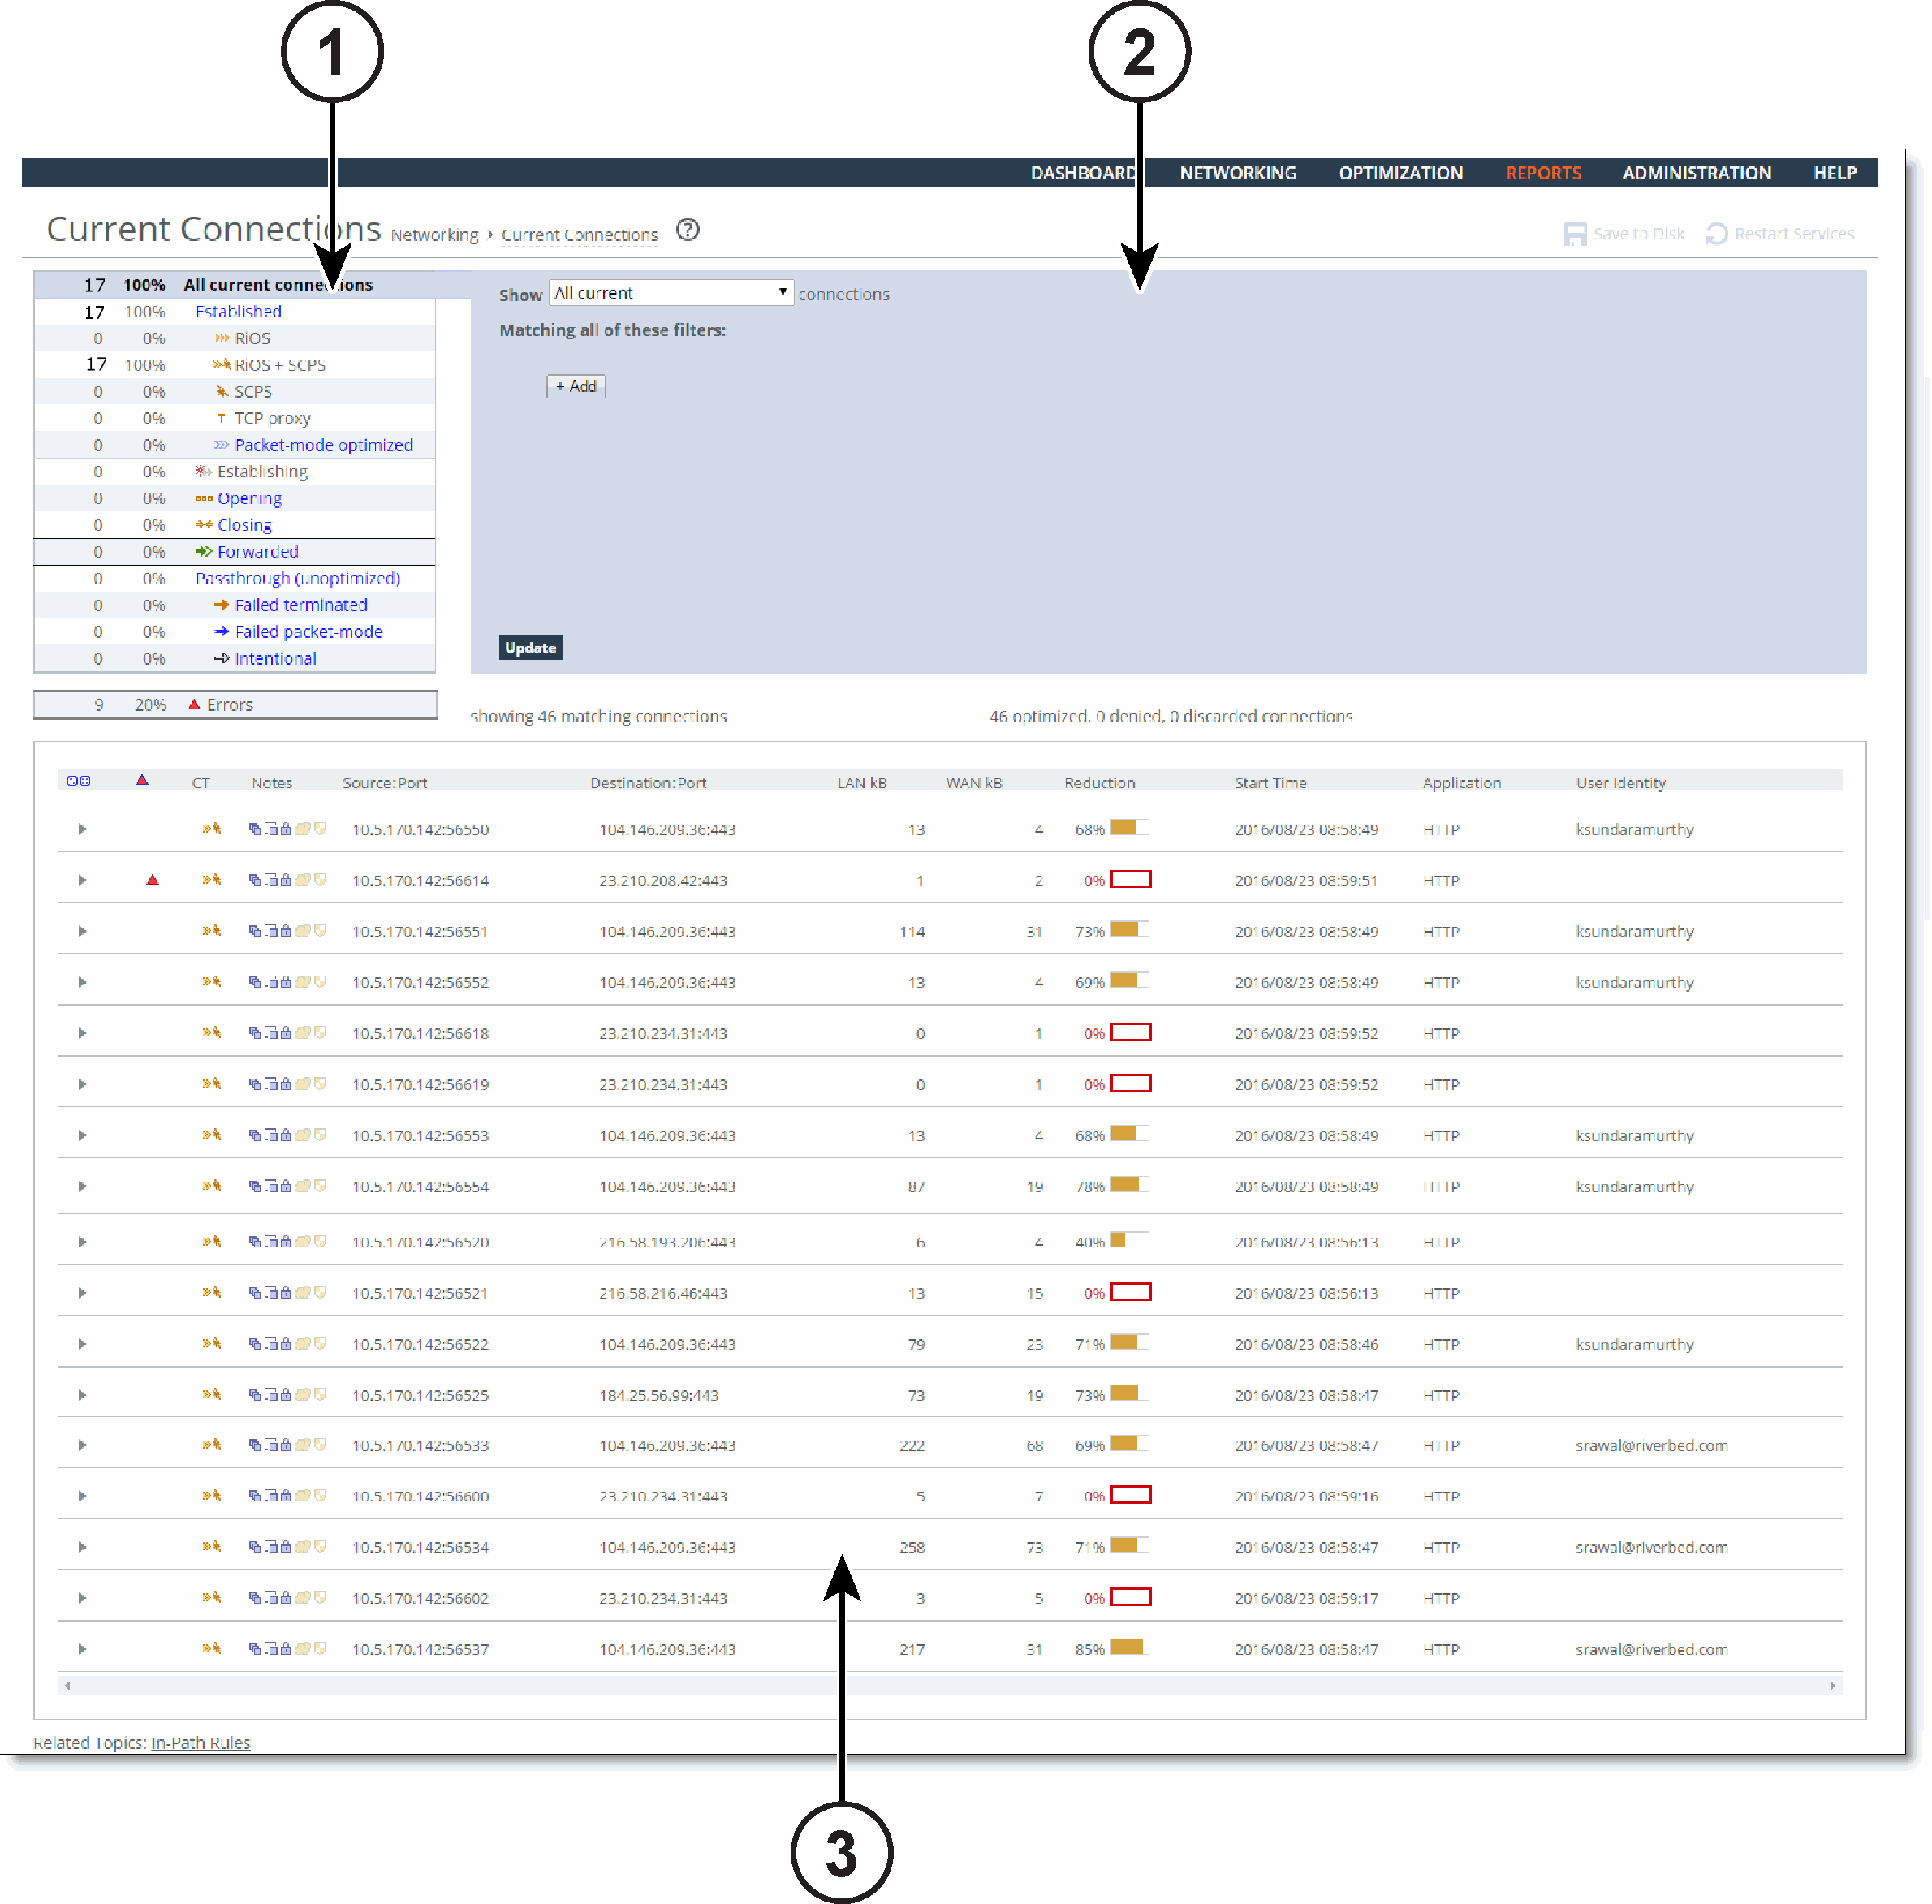
1 - Connections summary
The summary gives you an at-a-glance hierarchical overview of the traffic the SteelHead detects. It displays the total connection numbers for various types of optimization, pass-through, and forwarding. It categorizes the optimized, established connections by type and displays the portion of the total connections each connection type represents.
When you click a connection type such as established, you select it and also drive the show statement in the query area to search for established connections and exclude the other types.
The connections summary displays these connection types:
Connection type | Icon | Description |
|---|
All current connections | | Displays the total number of connections the SteelHead detects at the time you access the report, refresh the page, or click the Update button. It includes the connections that the SteelHead is passing through unoptimized, and connections that don’t appear in the connections table. |
Established | | Displays the total optimized, active connections. |
| | RiOS—Displays the double-ended, non-SCPS connections. |
| | TCP proxy—Displays the total non-SCPS single-ended interception connections. An SEI connection is established between a single SteelHead running RiOS 7.0 or later paired with a third-party device running TCP-PEP (Performance Enhancing Proxy). |
| | Packet-mode optimized—Displays the total flows that were optimized packet-by-packet with SDR bandwidth optimization. These include TCP and UDP flows over IPv4 or IPv6. Packet-mode flows are considered to be neither single-ended nor double-ended. In RiOS 8.5, you must enable packet-mode optimization to view optimized UDP flows. To enable packet-mode optimization, choose Optimization > Network Services: General Service Settings. In RiOS 8.5.x and later, you must enable path selection and packet-mode optimization to view optimized UDP flows. To enable path selection, choose Networking > Network Services: Path Selection. |
Establishing | | Displays the total newly forming, initiating connections. The connection is being established but doesn’t yet have an inner channel. Establishing connections count toward the connection count limit on the SteelHead because, at any time, they might become a fully opened connection. |
Opening | | Displays the total half-open active connections. A half-open connection is a TCP connection in which the connection has not been fully established. Half-open connections count toward the connection count limit on the SteelHead because, at any time, they might become a fully opened connection. If you are experiencing a large number of half-open connections, consider a more appropriately sized SteelHead. |
Closing | | Displays the total half-closed active connections. Half-closed connections are connections that the SteelHead has intercepted and optimized but are in the process of becoming disconnected. These connections count toward the connection count limit on the SteelHead. (Half-closed connections might remain if the client or server doesn’t close its connections cleanly.) If you are experiencing a large number of half-closed connections, consider a more appropriately sized SteelHead. |
Forwarded | | Displays the total number of connections that were forwarded when you have configured a connection-forwarding neighbor to manage the connection. |
Passthrough (unoptimized) | | Displays the total number of connections that were passed through unoptimized. You can view and sort these connections by intentional and unintentional pass-through in the connections table that follows this summary. |
| | Failed terminated—Displays the total number of terminated connections that were passed through unoptimized, because of reasons other than in-path rules. |
| | Failed packet-mode—Displays the total number of packet-mode flows that were passed through unoptimized, because of reasons other than in-path rules. In RiOS 8.5, you must enable packet-mode optimization to view UDP flows. To enable packet-mode optimization, choose Optimization > Network Services: General Service Settings. In RiOS 8.5.x and later, you must enable path selection or packet-mode optimization or both to view pass-through UDP flows. To enable path selection, choose Networking > Network Services: Path Selection. |
| | Intentional—Displays the total number of connections that were intentionally passed through unoptimized by in-path rules. |
Errors | | Displays all connections that have application or transport protocol errors as a portion of the total connections. |
2 - Query area
The connections summary and the connections table convey a lot of information about connections the SteelHead is detecting. The best way to narrow your search is to filter and sort the report. The query area is where you select a simple or compound connection type for your search and optionally filter the results. The Show search control defines the contents of the connection summary and the connections table.
The simple connection search uses a match against a connection type to display only that type, and excludes the others. If you want to use more advanced criteria, such as including all connections that were started after a certain date, you can add one or more filters to achieve this.
To display a simple connection type, select a connection type from the drop-down list after Show:
All current
Displays the total number of connections the SteelHead detects, including the connections that are passed through unoptimized. This selection removes any previous selections or filters.
Established
Displays the total optimized, active connections.
Packet-mode optimized
Displays the total connections that were optimized packet-by-packet with SDR bandwidth optimization. These connections include TCP IPv4, TCP IPv6, and UDP IPv4, and UDP IPv6 connections.
In RiOS 8.5, you must enable packet-mode optimization to view UDP flows. To enable packet-mode optimization, choose Optimization > Network Services: General Service Settings.
In RiOS 8.5.x and later, you must enable path selection and packet-mode optimization to view optimized UDP flows. To enable path selection, choose Networking > Network Services: Path Selection.
Opening
Displays the total half-open active connections. A half-open connection is a TCP connection in which the connection has not been fully established. Half-open connections count toward the connection count limit on the SteelHead because, at any time, they might become a fully opened connection.
If you are experiencing a large number of half-open connections, consider a more appropriately sized SteelHead.
Closing
Displays the total half-closed active connections. Half-closed connections are connections that the SteelHead has intercepted and optimized but are in the process of becoming disconnected. These connections are counted toward the connection count limit on the SteelHead. (Half-closed connections might remain if the client or server doesn’t close its connections cleanly.)
If you are experiencing a large number of half-closed connections, consider a more appropriately sized SteelHead.
Forwarded
Displays the total number of connections forwarded by the connection-forwarding neighbor managing the connection.
Passthrough (unoptimized)
Displays the total number of connections that were passed through unoptimized. You can view and sort these connections by intentional and unintentional pass-through in the individual connections table that follows the connections summary.
Failed terminated
Displays the total number of terminated connections that were passed through unoptimized.
Failed packet-mode
Displays the total number of packet-mode flows that were passed through unoptimized.
Intentional
Displays the total number of connections that were intentionally passed through unoptimized.
Click Update.
Filters provide a powerful way to drill down into large numbers of connections by specifying either simple or complex filter criteria. Each filter further restricts the display.
When you customize filters, the system immediately writes them to disk on the SteelHead. The system saves all of your custom settings even after you log out, clear your browsing history, or close the browser. When you view the report again, your custom settings are intact. The system saves report settings on a per-user basis.
To filter the display, click Add. Select a filter from the drop-down list. Selecting some filters expands the query with a text input field for additional information. For example, selecting for application from the drop-down list displays a text input field for the application name. RiOS validates the text input fields as you enter the text (except when you enter a regular expression).
You can select any combination of these filters:
• matching regular expression—Displays a text input field for a regular expression and shows only those connections that match the expression. You can filter based on connections for a specific path selection uplink name by entering the name in this filter.
Examples:
10.16.35.1
Finds one particular IP address
10.16.35.1:5001
Finds port 5001 on one particular IP address
• from source IP address/mask—Displays a text input field for the IP address and subnet mask. You can specify an IPv4 or an IPv6 IP address.
• from source port—Displays a text input field for the source port.
• to destination IP address/mask—Displays a text input field for the IP address and subnet mask. You can specify an IPv4 or an IPv6 IP address.
• to destination port—Displays a text input field for the destination port.
• that have errors—Displays connections with either application protocol errors or transport protocol errors.
• for application—Select an application name from the drop-down list. The application filter is only relevant for optimized connections.
• that were started before—Displays a text input field for the date and time. Use this format: yyyy/mm/dd hh:mm:ss
• that were started after—Displays a text input field for the date and time. Use this format: yyyy/mm/dd hh:mm:ss
• that are single-ended only—Displays SCPS and TCP proxy connections. Applies only to established connections.
• that are double-ended only—Displays RiOS and RiOS + SCPS connections. Applies only to established connections.
• for user—Displays a text field that accepts only a valid email ID as input, to filter on User Identity column values.
Starting with RiOS 9.7, this field reports User IDs for SMB encrypted, SMB signed, and MAPI over HTTP (MoH) connections that are optimized. The User IDs are propagated for any other traffic that uses the same IP address as the SMB or MoH traffic.
This field also displays for SteelHeads running RiOS 9.5 or later if you check the Enable SaaS User Identity (Office 365) check box in the Optimization > Protocols: HTTP Configuration page, and configure the SteelHead to support SaaS features. User IDs are also propagated for any traffic that uses the same IP address as Office 365 traffic.
To add another filter, click add filter again. You can add up to eight filters; they’re logically ANDed together and are all active at any given time. Continue adding filters until your query is complete.
Click Update.
To delete a filter, click the delete filter icon.
3 - Connections table
The connections table displays more information about each connection, filtered by the show statement and any filters in the query area. The connections table can show up to 500 connections at a time; it lists the total of all matching connections in the upper-right corner. From this table, you can view more details about each connection and perform operations on it. For example, you can reset connections or send a keepalive message to the outer remote machine for an optimized connection (the machine that is connected to the SteelHead).
For details about the query area, see
2 - Query area.
Connections with IPv6 addresses are split into two rows to accommodate the long address. The report encloses IPv6 addresses in square brackets, and the source address, destination address, and other information appear in different columns.
Icons in the CT and Notes columns indicate the connection type and attributes. Mouse over an icon and reveal a tooltip identifying its meaning.
The individual connections table displays additional information about each connection. Because this report can list hundreds of transient connections, you can sort the table by column heading (except for the Notes column). For example, you can sort the connections by source IP address.
To sort the table by row, click the table column heading. The table contents reload, if necessary. Click the heading again to reverse the order. A small up or down triangle reflects the current bidirectional sort order.
To reset the connection sample, click the dice icon on the far left.

The table contents reappear in the original display. For example, if you sort the display by a particular type, and there are more than 500 connections of that type, click the dice icon to return to the original display.
The connections table displays this information:
Column | Icon | Description |
|---|
| | Click this triangle to display the current connections details. See Viewing the current connection details. Because the details are a snapshot in time, by the time you click the connection, it could be gone or in a different state. If the connection is no longer available, a message tells you that the connection is closed. To refresh the display, click Update. |
| | Protocol Error—Displays a protocol error for both transport and application conditions. This list contains some of the conditions that trigger errors; it is a small subset of possible error conditions: • When the Optimize Connections with Security Signatures feature is enabled (which prevents SMB signing). This is an expected response. For details about preventing SMB signing, see About SMB signing. • If a problem occurs while optimizing encrypted MAPI traffic. For details about enabling optimization of encrypted MAPI traffic, see About MAPI. • If a problem occurs with SSL optimization or the secure inner channel. • If a SRDF protocol error occurs when attempting to optimize traffic originating from the LAN side of the SteelHead. Check the LAN-side Symmetrix array for compatibility. Click the connection for more details about the error. |
CT (Connection Type) | | Established—Indicates that the connection is established and active. |
| | Intentional Passthrough—Indicates that the connection was intentionally passed through unoptimized because of in-path rules. |
| | Failed terminated—Indicates that the connection was passed through unoptimized. |
| | Failed packet-mode—Indicates that the packet-mode flow was passed through unoptimized. |
| | Establishing—Indicates that the connection is initiating and isn’t yet fully established. The source and destination ports appear as n/a. |
| | Opening (Optimized)—Indicates that the connection is half-open and active. A half-open connection is a TCP connection that has not been fully established. |
| | Closing (Optimized)—Indicates that the connection is half-closed and active. A half-closed connection has been intercepted and optimized by the SteelHead but is in the process of becoming disconnected. |
| | Forwarded—Indicates that the connection is forwarded by the connection-forwarding neighbor managing the connection. |
Notes | | Displays connection icons that indicate the current state of the connection. The connection states can be one of these: |
| | Compression Enabled—Indicates that LZ compression is enabled. |
| | SDR Enabled—Indicates that SDR optimization is enabled. |
| | WAN Encryption Enabled—Indicates that encryption is enabled on the secure inner channel (WAN). For details, see About secure peers. |
| | Cloud Acceleration ON—Indicates that the legacy cloud acceleration service for SaaS applications is enabled. |
Source:Port | | Displays the connection source IP address and port. |
Destination:Port | | Displays the connection destination IP address and port. |
LAN/kB WAN/kB | | Displays the amount of LAN or WAN throughput, in kilobytes. |
Reduction | | Displays the degree of WAN traffic optimization as a percentage of LAN traffic sent. Higher percentages mean that fewer bytes were sent over the WAN. Red squares indicate that an optimizing connection is currently showing 0 percent data reduction, which might be caused by multiple scenarios. Typically, 0 percent data reduction occurs when the system is optimizing a session containing encrypted payload. You can set up an in-path pass-through rule to prevent the system from interception the connection for optimization. |
Start Time | | Displays the time that the connection was started. This column doesn’t apply to preexisting connections. Select the column heading to sort data start time in ascending or descending order. |
Application | | Displays the application associated with the connection. When Application Visibility is enabled (the default), the table displays the hierarchical, DPI-based application name (for example, HTTP > Facebook), instead of just the port-based name (for example, HTTP). When you expand a connection, a new Application row displays the hierarchical name, when available, or the port-based name if not. (For newly formed connections, the application name might have changed from what was reported in the table). Application visibility gives you a better sense of what applications are running instead of just seeing traffic through port numbers or web traffic classified as generic HTTP. |
User Identity | | Starting with RiOS 9.7, this field reports User IDs for SMB encrypted, SMB signed, and MoH connections that are optimized. The User IDs are propagated for any other traffic that uses the same IP address as the SMB or MoH 365 traffic. Starting with RiOS 9.5, this field also displays the user ID for Office 365 traffic when the SaaS User Identity feature is enabled in the Optimization > Protocols: HTTP page. Starting with RiOS 9.7, user IDs are also propagated for any traffic that uses the same IP address as Office 365 traffic. The following caveats apply to the SMB and MoH reporting feature: • For the user ID to appear in the client-side SteelHead’s current connections report, both the client-side and server-side SteelHeads must be running a RiOS version of 9.7 or later. • Network address translation (NAT) cannot be used before traffic reaches the SteelHead. • The SteelHead appliance extracts and reports User IDs each time any SMB encrypted, SMB signed, and MoH connections are optimized. User IDs are also extracted and reported for Office 365 SaaS connections if SaaS User Identity is enabled. If traffic that does not match those properties is received on the same IP address on which User IDs have been extracted, that traffic is reported as having the same user ID as the last-reported SMB, MoH, or SaaS connection. • This feature is enabled by default; to disable or reenable this feature, enter the [no] user-identity propagation enable and, optionally, [no] user-identity sources enable commands. See the Riverbed Command-Line Interface Reference Guide for command details. |
For information on removing an unknown SteelHead from the current connections list, see
Preventing unwanted peering.
Viewing the current connection details
The Current Connections report displays details about the connected appliances, such as the source and destination IP address, the peer SteelHead, the inner local port, and so on. You can also perform these operations:
• For optimized connections, send a keepalive message to the outer remote machine (the machine that is connected to this appliance)
• Reset any connection, optimized or pass-through
• Retrieve the most recent data for a connection
The report doesn’t allow the connection details to refresh automatically, because doing so could slow down the SteelHead; however, the connection age updates when you manually refresh the page.
You can view current connection details under Reports > Networking: Current Connections.
Click the arrow next to the connection in the connections table to see more details about an individual connection and perform operations on it. Because this report is a snapshot in time, by the time you click it, the connection could be gone or in a different state. Click Update to refresh the display.
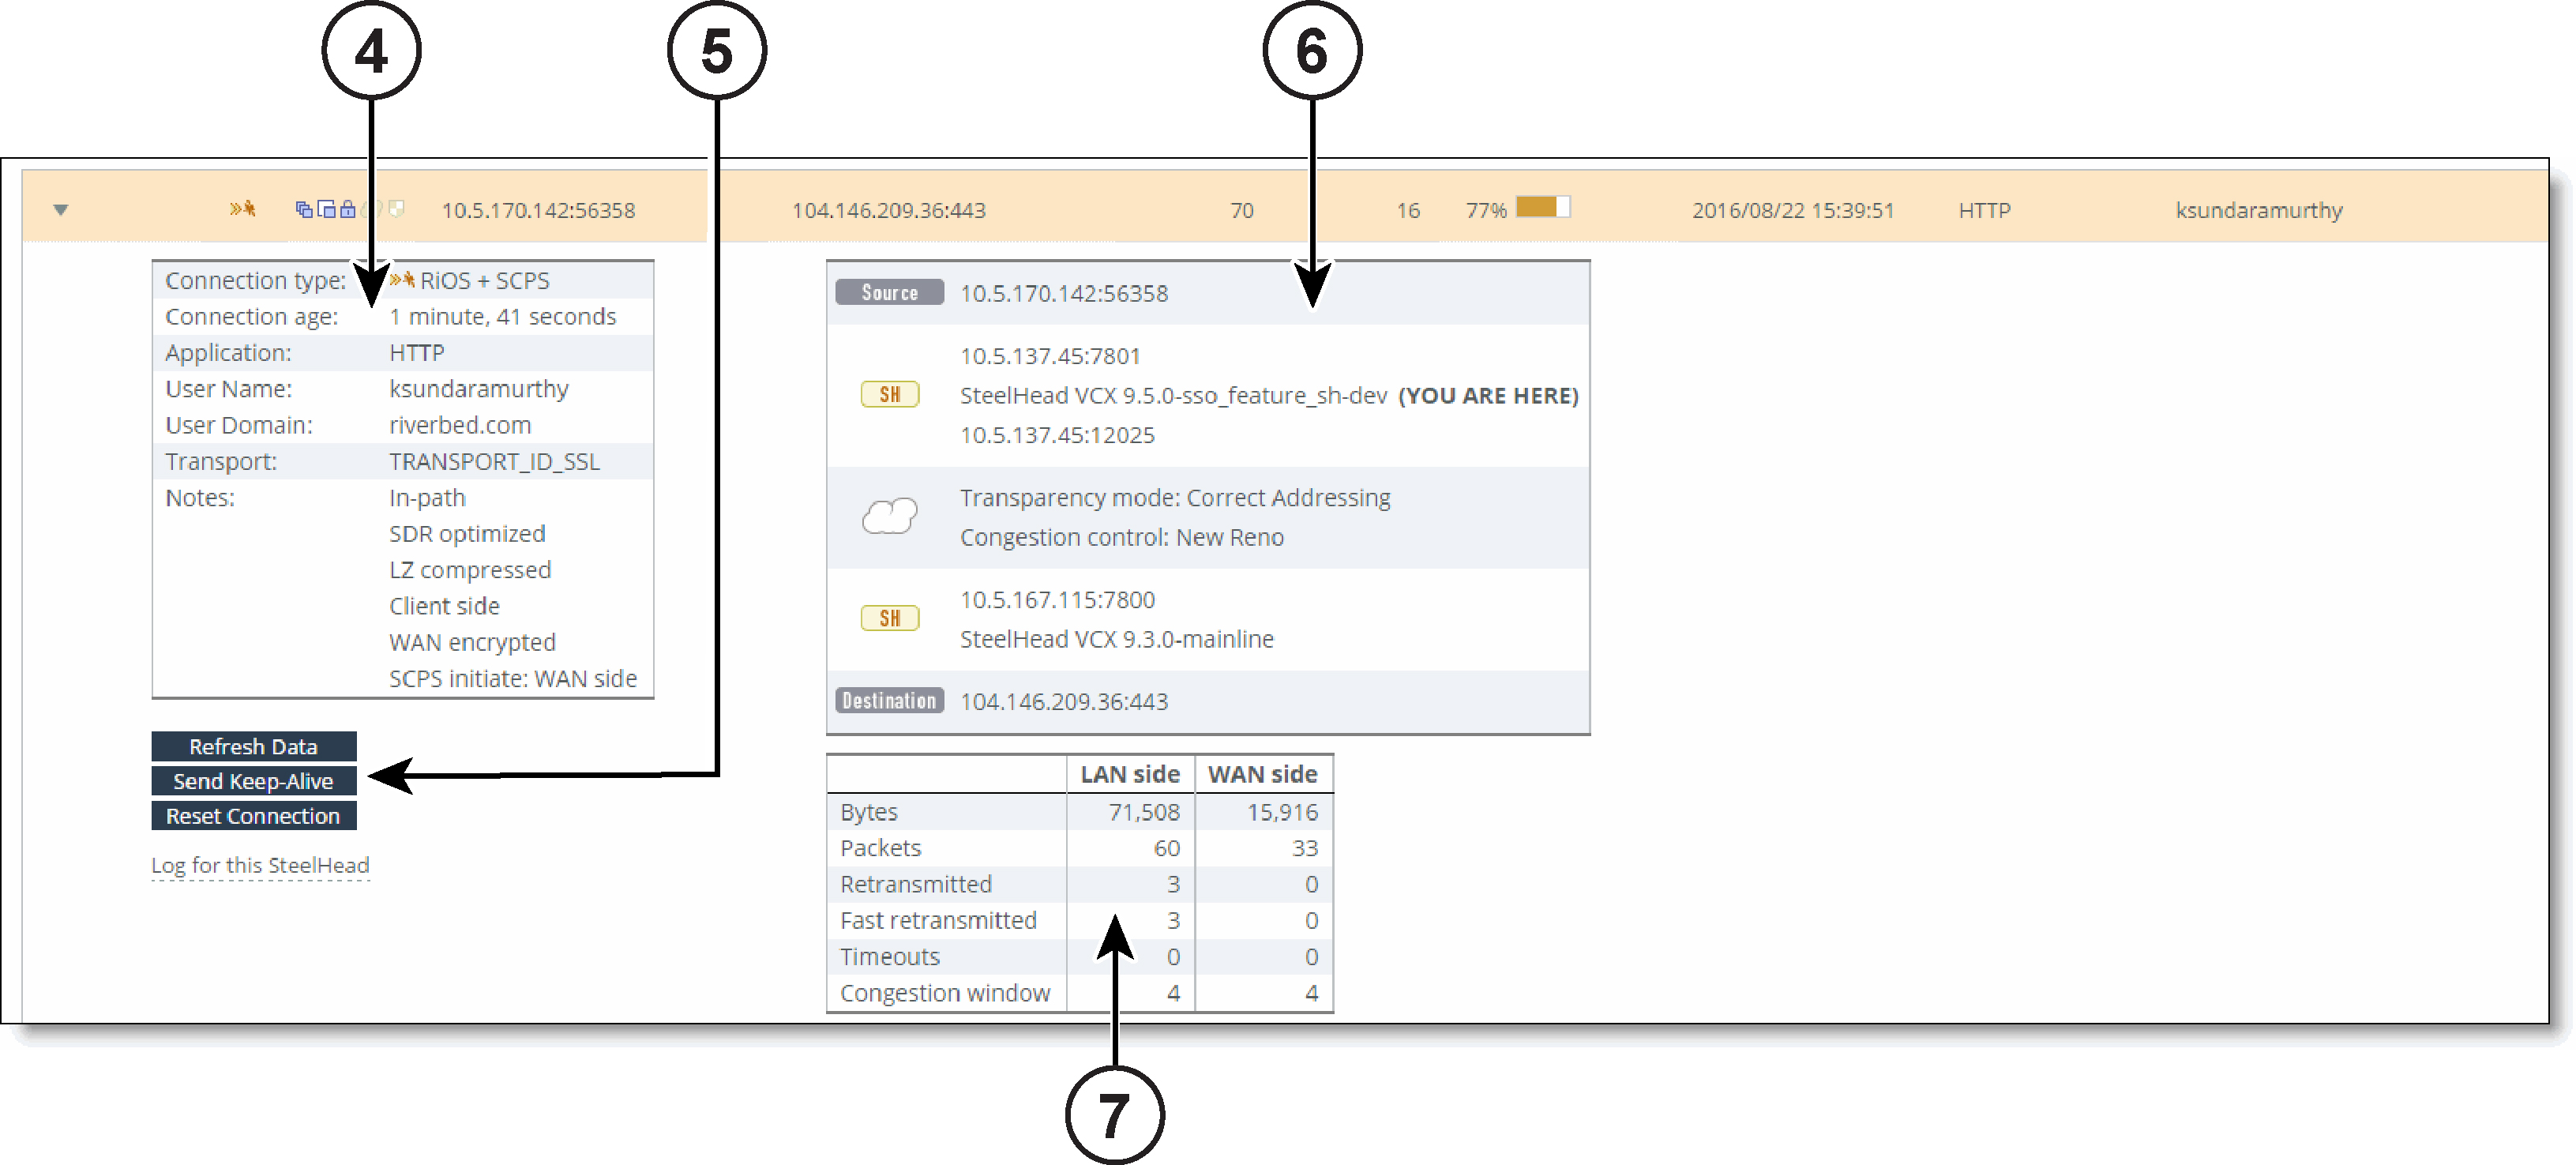
Current Connections Details for an Optimized Connection
To close the connection details report, click the close icon.
4 - Connection details
The expanded connection details vary, depending on the nature of the connection.
Optimized connection details
These fields summarize details about individual optimized connections. The fields that appear are dependent on the type of connection.
Connection type
Shows the connection type icon and whether the connection is established, opening, or closing.
Connection age
Shows the time since the connection was created.
Application
Shows the application corresponding to the connection (for example, NFS). When Application Visibility is enabled, more detailed protocol information is shown for some applications. For example, HTTP-SharePoint appears as the WebDAV or FPSE protocols and Office 365 appears as MS-Office-365 instead of HTTP.
Application error
Displays the application protocol error, if one exists.
Transport
Shows the transport protocol name: for example, SSL inner.
Transport error
Displays the transport protocol error, if one exists.
User Name
Shows the SSO user ID for Office 365 users.
User Domain
Shows the SSO user domain for Office 365 users.
Client side
Displays whether this appliance is on the client side.
Protocol
Shows the low-level protocol that RiOS is using inside the packet-mode channel. The protocol can be UDP, TCP, or variants.
SaaS application
Shows the SaaS application name, if one exists.
Cloud acceleration state
Shows the SaaS connection state, if a SaaS application is running (with the legacy cloud acceleration service).
Outbound QoS class
Shows the QoS outbound class the connection is associated with when shaping is enabled. When the connection carries multiple classes, the report displays Variable.
Outbound QoS DSCP
Shows the DSCP marking value for the connection when marking is enabled, even if it is zero. The report displays the value from the inner ToS. When the connection carries multiple values, the report displays Variable.
When relevant, the Notes section displays several details that are binary in nature.
GeoDNS IP result
Shows the GeoDNS IP address that the SteelHead is using to optimize Office 365. The connection summary displays the original destination IP address.
Notes
• In-path—This connection is in-path.
• Pre-existing—The connection existed before the last restart of the optimization service.
• Pre-existing asymmetric—The connection is traveling an asymmetric route and existed before the last restart of the optimization service.
Optimized connections might show the following notes:
• Client side—The SteelHead is on the client side of the connection.
• SDR optimized—SDR optimization is enabled.
• LZ compressed—LZ compression is enabled.
Packet-mode optimized connections might show the following note:
• Incomplete parse—The inner channel exists but the connection through the channel isn’t fully formed.
Optimized, nonpacket mode connections might show the following notes:
• In-path—This is an in-path connection.
• Single-ended—The connection involves only one SteelHead.
• WAN encrypted—Encryption is enabled on the secure inner channel (WAN).
• Cloud accelerated—The legacy cloud acceleration service for SaaS applications is enabled.
SCPS connections show at least one of the following notes:
• SCPS initiate: WAN side—The SteelHead has initiated the SCPS connection on the WAN.
• SCPS initiate: LAN side—The SteelHead has initiated the SCPS connection on the LAN.
• SCPS terminate: WAN side—The SteelHead has terminated the SCPS connection on the WAN.
• SCPS terminate: LAN side—The SteelHead has terminated the SCPS connection on the LAN.
WAN and LAN-Side Statistics
• LAN Bytes—Displays the total LAN bytes transmitted.
• WAN Bytes—Displays the total WAN bytes transmitted.
• Retransmitted—Displays the total packets retransmitted.
• Fast Retransmitted—Displays the total packets fast retransmitted. Fast retransmit reduces the time a sender waits before retransmitting a lost segment. If an acknowledgment isn’t received for a particular segment within a specified time (a function of the estimated round-trip delay time), the sender assumes the segment was lost in the network, and retransmits the segment.
• Timeouts—Displays the number of packet transmissions that timed out because no ACK was received.
• Congestion Window—Displays number of unACKed packets permitted, adjusted automatically by the SteelHead, depending on WAN congestion.
Optionally, to print the report, choose File > Print in your web browser to open the Print dialog box.
This list summarizes details about optimized and pass-through TCP connections using path selection. It displays the history of the three recent uplinks, in case the connection switches uplinks after an uplink goes down. This summary includes only nonpacket-mode flows.
You can filter based on connections for a specific path selection uplink name by entering the name into the matching regular expression filter.
Relayed
Displays the number of bytes relayed if all uplinks are down.
Dropped
Displays the number of bytes dropped if all uplinks are down.
Bypassed
Displays the number of bytes bypassed if all uplinks are down.
Reflected
Displays the number of bytes reflected.
Local uplink
Displays the uplink name.
Remote uplink
Displays the remote uplink name.
Status
Displays whether the uplink is reachable (Up) or unreachable (Down).
Last started
Displays the time the connection started using the uplink.
Bytes
Displays the total number of bytes transferred through the uplink.
The LAN kB value and this number don’t match. This value displays only the bytes using path selection on the WAN.
DSCP
Displays the DSCP marking set for the uplink.
For details, see .
This list summarizes details about individual pass-through or forwarded connections:
Connection Information
Connection Type
Displays a connection type icon and whether the pass-through was intentional or unintentional. Displays the forwarded reduction percentage bar for forwarded connections.
Connection Age
Displays the time since the connection was created.
Transport
Displays the transport protocol name: for example, SSL inner.
Application
Displays the application corresponding to the connection: for example, NFS.
Client-Side
Displays whether the connection is on the client side.
Pre-Existing
Displays whether the connection existed before the last restart of the optimization service.
Passthrough Reason
Displays the reason for passing through or forwarding the connection.
This table shows the connection pass-through reasons.
Value | Pass-through reason (varies by connection) | Description | Action |
|---|
0 | None | None | None |
1 | Preexisting connection | Connection existed before SteelHead started. | Create a connection. |
2 | Connection paused | SteelHead isn’t intercepting connections. | Check that the service is enabled, in-path is enabled, the neighbor configuration, and whether the SteelHead is in admission control. |
3 | SYN on WAN side | Client is on the SteelHead WAN side. | Either this is the server-side SteelHead and there’s no client-side SteelHead, or the client-side SteelHead did not probe. Check the cabling if it is really the client-side SteelHead. |
4 | In-path rule | In-path rule matched on the client-side SteelHead is pass-through. | Check the in-path rules. |
5 | Peering rule | Peering rule matched on the server-side SteelHead is pass-through. | Check the peering rules. |
6 | Inner failed to establish | Inner connection between SteelHeads failed. | Check the connectivity between the client-side SteelHead and the server-side SteelHead. |
7 | Peer in fixed-target rule down | The target of a fixed-target rule is destined to a failed peer. | Check the connectivity between the client-side SteelHead and the server-side SteelHead. |
8 | No SteelHead on path to server | No server-side SteelHead. | Check that the server-side SteelHead is up and check that the connection goes through the server-side SteelHead. |
9 | No route for probe response | No route to send back probe response. | Check in-path gateway on the server-side SteelHead. |
10 | Out of memory | Memory problem while copying packet. | Check if the SteelHead is out of memory. |
11 | No room for more TCP options | Not enough space in TCP header to add probe. | This condition occurs when another device added TCP options before the SteelHead. Take a TCP dump to check which TCP options are in the SYN packet. Search for those options to learn what device uses them. |
12 | No proxy port for probe response | There is no service port configured on server-side SteelHead. | Configure a service port. |
13 | RX probe from failover buddy | The connection is intercepted by failover buddy. | No action is necessary. |
14 | Asymmetric routing | The connection is asymmetric. | Check the asymmetric routing table for reason. |
15 | Middle SteelHead | The SteelHead isn’t the first or last SteelHead. | Only happens when the Enhanced Auto-Discovery Protocol is enabled. |
16 | Error connecting to server | The server-side SteelHead couldn’t connect to the server. | Only happens when the Enhanced Auto-Discovery Protocol is enabled. |
17 | Half open connections above limit | The client has too many half-opened connections. | Check if many connections open quickly from the same client. |
18 | Connection count above QOS limit | There are too many connections for that QoS class. | Check the QoS class. |
19 | Reached maximum TTL | The probe has an incorrect TTL. | Take a trace to check the probe. |
20 | Incompatible probe version | The probe has an incompatible version number. | Check if the new probe format is enabled, it is disabled by default. |
21 | Too many retransmitted SYNs | The client SYN has been retransmitted too many times. | Check if there’s a firewall that doesn’t like the probe TCP option. |
22 | Connection initiated by neighbor | The connection is intercepted by a neighbor. | No action is necessary. |
24 | Unknown reason | The pass-through reason doesn’t match any other description. | No action is necessary. |
25 | Connection from proxy target | Because the connection originates from an IP address that is also the IP address of a fixed-target rule, it isn’t intercepted. | No action is necessary. |
26 | SYN before SFE outer completes | The client connection was passed through at the client-side SteelHead and the client's pure SYN was seen at the server-side SteelHead. | Check if there’s a firewall that doesn’t like the probe TCP option. |
27 | Transparent inner on wrong VLAN | The inner connection seen on VLAN is different than the in-path VLAN. | No action is necessary. |
28 | Transparent inner not for this host | The inner connection is not meant for this host. | No action is necessary. |
29 | Error on neighbor side | The neighbor SteelHead returned an error to a connection-forwarding request. | Check the health of the configured neighbors. |
30 | SYN/ACK, but no SYN | There is asymmetric routing - received SYN/ACK but no SYN. | Check your routing. |
31 | Transparency packet from self | For Riverbed internal use only. | No action is necessary. |
32 | System is heavily loaded | The SteelHead is experiencing a heavy traffic load. | Contact Support. You might require a larger model SteelHead. |
33 | SYN/ACK at MFE not SFE | There is asymmetric routing around the server-side SteelHead. | Check your routing. |
34 | Windows branch mode detected | The client-side is a SteelHead Mobile. Optimization is occurring between the SteelHead Mobile and the server-side SteelHead, so the connection is passed through on the client-side SteelHead. | No action is necessary. |
35 | Transparent RST to reset firewall state | The optimization service has sent an RST to clear the probe connection created by the SteelHead and to allow for the full transparent inner connection to traverse the firewall. | No action is necessary. |
36 | Error on SSL inner channel | An inner channel handshake has failed with peer. | Check the SSL configuration on both SteelHeads. |
37 | Netflow only: Ricochet packet of optimized connection | This pass-through reason is attributed to a flow reported to a NetFlow v9 collector. A probe and packet have been sent by the SteelHead back through itself. For example, in an in-path setup, if a client-side SteelHead gateway is on its WAN side, all packets sent to the client will first go to the gateway and be sent back through the SteelHead on the way to the client. | Packet ricochet can be avoided in many environments by enabling simplified routing. |
38 | Passthrough due to MAPI admission control | New MAPI connections will be passed through due to high connection count. | New MAPI connections are optimized automatically when the MAPI traffic has decreased. |
39 | A SYN or RST packet contains data | | |
40 | Failed to discover SCPS device | RiOS can’t find an SCPS device. | |
41 | No matching client/server IPv6 scope | RiOS can’t set up the outer channel connection. | RiOS passes all packets through until it creates the outer channel. |
42 | Failed to create sport outer channel | RiOS can’t set up the outer channel connection. | RiOS passes all packets through until it creates the outer channel. |
43 | Flows not matching in-path rule | RiOS can’t match this traffic flow to any packet-mode optimization in-path rule. A packet-mode optimization rule defines the inner channel characteristics. | RiOS passes all packets through while the flow is in this state. Choose Optimization > In-Path rules to add a fixed-target packet-mode optimization in-path rule. |
44 | Packet mode channel setup pending | RiOS is attempting to set up the inner IPv4 or IPv6 channel connection. | RiOS passes all packets through until it creates the inner IPv4 or IPv6 channel. |
45 | Peer does not support packet-mode optimization | The peer SteelHead to which RiOS needs to establish the inner IPv4 or IPv6 channel connection doesn’t support packet-mode optimization or packet-mode optimization isn’t enabled. | RiOS stops trying to optimize connections using packet-mode optimization with the peer. |
46 | Generic Flow error | A packet-mode optimization traffic flow transitions to this state when RiOS encounters one of these unrecoverable errors: • There isn’t enough memory to set up the inner channel. • The system has requested that RiOS kill the traffic flow. When RiOS receives this error, the SteelHead abandons all attempts to optimize the flow. | RiOS passes the flow through for its lifetime. |
47 | Failed to cache sock pointer | While configured for packet-mode optimization, RiOS can’t locate the socket pointer used to exchange packets through the inner channel. The system is attempting to write packets to the ring, but the socket is closed. This condition can occur when the optimization service shuts down unexpectedly. | Choose Administration > Maintenance: Services and restart the optimization service. |
48 | Packet mode optimization disabled | The connection is being passed through because packet-mode optimization is disabled. | Choose Optimization > In-path Rules and enable packet-mode optimization. |
49 | Optimizing local connections only | On a SteelHead EX, the connection is being passed through because it did not originate locally. | |
50 | Netflow only: probe packet of optimized connection | | |
51 | IPv6 connection forwarding requires multi-interface support | RiOS is passing the connection through because the client-side SteelHead is configured without multi-interface connection forwarding. This configuration doesn’t support IPv6. | Choose Networking > Connection Forwarding and enable multiple interface support. |
52 | Neighbor does not support IPv6 | RiOS is passing the connection through because a connection-forwarding neighbor doesn’t support IPv6. | Upgrade the connection-forwarding neighbor to RiOS 8.0 or later. |
53 | Reached the hard limit for the number of entries | RiOS is passing the connection through because it hit the maximum allowed limit for nonreusable connection entries. | |
54 | Connection or flow from GRE IPv4 tunnel | | |
SaaS connection details
This table shows the SaaS connection details.
Value | Reason | Description | Action |
|---|
0 | None | None | None |
1 | Optimized connection | Connection is redirected through the SteelHead SaaS to a SaaS service. | No action is necessary. |
This table lists the connection pass-through reasons for SaaS connections with the Legacy Cloud Accelerator service.
Value | Pass-through reason (varies by connection) | Description | Action |
|---|
2 | Inner Connection through Legacy Cloud Accelerator | An inner connection to a remote SteelHead is running in the cloud. | No action is necessary. |
3 | Not a supported SaaS destination | Connection is through a SaaS service that isn’t supported, subscribed to, or enabled. | No action is necessary; however, if you want to optimize this destination IP address, contact Support. |
4 | Due to configured In-path rule | Connection isn’t redirected through the SteelHead SaaS due to an in-path rule to disable cloud acceleration. | Check that the Cloud Acceleration field in the relevant in-path rule is set to Auto. |
5 | Due to configured Peering rule | Connection isn’t redirected through the SteelHead SaaS due to a peering rule to disable cloud acceleration. | Check that the Cloud Acceleration field in the relevant peering rule is set to Auto. |
6 | Cloud acceleration disabled | Connection isn’t redirected through the SteelHead SaaS because it is disabled. | Check the Legacy Cloud Accelerator configuration. Choose Optimization > Legacy Cloud Accelerator and select the Enable Cloud Acceleration check box in the Legacy Cloud Accelerator page. |
7 | Redirection disabled globally | Connection isn’t redirected through the SteelHead SaaS because cloud acceleration redirection is disabled. | Choose Optimization > Legacy Cloud Accelerator and select the Enable Cloud Acceleration Redirection check box in the Legacy Cloud Accelerator page. |
8 | Redirection disabled for relay | Connection isn’t redirected through SteelHead SaaS because cloud acceleration redirection for this in-path interface is disabled. | Check the Legacy Cloud Accelerator redirection configuration for the relevant in-path interface on the command-line interface. Enter the show service cloud-accel CLI command on the command-line interface. For details, see the Riverbed Command-Line Interface Reference Guide. |
9 | Cloud proxy is down | Connection isn’t redirected through SteelHead SaaS because the redirection service encountered an error. | Contact Support. |
10 | No PQID added by first SteelHead | Connection isn’t redirected through SteelHead SaaS because the SteelHead closest to the client has SteelHead SaaS disabled or misconfigured. | Check the Legacy Cloud Accelerator configuration on the client-side SteelHead. |
11 | Failed to append CP code | Connection isn’t redirected through SteelHead SaaS because of a packet processing error. | Contact Support. |
12 | SYN retransmit (backhauled) | Connection isn’t redirected through SteelHead SaaS because too many SYN retransmits were received from the client. | Check if there’s a firewall that doesn’t allow inbound or outbound UDP packets for the SteelHead. |
13 | SYN retransmit (direct) | Connection isn’t redirected through SteelHead SaaS because too many SYN retransmits were received from the client. | Check if there’s a firewall that doesn’t allow inbound or outbound UDP packets for the SteelHead. |
14 | Passing to downstream SteelHead | Connection isn’t redirected through SteelHead SaaS because admission control is reached and there’s a SteelHead downstream that might optimize the connection. | No action is necessary. |
15 | Passthrough SYN retransmit | Connection isn’t redirected through SteelHead SaaS because too many SYN retransmits were received from the client. | Check if there’s a firewall that doesn’t allow inbound or outbound UDP packets for the SteelHead. |
16 | Rejected by cloud proxy | Connection isn’t redirected through SteelHead SaaS because the SteelHead SaaS network rejected the connection. | Contact Support. |
17 | Invalid Entitlement code | Connection isn’t redirected through SteelHead SaaS because of an invalid SteelHead SaaS configuration. | Contact Support. |
18 | Invalid timestamp | Connection isn’t redirected through SteelHead SaaS because the clock on the SteelHead isn’t synchronized. | Check the date and time settings on the SteelHead. |
19 | Invalid customer ID | Connection isn’t redirected through SteelHead SaaS because of an invalid SteelHead SaaS configuration. | Contact Support. |
20 | Invalid ESH ID | Connection isn’t redirected through SteelHead SaaS because of an invalid SCA configuration. | Contact Support. |
21 | Invalid SaaS ID | Connection isn’t redirected through SteelHead SaaS because of an invalid SCA configuration. | Contact Support. |
22 | Connection limit reached | Connection isn’t redirected through SteelHead SaaS because the subscription limit for the number of connections is reached. | Contact Support. You might require a higher SteelHead SaaS license. |
23 | Bandwidth limit reached | Connection isn’t redirected through SteelHead SaaS because the subscription limit for bandwidth used is reached. | Contact Support. You might require a higher SteelHead SaaS license. |
5 - Tools
This section provides buttons that perform an operation on a single connection. It also provides a link to log information.
You can perform these operations:
Send Keep-Alive
For an optimized connection, sends a keepalive message to the outer remote machine (the machine that is connected to this appliance). This operation isn’t available for a pass-through connection. This button is dimmed for users logged in as a monitor user.
Refresh Data
Retrieves the most recent data for the connection.
Reset Connection
Sends an RST packet to both the client and server to close the connection. You can reset both optimized and pass-through connections. You can’t reset a forwarded connection.
If no data is being transferred between the client and server when you click Reset Connection, the connection isn’t reset immediately. It resets the next time the client or server tries to send a message. Therefore, when the application is idle, it might take a while for the connection to disappear.
This button is dimmed for users logged in as a monitor user.
Log for this SteelHead
Takes you to the System Logs page.
Control | Description |
|---|
Send Keep-Alive | For an optimized connection, click to send a keepalive message to the outer remote machine (the machine that is connected to this appliance). This operation isn’t available for a pass-through connection. This button is dimmed for users logged in as a monitor user. |
Refresh Data | Click to retrieve the most recent data for the connection. |
Reset Connection | Click to send an RST packet to both the client and server to close the connection. You can reset both optimized and pass-through connections. You can’t reset a forwarded connection. Note: If no data is being transferred between the client and server when you click Reset Connection, the connection isn’t reset immediately. It resets the next time the client or server tries to send a message. Therefore, when the application is idle, it might take a while for the connection to disappear. This button is dimmed for users logged in as a monitor user. |
Log for this SteelHead | Click to go to the System Logs page. |
6 - Network topology
This section shows a graphical representation of the connection source-to-destination network topology and information associated with the different elements. This graphic varies depending on the connection type and is only relevant for optimized connections. It doesn’t appear for pass-through connections.
The topology shows this information:
• All of the IP addresses and port numbers associated with the connection.
• Transparency mode, which describes the visibility of each actual IP address and port on the SteelHeads to each other, for terminated connections only. For details, see
About in-path rule settings.
• Congestion control, including the method in use to mitigate WAN congestion. For details on congestion-control types, see
About TCP.
• SteelHead models and RiOS versions.
• A “YOU ARE HERE” label identifies the SteelHead whose page you are viewing.
7 - LAN/WAN table
This table shows raw tallies for LAN and WAN connections to summarize data about channel processing for a specific connection. The table varies by type of connection.
Use this table to answer questions such as:
• For any given channel, how many bytes (or packets) did the channel receive and subsequently transmit?
• Which channels have processed the most traffic? The least traffic?
• What error types and quantities were encountered for traffic inbound from the WAN?
• What error types and quantities were encountered for traffic inbound from the LAN?
This list provides an explanation for some of the fields:
Bytes
Displays the total of transmitted LAN and WAN bytes.
Packets
Displays the total of transmitted WAN and LAN packets.
Retransmitted
Displays the total of retransmitted WAN and LAN packets.
Fast Retransmitted
Displays the total fast-retransmitted packets. Fast retransmit reduces the time a sender waits before retransmitting a lost segment. If an acknowledgment isn’t received for a particular segment within a specified time (a function of the estimated round-trip delay time), the sender assumes the segment was lost in the network, and retransmits the segment.
Timeouts
Displays the number of packet transmissions that timed out because no ACK was received.
Congestion Window
Displays number of unACKed packets permitted, adjusted automatically by the SteelHead, depending on WAN congestion.
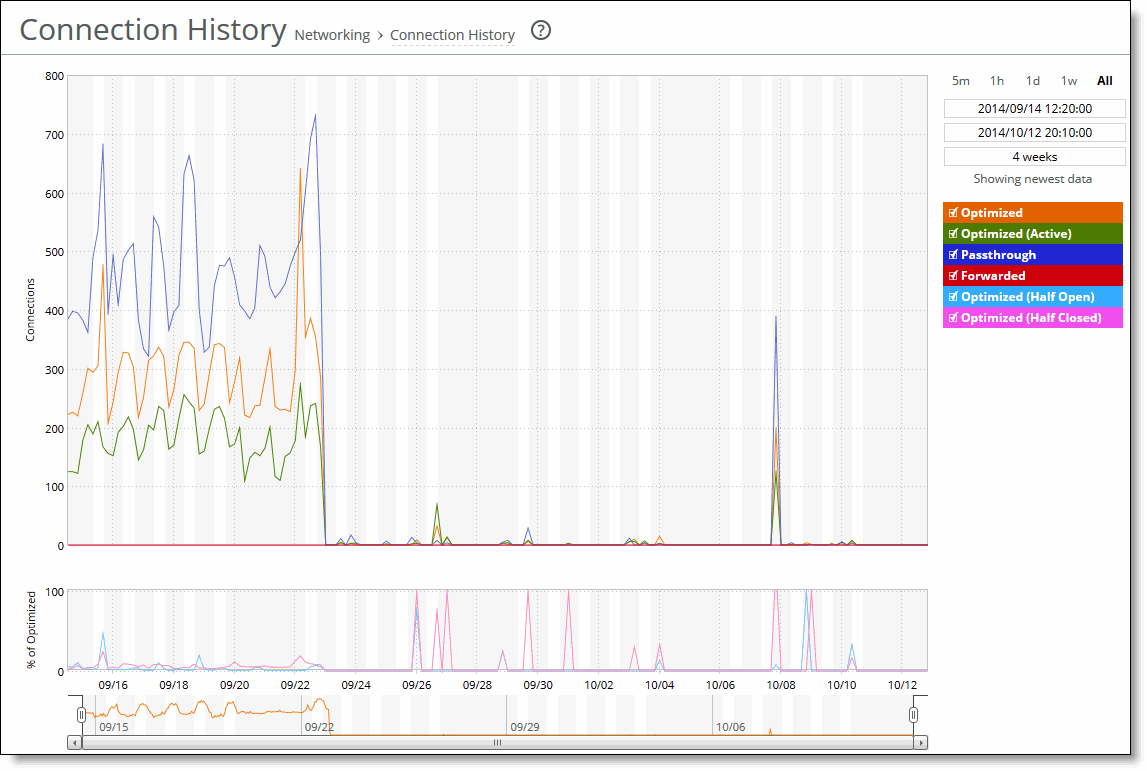
Viewing the Connection History report
The Connection History report summarizes connection history and shows connection counts for a variety of connection types for the time period specified.
Optimized
Displays the total connections, including half-open, half-closed (where half-open and half-closed are TCP connection states), idle, established, and optimized.
Optimized (Active)
Displays the total active connections that are established and optimized.
Passthrough
Displays the total connections passed through unoptimized.
Forwarded
Displays the total number of connections forwarded by the connection-forwarding neighbor managing the connection.
Optimized (Half Open)
Displays the percentage of half-opened connections represented in the optimized connection total. A half-open connection is a TCP connection that has not been fully established. Half-open connections count toward the connection count limit on the SteelHead because, at any time, they might become a fully open connection.
If you are experiencing a large number of half-opened connections, consider a more appropriately sized SteelHead.
Optimized (Half Closed)
Displays the percentage of half-closed active connections represented in the optimized connection total. Half-closed connections are connections that the SteelHead has intercepted and optimized but are in the process of being disconnected. These connections are counted toward the connection count limit on the SteelHead. (Half-closed connections might remain if the client or server doesn’t close its connections cleanly.)
If you are experiencing a large number of half-closed connections, consider a more appropriately sized SteelHead.
The navigator shadows the optimized series.
The Connection History report answers these questions:
• How many connections were optimized?
• How many connections were passed through, unoptimized?
• What’s the percentage of half-opened connections represented in the total optimized connections?
• What’s the percentage of half-closed connections represented in the total optimized connections?
Mouse over a specific data point to see the values and exact time stamp.
The Riverbed system reports on performance for periods up to one month. Due to performance and disk space considerations, the display granularity decreases with time passed since the data was sampled. The data is collected at a 5-minute granularity for the entire month.
You view the Connection History report under Reports > Networking: Connection History.
Connection History page
This option is available to customize the report:
Time interval
Specifies a report time interval of 5 minutes (5m), 1 hour (1h), 1 day (1d), 1 week (1w), All, or type a custom date. All includes statistics for the last 30 days.
Time intervals that don’t apply to a particular report are dimmed.
For a custom time interval, enter the start time and end time using this format: yyyy/mm/dd hh:mm:ss
You can view the newest data and see data points as they’re added to the chart dynamically. To display the newest data, click Show newest data.
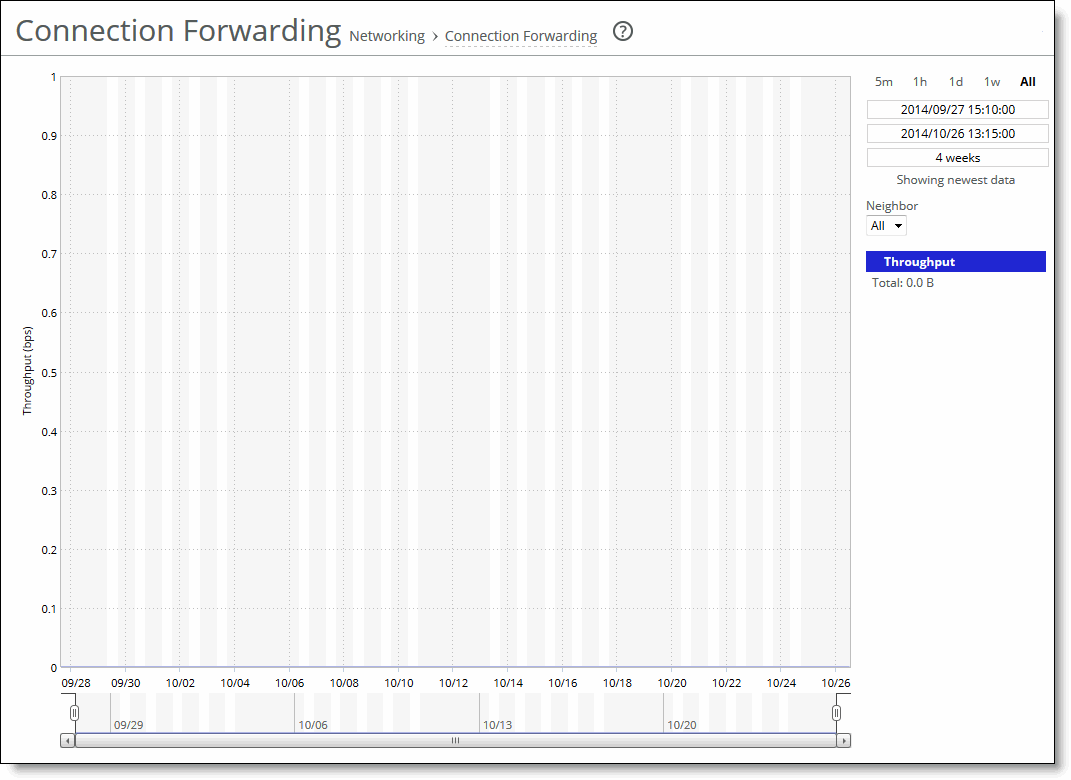
Viewing the Connection Forwarding report
The Connection Forwarding report summarizes the data throughput between the SteelHead and a specified neighbor (or all neighbors).
Throughput
Displays the throughput in bits per second. The navigator shadows the throughput series.
You configure neighbors when you enable connection forwarding.
The Connection Forwarding report answers this question:
• How many bytes were transferred between a SteelHead and a specified neighbor?
Mouse over a specific data point to see what the y values and exact time stamp were in relation to peaks.
The Riverbed system reports on performance for periods up to one month. Due to performance and disk space considerations, the display granularity decreases with time passed since the data was sampled. The data is collected at a 5-minute granularity for the entire month.
You view the Connection Forwarding report under Reports > Networking: Connection Forwarding.
Connection Forwarding page
Use these options to customize the report:
Time interval
Specifies a report time interval of 5 minutes (5m), 1 hour (1h), 1 day (1d), 1 week (1w), All, or type a custom date. All includes statistics for the last 30 days. Time intervals that don’t apply to a particular report are dimmed. For a custom time interval, enter the start time and end time using this format: yyyy/mm/dd hh:mm:ss
You can view the newest data and see data points as they’re added to the chart dynamically. To display the newest data, click Show newest data.
Neighbor
Specifies a neighbor from the drop-down list or All to display all neighbors.
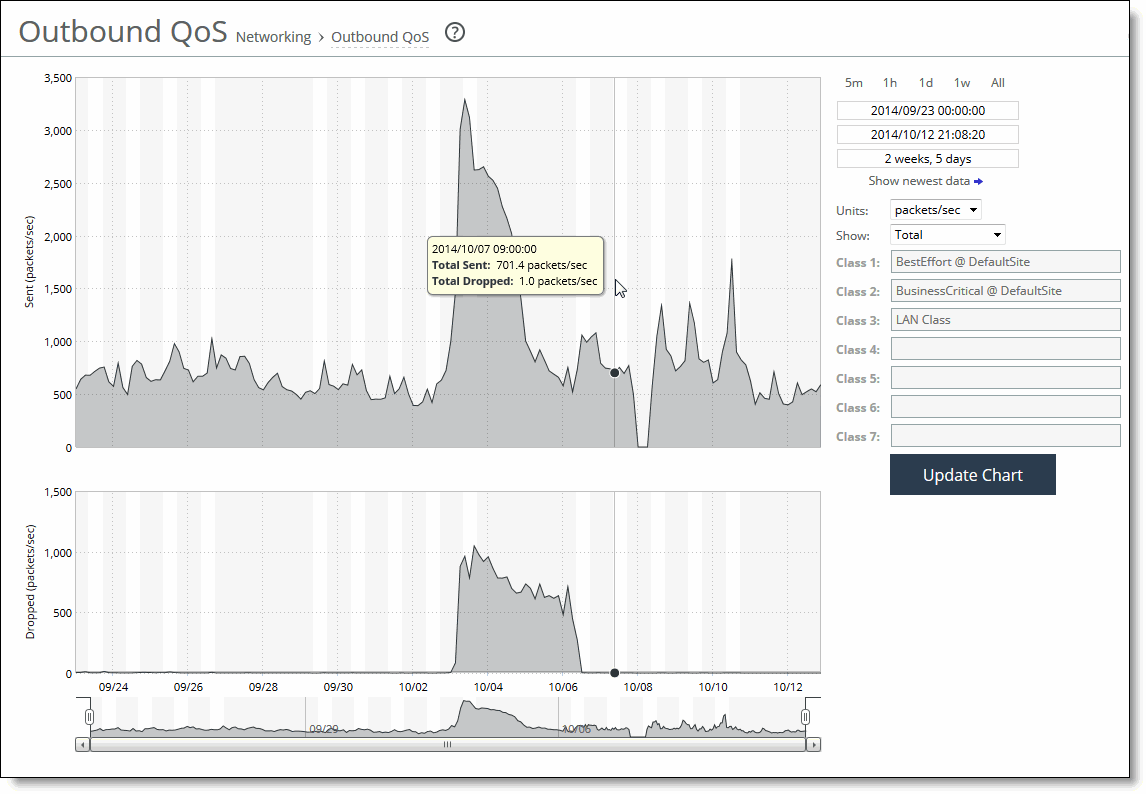
Viewing the Outbound QoS report
The Outbound QoS report summarizes the number of bits per second or packets per second transmitted for either a set of QoS classes (up to seven) or an aggregate total of all classes for the time period specified.
Upgrading from RiOS 8.0.x (or earlier) to version 9.0 or later changes the QoS statistics data. The Outbound QoS report will not show any statistics from a previous configuration. The Outbound QoS report answers these questions:
• Is outbound QoS working correctly?
• How many bits or packets per second were transmitted over the WAN for the QoS classes?
• How many bits or packets per second were sent and dropped for the QoS classes?
The Outbound QoS report might display this message for a traffic class even when QoS is shaping it.
This is because the report limits the data sample display to only the first 1000 classes. When a class falls beyond the first 1000 lines of classes, the report displays no data.
Mouse over a specific data point to see what the y values and exact time stamp were in relation to peaks.
The Riverbed system reports on performance for periods up to one month. Due to performance and disk space considerations, the display granularity decreases with time passed since the data was sampled with a granularity of 5 minutes for the day, 1 hour for the last week, and 2 hours for the rest of the month.
You view the Outbound QoS report under Reports > Networking: Outbound QoS.
Outbound QoS page
These options are available to customize the report:
Time interval
Specifies a report time interval of 5 minutes (5m), 1 hour (1h), 1 day (1d), 1 week (1w), All, or type a custom date. All includes statistics for the last 30 days. Time intervals that don’t apply to a particular report are dimmed. For a custom time interval, enter the start time and end time using this format: yyyy/mm/dd hh:mm:ss
Because the system aggregates data on the hour, request hourly time intervals. For example, setting a time interval to 08:30:00 to 09:30:00 from 2 days ago doesn’t create a data display, whereas setting a time interval to 08:00:00 to 09:00:00 from 2 days ago will display data.
When you request a custom time interval to view data beyond the aggregated granularity, the data is not visible because the system is no longer storing the data. For example, the following custom time intervals don’t return data because the system automatically aggregates data older than 7 days into 2-hour data points:
• Setting a 1-hour time period that occurred 2 weeks ago.
• Setting a 75-minute time period that occurred more than 1 week ago.
You can view the newest data and see data points as they’re added to the chart dynamically. To display the newest data, click Show newest data.
Units
Specifies either packets/sec or bps from the drop-down list.
Classes
Specifies Total or Selected classes from the drop-down list. Selected classes lets you narrow the report by choosing from drop-down lists of classes and remote sites (up to seven). You can’t select a class or a class @ site more than once.
Click Update to change the QoS class selection without updating the chart.
When the report display includes the total classes, the data series appear as translucent; selected classes appear as opaque.
When the report display includes the total classes, the navigator shadows the total sent series. When the report display includes selected classes and remote sites, the navigator shadows the first nonempty sent series. A data series can be empty if you create a QoS class but it has not seen any traffic yet.
Selecting a parent class displays its child classes. For example, the report for an HTTP class with two child classes named WebApp1 and WebApp2 displays statistics for HTTP, WebApp1, and WebApp2.
When a selected class has descendant classes, the report aggregates the statistics for the entire tree of classes. It displays the aggregated tree statistics as belonging to the selected class.
Viewing the Top Talkers report
The Top Talkers report displays the top talking hosts on a per-port basis for the time period specified. The traffic flows that generate the heaviest use of WAN bandwidth are known as the Top Talkers. This report provides WAN visibility for traffic analysis, security monitoring, accounting, load balancing, and capacity planning. It can include both optimized and pass-through traffic.
A traffic flow consists of data sent and received from a first single IP address and port number to a second single IP address and port number over the same protocol. Only traffic flows that start in the selected time period are shown in the report.
The Top Talkers report doesn’t include IPv6 traffic.
The Top Talkers report includes bytes used for packet headers and is an approximation based on various assumptions.
The Top Talkers report contains these statistics that summarize Top Talker activity:
Rank
Displays the relative position of the traffic flow WAN bandwidth use.
<Sender> IP Address 1:Port
Displays the first IP address and port for the connection.
<Receiver> IP Address 2:Port
Displays the second IP address and port for the connection.
Byte Count
Displays the total number of bytes sent and received by the first IP address.
You can export this report in CSV format in the Export report. The CSV format allows you to easily import the statistics into spreadsheets and databases. You can open the CSV file in any text editor. For details, see
Exporting performance statistics.
Flow Export must be enabled before viewing the Top Talker report.
The Top Talkers report answers this question:
• Who were the top talking hosts on a per-port basis?
The Riverbed system reports on performance for periods up to one month. Due to performance and disk space considerations, the display granularity decreases with time passed since the data was sampled. The data is collected at a 5-minute granularity for the entire month.
You view the Top Talkers report under Reports > Networking: Top Talkers.
Top Talkers page
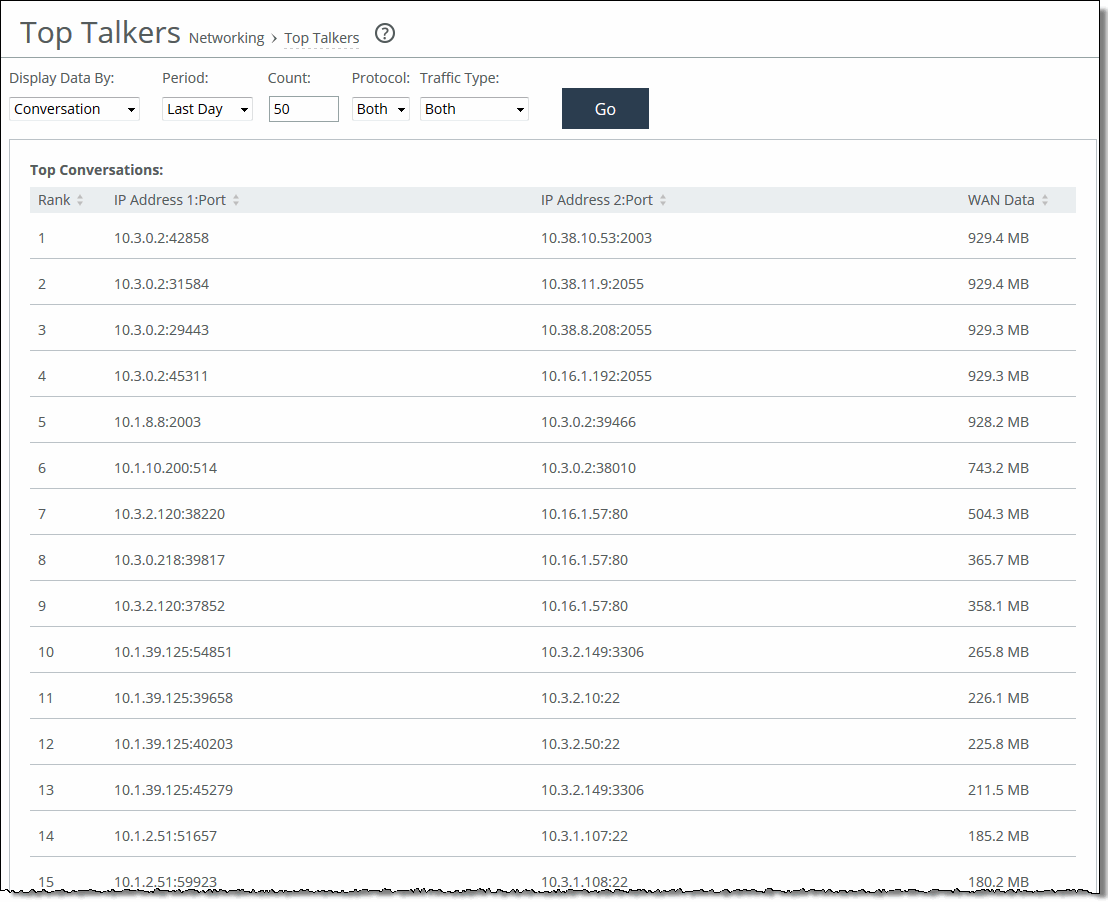
Use these options to customize the report:
Chart
Specifies the report display from the drop-down list: By Conversation, By Sender, By Receiver, By Host, or By Application Port. The default setting is By Conversation.
Period
Displays the traffic statistics for the past hour, the past 24 hours, or all available hours. All is the default setting, which displays statistics for the entire duration the SteelHead has gathered statistics. This duration can be up to 2 days, depending on how long the service has been up and the traffic volume. Select All, Last Hour, or Last Day from the drop-down list. The default setting is All.
Top Talker statistics aren’t persistent between service restarts.
Count
Specifies y how many top pairs of IP addresses and ports with the highest total traffic (sent and received) appear in the report. Each pair shows the number of bytes and packets sent and received at IP address 1. The default value is 50.
You can export the complete list of top talkers to a file in CSV format using the Export report.
Protocol
Specifies Both, TCP, or UDP from the drop-down list. The default value is Both.
Traffic Type
Specifies Both, Optimized, or Passthrough from the drop-down list. The default value is Both.
Go
Displays the report.
The Top Talkers data doesn’t exactly match the Traffic Summary data, the Bandwidth Optimization data, or specific connection data that appears when you select a particular connection in the Current Connections report. This variation is due to packet headers, packet retransmits, and other TCP/IP effects that flow export collectors see, but RiOS doesn’t. Consequently, the reports are proportional but not equivalent.
Select a Top Talkers report column heading to sort the column in ascending or descending order.
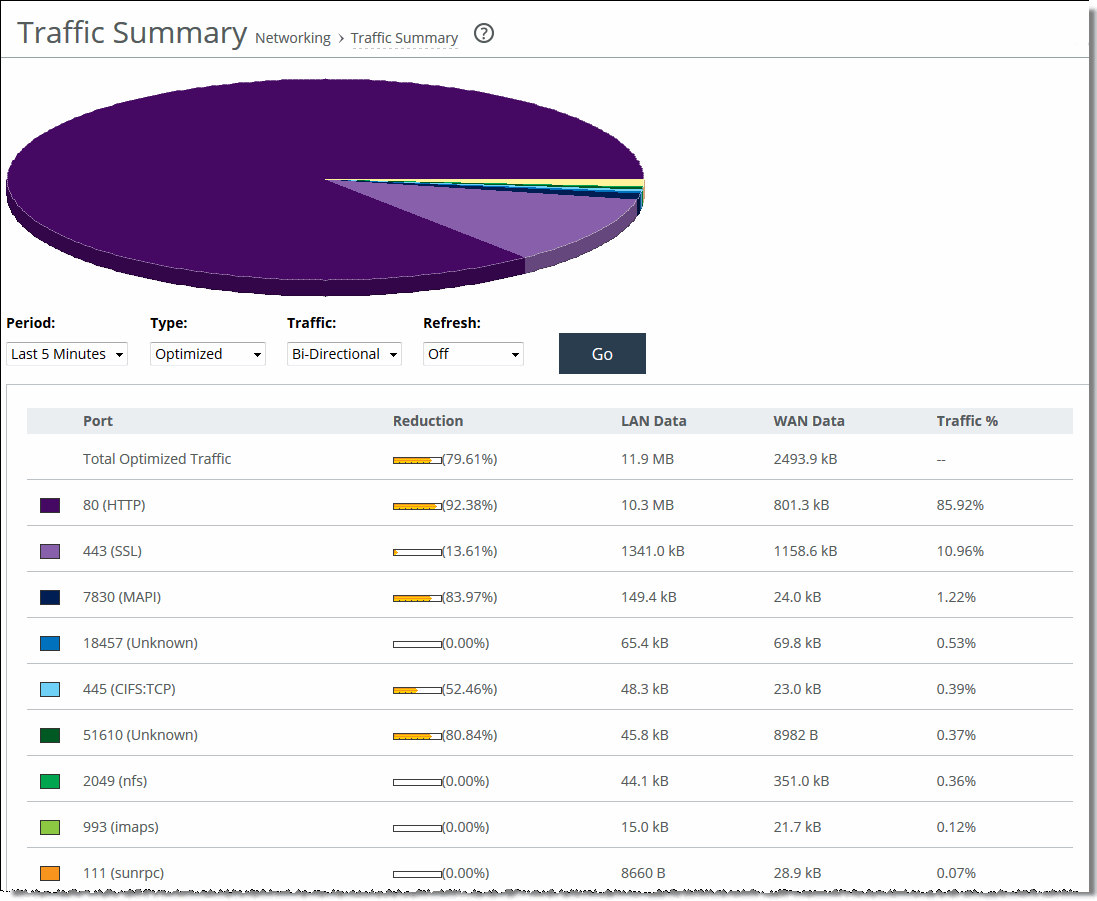
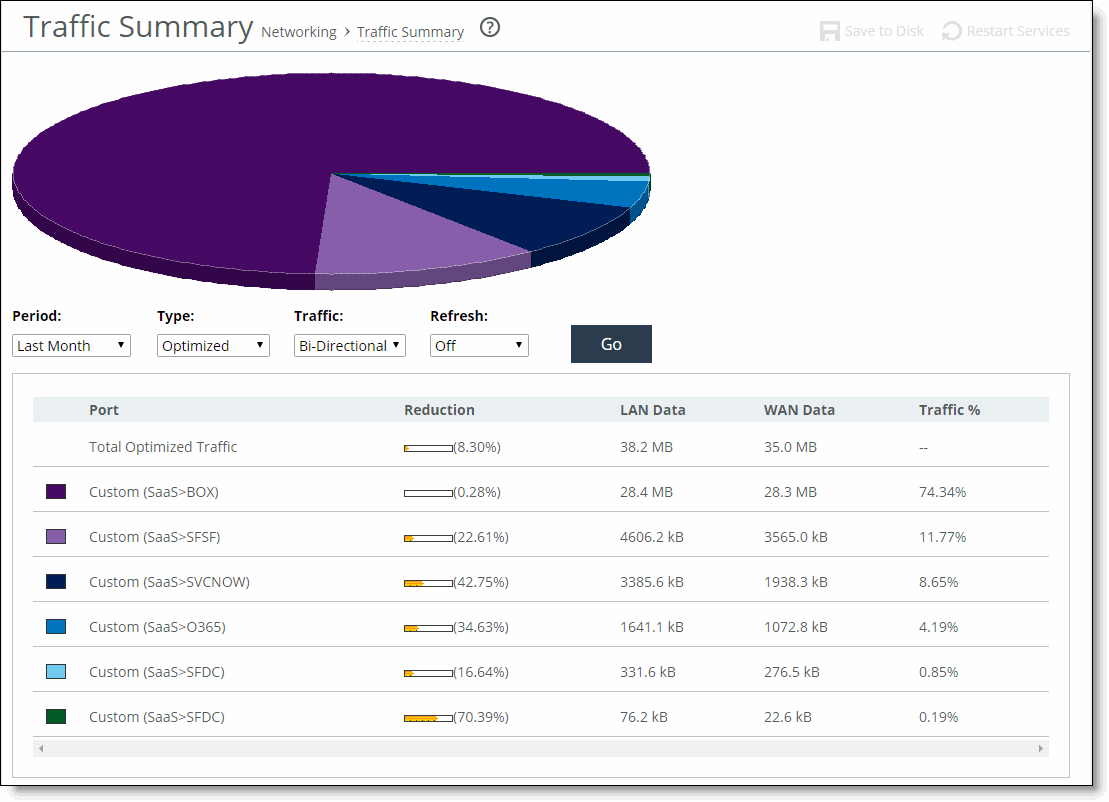
Viewing the Traffic Summary report
The Traffic Summary report provides a percentage breakdown of the amount of TCP traffic going through the system. For details about setting ports to be monitored, see
About monitored ports.
The SteelHead automatically discovers all the ports in the system that have traffic. The discovered port and its label (if one exists) are added to the report. If a label doesn’t exist, an unknown label is added to the discovered port.
You can view optimization statistics for SaaS applications. This report lists the optimized traffic by SaaS application instead of by port number, and the ID for the SaaS application is listed in the Port column.
SaaS application statistics are not included with the overall statistics for port 443 and port 80.
When using a role-based management (RBM) user, ensure that the RBM user has at least Read-Only permissions for the Cloud Optimization role, or the user will not be able to view the SaaS application names.
To find the definition of the application ID that is listed in the Port column, open the Optimization > SaaS Accelerator page. The ID (for example, SFDC) and application name (for example, Salesforce.com) are listed in the Application ID and SaaS Application Control fields.
If you want to change the unknown label to a name representing the port, you must readd the port with a new label. All statistics for this new port label are preserved from the time the port was discovered.
The Traffic Summary report displays a maximum of 16 ports and pie slices for the traffic types comprising more than 0.005 percent of the total traffic (by destination port). When there are more than 16 ports, the report displays 15 individual ports and aggregates the remaining ports into the 16th slice. The 16th slice is always gray. Any ports aggregated into the 16th slice are also gray. Any traffic that comprises less than 0.005 percent of the total isn’t included in the Traffic Summary report, but is aggregated into the Bandwidth Optimization report.
The Traffic Summary report provides these statistics that describe data activity for the application and the time period you specify:
Port
Displays the TCP/IP port number and application for each row of statistics. For SaaS applications, the word “Custom” and the application name is displayed instead of a port number.
Reduction
Displays the amount of application data reduction.
LAN Data
Displays the amount of application data on the LAN.
WAN Data
Displays the amount of application data on the WAN.
Traffic %
Calculates LAN-side data to indicate the percentage of the total traffic each port represents.
The Traffic Summary report answers these questions:
• How much data reduction has occurred?
• What was the percentage of the total traffic for each port?
• Which SaaS applications are being optimized? (RiOS 9.5 and later)
The Riverbed system reports on performance for periods up to one month. Due to performance and disk space considerations, the display granularity decreases with time passed since the data was sampled. The Traffic Summary report displays these data granularities:
• Last 1 hour's worth of data is available at 10-second granularity.
• Last 1 day's worth of data is available at 5-minute granularity.
• Last 1 week's worth of data is available at 1-hour granularity.
• Last 1 month's worth of data is available at 2-hour granularity.
You view the Traffic Summary report under Reports > Networking: Traffic Summary.
Traffic Summary page showing port numbers
Traffic Summary page showing SaaS applications
5. Use the controls to customize the report as described in this table.
These options are available to customize the report:
Period
Specifies a period of Last Minute, Last 5 Minutes, Last Hour, Last Day, Last Week, Last Month, or Custom from the drop-down list. For Custom, enter the Start Time and End Time and click Go. Use this format: yyyy/mm/dd hh:mm:ss
Type
Specifies a traffic type of Optimized, Pass Through, or Both from the drop-down list.
Traffic
Specifies a traffic direction from the drop-down list:
• Bi-Directional—traffic flowing in both directions
• WAN-to-LAN—inbound traffic flowing from the WAN to the LAN
• LAN-to-WAN—outbound traffic flowing from the LAN to the WAN.
Refresh
Specifies a refresh rate from the drop-down list:
• To refresh the report every 10 seconds, select 10 seconds.
• To refresh the report every 30 seconds, select 30 seconds.
• To refresh the report every 60 seconds, select 60 seconds.
• To turn refresh off, click Off.
Go displays the report.
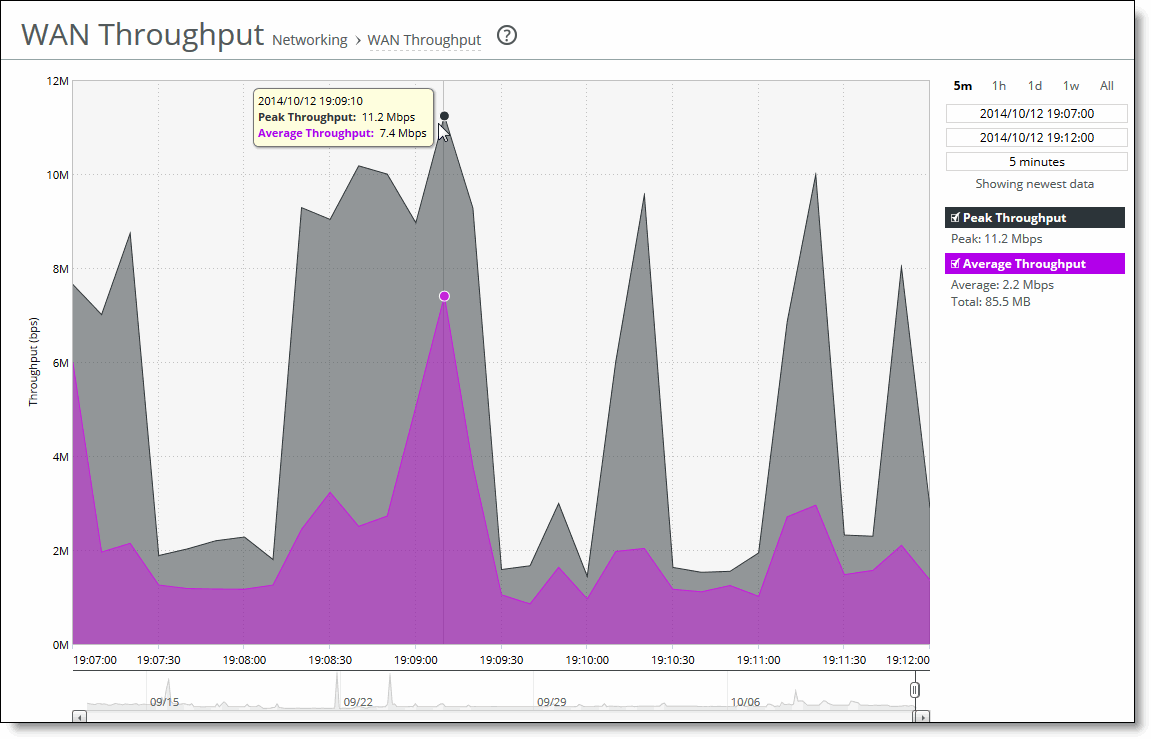
Viewing the WAN Throughput report
The WAN Throughput report summarizes the WAN throughput for the time period specified. In standard in-path and virtual in-path deployments, the throughput is an aggregation of all data the system transmits out of all WAN interfaces. In a server-side out-of-path configuration, the report summarizes all data the system transmits out of the primary interface. You must choose Networking > Network Services: Flow Statistics and enable WAN Throughput Statistics to view data in this report. WAN throughput statistics are enabled by default.
The WAN Throughput report doesn’t include any traffic that is hardware bypassed, either by an in-path interface in hardware bypass, or the portion of traffic that is bypassed by hardware-assist rules on supported Fiber 10 Gigabit-Ethernet in-path cards.
The WAN Throughput report includes a WAN link throughput graph that provides these statistics describing data activity for the time period you specify:
Peak Throughput
Displays the peak data activity.
Average Throughput
Displays the average and total throughput. RiOS calculates the WAN average at each data point by taking the number of bytes transferred, converting that to bits, and then dividing by the granularity. For instance, if the system reports 100 bytes for a data point with a 10-second granularity, RiOS calculates:
100 bytes * 8 bits/byte / 10 seconds = 80 bps
This calculation means that 80 bps was the average throughput over that 10-second period.
The total throughput shows the data amount transferred during the displayed time interval.
The average that appears below the Average Throughput is an average of all displayed averages.
The navigator shadows the Peak throughput series.
In some configurations, RiOS transmits LAN traffic out of WAN interfaces: for example, virtual in-path deployments and deployments using the default gateway on the WAN side without simplified routing. In such deployments, you can configure subnet side rules to decide which channel traffic isn’t destined for the WAN.
The WAN Throughput report answers these questions:
• What was the average WAN throughput?
• What was the peak WAN throughput?
Mouse over a specific data point to see what the y values and exact time stamp were in relation to peaks.
The Riverbed system reports on performance for periods up to one month. Due to performance and disk space considerations, the display granularity decreases with time passed since the data was sampled with a granularity of 5 minutes for the day, 1 hour for the last week, and 2 hours for the rest of the month.
You view the WAN Throughput report under Reports > Optimization: WAN Throughput.
WAN Throughput page
This option is available to customize the report:
Time interval
Specifies a report time interval of 5 minutes (5m), 1 hour (1h), 1 day (1d), 1 week (1w), All, or type a custom date. All includes statistics for the last 30 days.
Time intervals that don’t apply to a particular report are dimmed.
For a custom time interval, enter the start time and end time using this format: yyyy/mm/dd hh:mm:ss
Because the system aggregates data on the hour, request hourly time intervals. For example, setting a time interval to 08:30:00 to 09:30:00 from 2 days ago doesn’t create a data display, whereas setting a time interval to 08:00:00 to 09:00:00 from 2 days ago will display data.
When you request a custom time interval to view data beyond the aggregated granularity, the data is not visible because the system is no longer storing the data. For example, these custom time intervals don’t return data because the system automatically aggregates data older than 7 days into 2-hour data points:
• Setting a 1-hour time period that occurred 2 weeks ago.
• Setting a 75-minute time period that occurred more than 1 week ago.
You can view the newest data and see data points as they’re added to the chart dynamically. To display the newest data, click Show newest data.
Viewing the Application Statistics report
The Application Statistics report provides a tabular summary or a graph of the traffic flowing through a SteelHead for the time period specified. You can view up to seven applications in a stacked view.
This report does not include IPv6 traffic, and it is not applicable to cloud appliances.
You must enable application visibility on the Networking > Network Services: Flow Statistics page before the Application Statistics report can gather and display statistics.
RiOS collects application statistics for all data transmitted out of the WAN and primary interfaces and commits samples every 5 minutes. Let the system collect statistics awhile to view the most meaningful data display. The Application Statistics report includes these statistics for each listed application, traffic direction, and the time period you specify:
Average bps
Displays the average data activity in all flows of an application in bits per second. The minimum sample granularity is 5 minutes.
Per Flow Average bps
Displays the average trended throughput in all traffic flows of an application in bits per second. This data series indicates how bandwidth intensive an application is per user or flow.
RiOS calculates the WAN average at each data point by taking the number of bytes transferred, converting that to bits, and then dividing by the granularity.
For instance, if the system reports 100 bytes for a data point with a 10-second granularity, RiOS calculates:
100 bytes * 8 bits/byte / 10 seconds = 80 bps
This calculation means that 80 bps was the average throughput over that 10-second period.
Peak bps
Displays the peak data activity in bits per second. For larger granularity data points, this represents the largest 5 minute average within. For 5 minutes, this is the same as the average.
Per flow Peak bps
Displays the peak trended data activity per traffic flow in bits per second. This peak is the largest per flow 5-minute bps within a larger sample.
This report displays applications within their protocol hierarchy. For example, Facebook appears as TCP > HTTP > Facebook.
This report lists unrecognized applications by their server port. For example, TCP > Unknown (port 5001).
The Application Statistics report answers this question:
• How much bandwidth is a particular application using?
While viewing the application statistics in a graph, mouse over a specific data point to see what the y values and exact time stamp were in relation to peaks.
The Riverbed system reports on performance for periods up to one month. Due to performance and disk space considerations, the display granularity decreases with time passed since the data was sampled. The data is collected at a 5-minute granularity for the entire month.
You view the Application Statistics report under Reports > Networking: Application Statistics
Click View graphs of the applications selected below to switch from a tabular display to a graph.
Application Statistics page
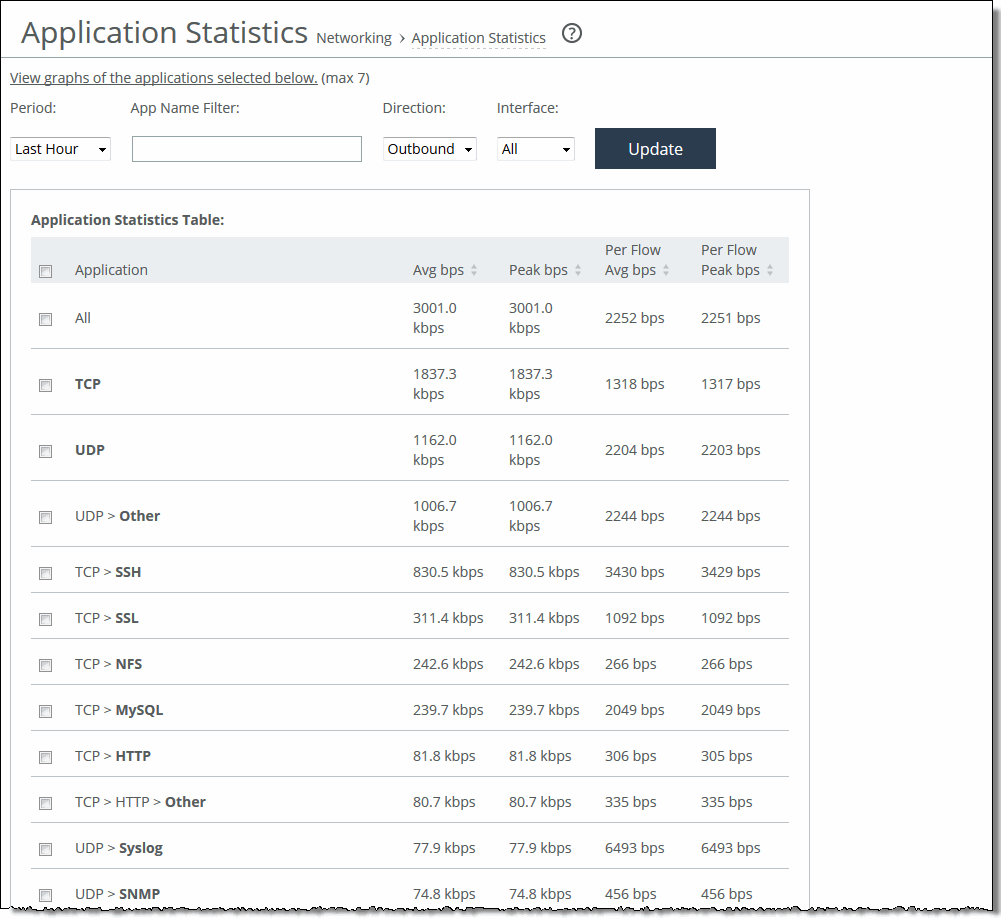
These options are available to customize the report:
Period
Specifies a period of Last 5 Minutes, Last Hour, Last Day, Last Week, Last Month, or Custom from the drop-down list. For Custom, enter the Start Time and End Time and click Go. Use this format:
yyyy/mm/dd hh:mm:ss
App Name Filter
Specifies a protocol or application name (for example, TCP, LDAP, SharePoint) to show only the selection. You can select only one filter at a time. For example, if the report is filtering on UDP and you click TCP, the report displays all TCP entries and clears the UDP filter.
Direction
Specifies the traffic direction from the drop-down list. The default is outbound LAN > WAN traffic.
Interface
Specifies an interface from the drop-down list. The default is all WAN and primary interfaces.
Update
Updates the chart without updating the application selection.
Viewing the Application Visibility report
The Application Visibility report summarizes the traffic flowing through a SteelHead classified by the application for the time period specified. This report provides application level visibility into layer-7 and shows the application dynamics for pass-through and optimized traffic.
You must enable application visibility on the Networking > Network Services: Flow Statistics page before the Application Visibility report can gather and display statistics. Application Visibility is enabled by default. For details, see
About flow statistics. This report doesn’t include IPv6 traffic.
The Application Visibility report includes these statistics for each listed application, traffic direction, and the time period you specify:
App Throughput
Displays the throughput for all traffic flows in bits per second. The minimum sample granularity is 5 minutes.
• Throughput Peak—Mouse over the data series to display the peak data activity in bits per second. For larger granularity data points, this represents the largest 5 minute average within. For 5 minutes, this is the same as the average.
• Throughput Average—Mouse over the data series to display the average trended throughput for all traffic flows in kbps.
Per-Flow Throughput
Displays the throughput per traffic flow in bits-per-second.
• Per-Flow Peak—Mouse over the data series to display the peak trended data activity per traffic flow in bits per second. This peak is the largest per flow 5-minute bps within a larger sample.
• Per-Flow Average—Mouse over the data series to display the average trended throughput in all traffic flows of an application in bits per second. This data series indicates how bandwidth-intensive an application is per user or flow.
RiOS calculates the WAN average at each data point by taking the number of bytes transferred, converting that to bits, and then dividing by the granularity.
For instance, if the system reports 100 bytes for a data point with a 10-second granularity, RiOS calculates:
100 bytes * 8 bits/byte / 10 seconds = 80 bps
This calculation means that 80 bps was the average throughput over that 10-second period.
The navigator shadows the Per-flow throughput series.
The Application Visibility report answers this question:
• How much bandwidth is a particular application using?
• What’s the inbound (WAN to LAN) and outbound (LAN to WAN) throughput for each application for a given time range?
• What are the average and peak throughputs for all flows of an application, or per flow?
Mouse over a specific data point to see what the y values and exact time stamp were in relation to peaks.
The Riverbed system reports on performance for periods up to one month. Due to performance and disk space considerations, the display granularity decreases with time passed since the data was sampled. The data is collected at a 5-minute granularity for the entire month.
You view the Application Visibility report under Reports > Networking: Application Visibility.
Application Visibility page
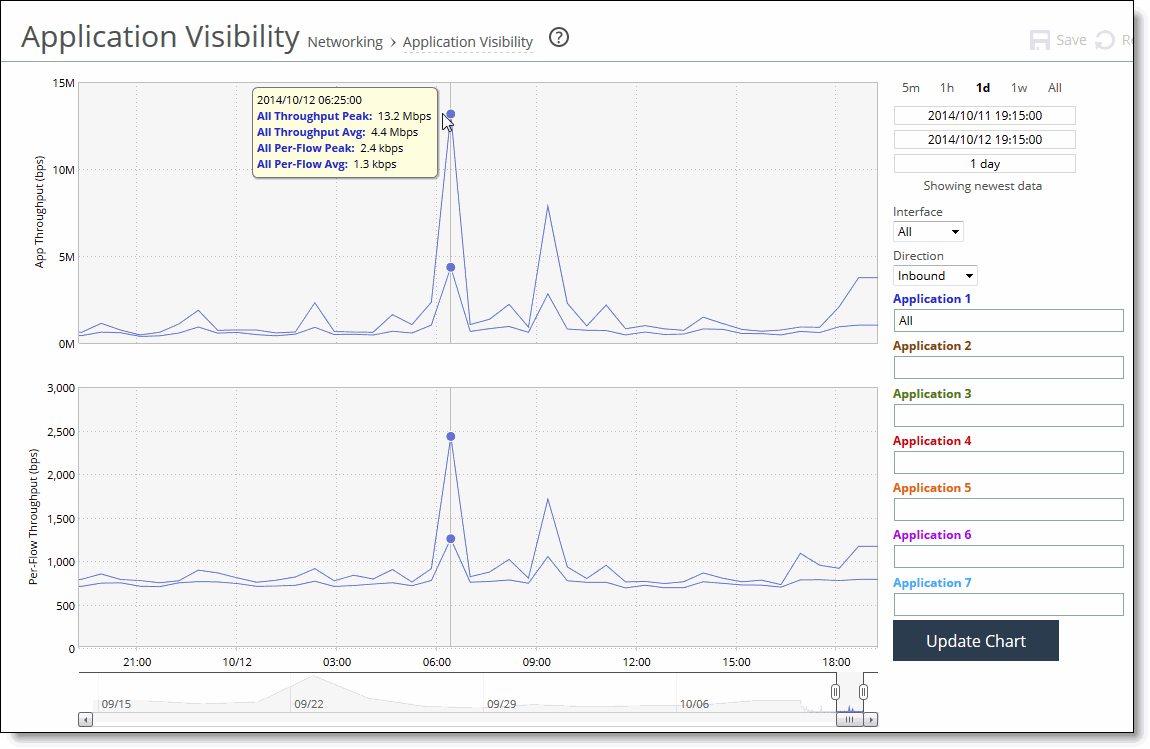
These options are available to customize the report:
Time interval
Specifies a report time interval of 5 minutes (5m), 1 hour (1h), 1 day (1d), 1 week (1w), All, or type a custom date. All includes statistics for the last 30 days. Time intervals that don’t apply to a particular report are dimmed. For a custom time interval, enter the start time and end time using this format: yyyy/mm/dd hh:mm:ss
You can view the newest data and see data points as they’re added to the chart dynamically. To display the newest data, click Show newest data.
Interface
Specifies an interface from the drop-down list. The default is all interfaces.
Direction
Specifies the traffic direction from the drop-down list. The default is outbound LAN > WAN traffic.
Application Name
Specifies the application name. Type the first characters in the application name. When the application name and definition appears, select it from the list. You can select up to seven applications.
Click Update Chart to update the chart without changing the application selection.
Viewing the Interface Counter report
The Interface Counters report summarizes the statistics for the interfaces. It also displays the IP address, speed, duplex, MAC address, and current status of each interface.
This report includes interfaces configured with IPv6 addresses.
For automatically negotiated speed and duplex settings, the Interface Counters report displays the speed at which they’re negotiated.
Interface statistics display the data accumulated since the last reboot.
The Interface Counters report displays these statistics:
Interface
• LAN—Displays statistics for the LAN interface.
• WAN—Displays statistics for the WAN interface.
• Primary—Displays statistics for the primary interface.
• Aux—Displays statistics for the auxiliary interface.
• Inpath—Displays statistics for the in-path interface.
IP
Displays the IP address (if application) for the interface.
Ethernet
Displays the MAC address, speed, and duplex setting for interface. Use this information to troubleshoot speed and duplex problems. Make sure the speed for the SteelHead matches the WAN or LAN interfaces. We recommend setting the speed to 100 and duplex to full.
Link
Displays true or false to indicate whether the link is up or down.
Receive Packets
Displays the total number of packets, packets discarded, errors encountered, packets overrun, frames sent, and multicast packets sent.
Transmit Packets
Displays the total number of packets, packets discarded, errors encountered, packets overrun, carriers used, and collisions encountered.
If you have multiple two-port or four-port bypass cards installed, the Reports > Networking: Interface Counters report displays the interface statistics for each LAN and WAN port.
The Interface Counters report answers these questions:
• How many packets is the appliance transmitting or receiving?
• Are there any errors occurring during the packet transmissions?
• What’s the current status of the interface?
You view interface counters under Reports > Networking: Interface Counters.
Interface Counters page
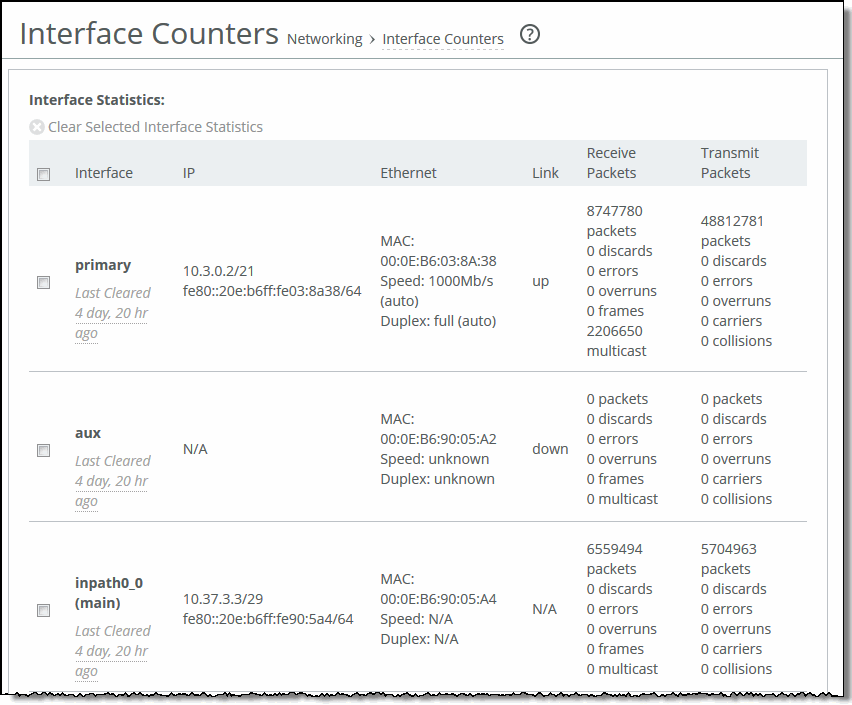
To print the report, choose File > Print in your web browser to open the Print dialog box.
Viewing the TCP Statistics report
The TCP Statistics report summarizes TCP statistics for the appliance.
The TCP Statistics report contains these statistics that summarize TCP activity:
Packets Received
Displays the total packets received.
Packets Sent
Displays the total TCP packets sent.
Packets Retransmitted
Displays the total TCP packets retransmitted.
Packets Fast Retransmitted
Displays the total TCP packets fast retransmitted. Fast retransmit is an enhancement to TCP which reduces the time a sender waits before retransmitting a lost segment. If an acknowledgment isn’t received for a particular segment within a specified time (a function of the estimated round-trip delay time), the sender assumes the segment was lost in the network, and retransmits the segment.
Time-outs
Displays the number of time-outs.
Loss Events
Displays the total number of loss events.
The TCP Statistics report answers these questions:
• How many TCP packets have been sent and received?
• How many TCP packets have been retransmitted?
• How many time-outs have occurred?
• How many loss events have occurred?
You view the TCP Statistics report under Reports > Networking: TCP Statistics.
To print the report, choose File > Print in your web browser to open the Print dialog box.
Viewing the Latency Detected Peers report
The Latency Detected Peers report displays the connections that are optimized and the connections that are passed through due to latency detection for peers of the appliance.
You can view the following information about peer appliances with low-latency connections:
Peer IP / Hostname
Displays the hostname or IP address of the latency-detected peer appliance.
Latency
Displays the amount of latency between the selected appliance and the peer in milliseconds.
Cumulative Optimized Connections
Displays the number of optimized connections between the selected appliance and the peer.
Cumulative Passthrough Connections
Displays the number of passthrough connections between the selected appliance and the peer.
Current Peer State
Displays the state of the peer (Optimized or Passthrough) based on the current latency between the selected appliance and the peer.
The Latency Detected Peers report answers these questions:
• What latency is detected between peers?
• How many optimized connections exist for those peers?
• How many passthrough connections exist for those peers?
• What is the current peer status?
You view the Latency Detected Peers report under Reports > Networking: Latency Detected Peers.
To print the report, choose File > Print in your web browser to open the Print dialog box.
Viewing the Optimized Throughput report
The Optimized Throughput report summarizes the throughput for the port, traffic direction, and time period specified. You can view optimization statistics for SaaS applications. This report lists the optimized traffic by SaaS application instead of by port number, and the ID for the SaaS application is listed in the Port column.
SaaS application statistics are not included with the overall statistics for port 443 and port 80.
When using a role-based management (RBM) user, ensure that the RBM user has at least Read-Only permissions for the Cloud Optimization role, or the user will not be able to view the SaaS application names.
To find the definition of the application ID that is listed in the Port column, open the Optimization > SaaS Accelerator page. The ID (for example, SFDC) and application name (for example, Salesforce.com) are listed in the Application ID and SaaS Application Control fields.
The Optimized Throughput report includes LAN and WAN link throughput graphs that include these statistics describing data activity for the port, traffic direction, and the time period you specify:
LAN Peak
Displays the peak data activity.
LAN P95
Displays the 95th percentile for data activity. The 95th percentile is calculated by taking the peak of the lower 95 percent of inbound and outbound throughput samples.
LAN Average
Displays the average throughput.
RiOS calculates the LAN average at each data point by taking the number of bytes transferred, converting that to bits, and then dividing by the granularity.
For instance, if the system reports 100 bytes for a data point with a 10-second granularity, RiOS calculates:
100 bytes * 8 bits/byte / 10 seconds = 80 bps
This calculation means that 80 bps was the average throughput over that 10-second period.
The average that appears below the LAN Average is an average of all displayed averages.
WAN Peak
Displays the peak data activity.
WAN P95
Displays the 95th percentile for data activity. The 95th percentile is calculated by taking the peak of the lower 95 percent of inbound and outbound throughput samples.
WAN Average
Displays the average throughput. RiOS calculates the WAN average at each data point by taking the number of bytes transferred, converting that to bits, and then dividing by the granularity. For instance, if the system reports 100 bytes for a data point with a 10-second granularity, RiOS calculates:
100 bytes * 8 bits/byte / 10 seconds = 80 bps
This calculation means that 80 bps was the average throughput over that 10-second period.
The average that appears below the WAN Average is an average of all displayed averages.
The navigator shadows the WAN Peak series.
The Optimized Throughput report answers these questions:
• What was the average WAN and LAN throughput?
• What was the peak WAN and LAN throughput?
• Which SaaS applications are being optimized? (RiOS 9.5 and later)
Mouse over a specific data point to see what the y values and exact time stamp were in relation to peaks.
The system reports on performance for periods up to one month. However, due to performance and disk space considerations, data representation in reports for periods longer than the last 5 minutes are interpolated from aggregate data points. The Optimized Throughput report displays these data granularities:
• Last 1 hour's worth of data is available at 10-second granularity.
• Last 1 day's worth of data is available at 5-minute granularity.
• Last 1 week's worth of data is available at 1-hour granularity.
• Last 1 month's worth of data is available at 2-hour granularity.
You view the Optimized Throughput report under Reports > Optimization: Optimized Throughput.
Optimized Throughput page
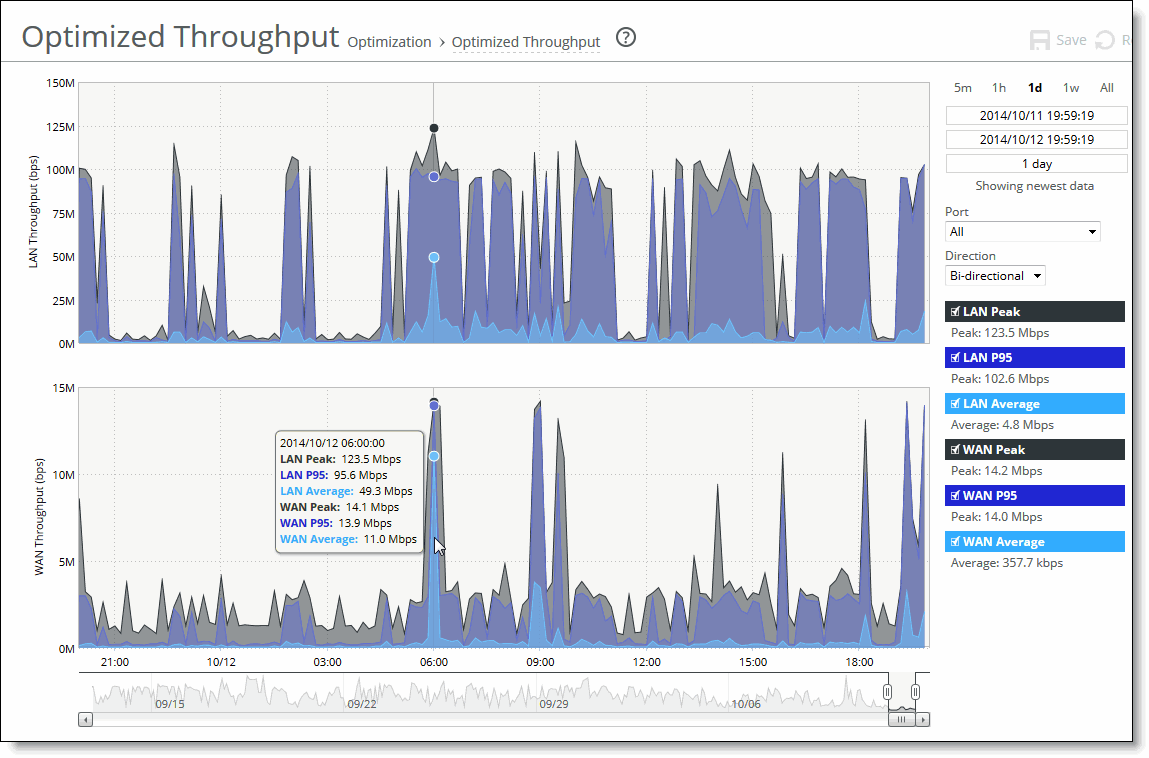
Optimized Throughput page with drop-down list showing SaaS applications
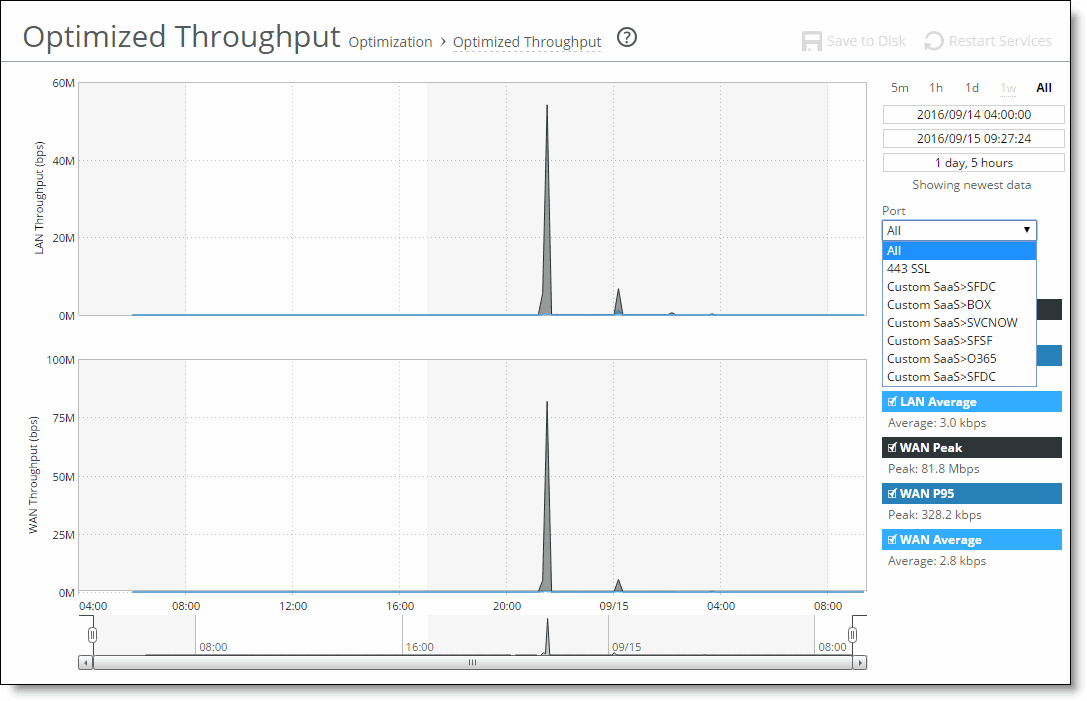
These options are available to customize the report:
Time interval
Specifies a report time interval of 5 minutes (5m), 1 hour (1h), 1 day (1d), 1 week (1w), All, or type a custom date. All includes statistics for the last 30 days.
Time intervals that don’t apply to a particular report are dimmed.
For a custom time interval, enter the start time and end time using this format: yyyy/mm/dd hh:mm:ss
Because the system aggregates data on the hour, request hourly time intervals. For example, setting a time interval to 08:30:00 to 09:30:00 from 2 days ago doesn’t create a data display, whereas setting a time interval to 08:00:00 to 09:00:00 from 2 days ago will display data.
When you request a custom time interval to view data beyond the aggregated granularity, the data is not visible because the system is no longer storing the data. For example, these custom time intervals don’t return data because the system automatically aggregates data older than 7 days into 2-hour data points:
• Setting a 1-hour time period that occurred 2 weeks ago.
• Setting a 75-minute time period that occurred more than 1 week ago.
You can view the newest data and see data points as they’re added to the chart dynamically. To display the newest data, click Show newest data.
Direction
Specifies a traffic direction from the drop-down list:
• Bi-Directional—traffic flowing in both directions
• WAN to LAN—inbound traffic flowing from the WAN to the LAN
• LAN to WAN—outbound traffic flowing from the LAN to the WAN
Port
Specifies a port or All to display all of the TCP ports on which the SteelHead has seen traffic. The list appends the port name to the number where available.
If your SteelHead appliance is SaaS-enabled, select the SaaS application from the drop-down list. To see the definition of the SaaS application (for example, SFDC in the drop-down list refers to Salesforce.com), log in to the Cloud Portal. The application names and acronyms are listed in the SaaS Services Summary pane.
Viewing the Bandwidth Optimization report
The Bandwidth Optimization report summarizes the overall inbound and outbound bandwidth improvements on your network. You can create reports according to the time period, port, and traffic direction of your choice.
Starting with RiOS 9.5, you can view optimization statistics for SaaS applications. This report lists the optimized traffic by SaaS application instead of by port number, and the ID for the SaaS application is listed in the Port column.
SaaS application statistics are not included with the overall statistics for port 443 and port 80.
When using a role-based management (RBM) user, ensure that the RBM user has at least Read-Only permissions for the Cloud Optimization role, or the user will not be able to view the SaaS application names.
To find the definition of the application ID that is listed in the Port column, open the Optimization > SaaS Accelerator page. The ID (for example, SFDC) and application name (for example, Salesforce.com) are listed in the Application ID and SaaS Application Control fields.
The Bandwidth Optimization report includes these statistics describing bandwidth activity for the time period you specify:
Data Reduction %
Displays the peak and total decrease of data transmitted over the WAN, according to this calculation:
(Data In – Data Out)/(Data In)
which displays the capacity increase x-factor below the peak and total data reduction percentages.
WAN and LAN Throughput
Depending on which direction you select, specifies one of these traffic flows:
• Bi-Directional—traffic flowing in both directions
• WAN-to-LAN—inbound traffic flowing from the WAN to the LAN
• LAN-to-WAN—outbound traffic flowing from the LAN to the WAN
The navigator shadows the data reduction series.
The Bandwidth Optimization report answers these questions:
• How much data reduction has occurred?
• How much data was removed from the WAN link?
• How much data was sent/received on the LAN/WAN ports?
• Which SaaS applications are being optimized? (RiOS 9.5 and later)
Mouse over a specific data point to see what the y values and exact time stamp were in relation to peaks.
The Riverbed system reports on performance for periods up to one month. Due to performance and disk space considerations, the display granularity decreases with time passed since the data was sampled with a granularity of 5 minutes for the day, 1 hour for the last week, and 2 hours for the rest of the month.
You view the Bandwidth Optimization report under Reports > Optimization: Bandwidth Optimization.
Bandwidth Optimization page
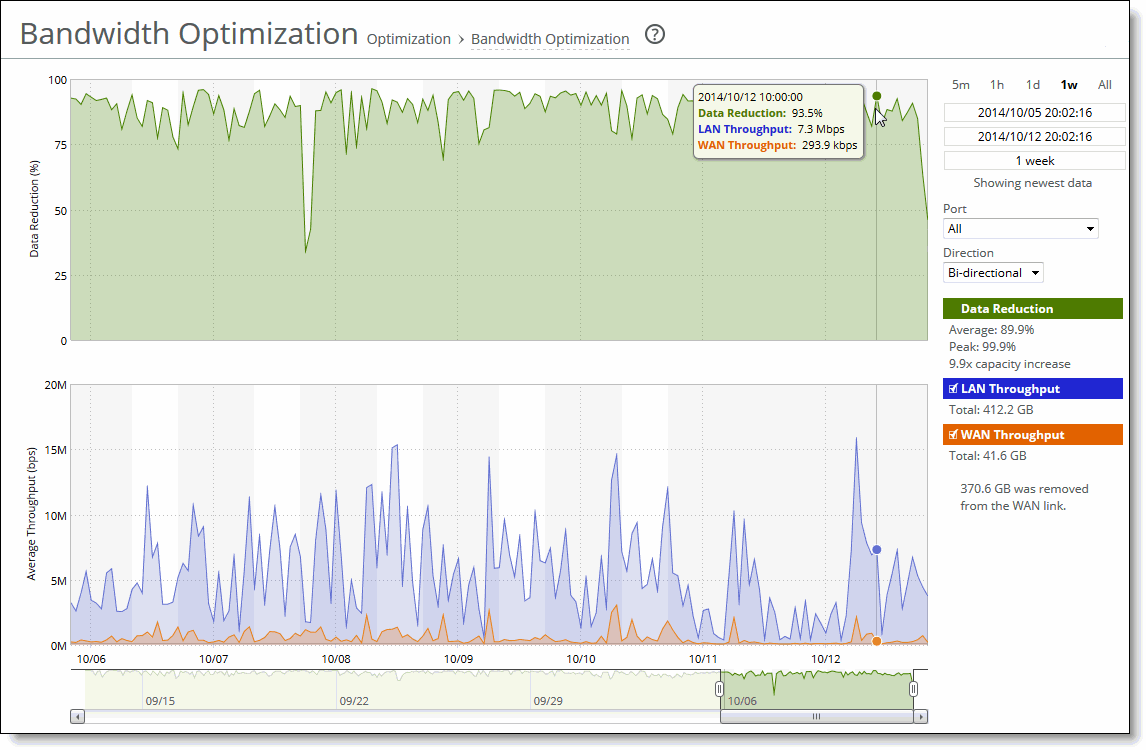
Bandwidth Optimization page with drop-down list showing SaaS applications
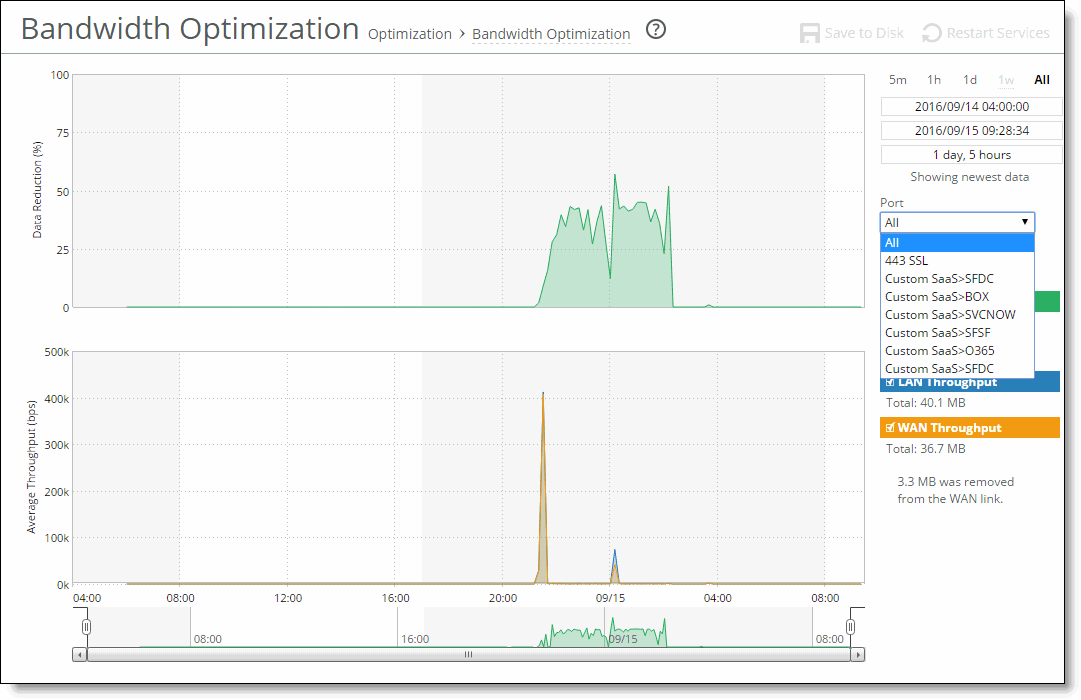
These options are available to customize the report:
Time interval
Specifies a report time interval of 5 minutes (5m), 1 hour (1h), 1 week (1w), All, or type a custom date. All includes statistics for the past 30 days. Time intervals that don’t apply to a particular report are dimmed. For a custom time interval, enter the start time and end time using this format:
yyyy/mm/dd hh:mm:ss
Because the system aggregates data on the hour, request hourly time intervals. For example, setting a time interval to 08:30:00 to 09:30:00 from 2 days ago doesn’t create a data display, whereas setting a time interval to 08:00:00 to 09:00:00 from 2 days ago will display data.
When you request a custom time interval to view data beyond the aggregated granularity, the data is not visible because the system is no longer storing the data. For example, these custom time intervals don’t return data because the system automatically aggregates data older than 7 days into 2-hour data points:
• Setting a 1-hour time period that occurred 2 weeks ago.
• Setting a 75-minute time period that occurred more than 1 week ago.
You can view the newest data and see data points as they’re added to the chart dynamically. To display the newest data, click Show newest data.
Port
Specifies a port or All to select all ports from the drop-down list.
If your SteelHead appliance is SaaS-enabled, select the SaaS application from the drop-down list. To see the definition of the SaaS application (for example, SFDC in the drop-down list refers to Salesforce.com), log in to the Cloud Portal. The application names and acronyms are listed in the SaaS Services Summary pane.
Direction
Specifies a traffic direction (Bi-Directional, WAN to LAN, or LAN to WAN) from the drop-down list.
Viewing the Peer Optimization report
The Peer Optimization report summarizes the statistics tracked for each peer SteelHead. This report isolates measurements to a specific SteelHead peer or can show an aggregate of all peers.
You view the Peer Optimization report under Reports > Optimization: Peer Optimization.
Peer Optimization page
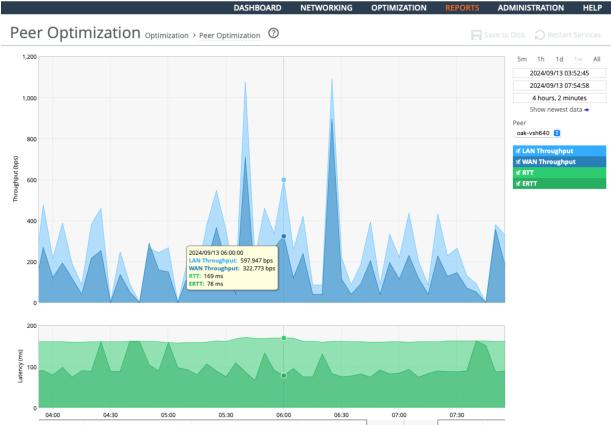
These options are available to customize the report:
Time Interval
Specifies a report time interval of 5 minutes (5m), 1 hour (1h), 1 week (1w), All, or type a custom date. All includes statistics for the past 30 days. Time intervals that don’t apply to a particular report are dimmed. For a custom time interval, enter the start time and end time using this format:
yyyy/mm/dd hh:mm:ss
Peer
Selection can range from an individual peer to an aggregate of all peer SteelHeads. The available selections are composed from the individual peers that have statistics recorded.
After a system restart, the hostnames of connected peers may display as “Peer-nnn” for a short amount of time before the hostnames refresh.
LAN/WAN Throughput
Shows LAN and WAN measurements of connected peers.
RTT (Round-trip Time)
Is the value computed during the inner channel TCP setup. It reflects the “ping” time of the inner channel at that time.
ERTT (“Effective” RTT)
Is a derived value constructed to present a time based measurement reflecting how the data reduction provided by a SteelHead can translate into user time savings. The number divides the measured RTT by the data reduction factor, like so: ERTT = RTT * (WAN_Bytes/LAN_Bytes)
Viewing the Peers report
The Peers report summarizes the peer SteelHeads. You can view peer SteelHead Mobile appliances as well. The Peers report contains these statistics that summarize connection peer activity:
Name
Displays the name of the peer appliance.
IP Address
Displays the IP address of the peer appliance.
Model
Displays the appliance model.
Version
Displays the appliance version.
Licenses
Displays the current appliance licenses.
The report includes both connected and unconnected peers. The connected icon appears next to a connected peer. A dimmed icon indicates that the peer is disconnected.
The Peers report answers these questions:
• How many peers are connected to the SteelHead?
• How many peers are disconnected from the SteelHead?
You view the Peers report under Reports > Optimization: Peers.
To view only connected peers, select the Hide Disconnected Peers check box. To view only SteelHead peers and hide the SteelHead Mobile peers, select the Hide SteelHead Mobile Controller Peers check box.
Select a report column heading to sort the column in ascending or descending order.
To open the Management Console for a peer, click the peer name or IP address.
Peers page
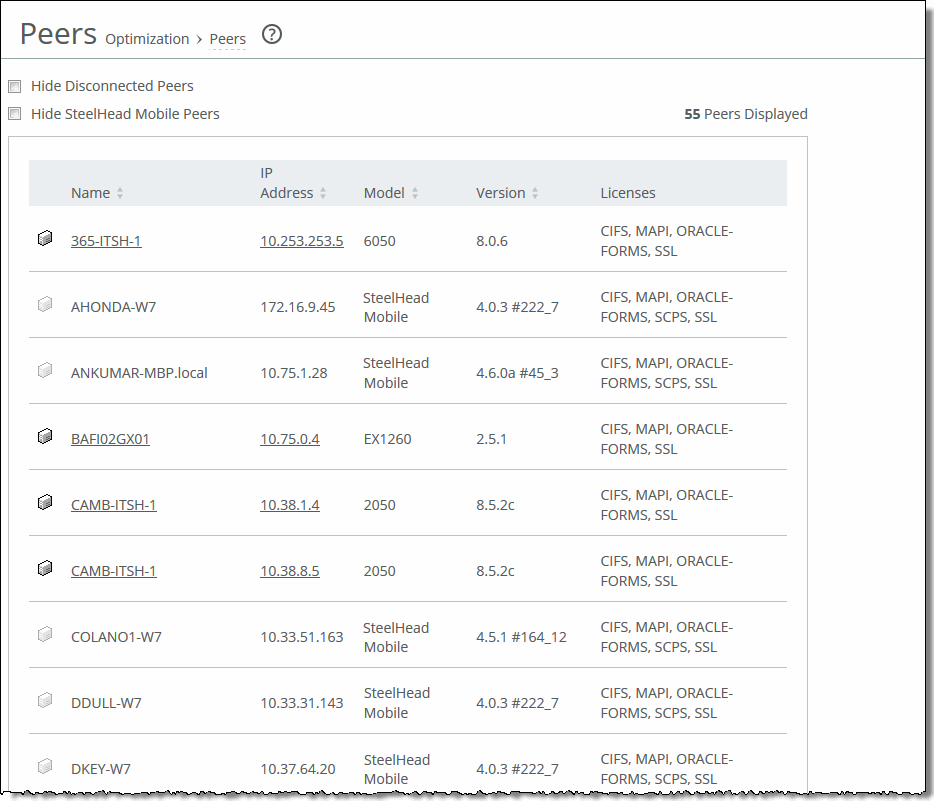
To print the report, choose File > Print in your web browser to open the Print dialog box.
Viewing the NFS report
The NFS report shows the rates of responses for NFS optimizations for the time period specified. The NFS report contains these statistics that summarize NFS activity:
Local Response Rate
Displays the number of NFS calls that were responded to locally.
Remote Response Rate
Displays the number of NFS calls that were responded to remotely (that is, calls that traversed the WAN to the NFS server).
Delayed Response Rate
Displays the delayed calls that were responded to locally but not immediately (for example, reads that were delayed while a read ahead was occurring and that were responded to from the data in the read ahead).
The NFS report answers these questions:
• How many NFS calls were answered locally and remotely?
• How many delayed responses occurred for NFS activity?
Mouse over a specific data point to see what the y values and exact time stamp were in relation to peaks.
The Riverbed system reports on performance for periods up to one month. Due to performance and disk space considerations, the display granularity decreases with time passed since the data was sampled. The data is collected at a 5-minute granularity for the entire month.
You view the NFS report under Reports > Optimization: NFS.
NFS page
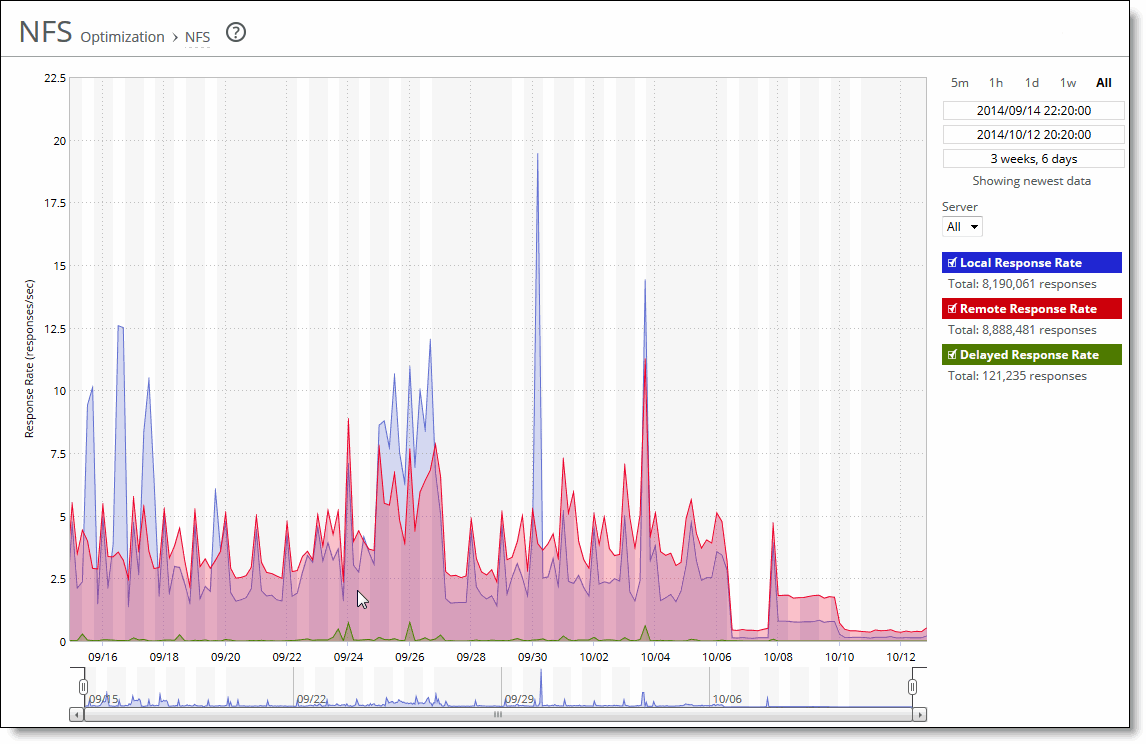
This option is available to customize the report:
Time interval
Specifies a report time interval of 5 minutes (5m), 1 hour (1h), 1 day (1d), 1 week (1w), All, or type a custom date. All includes statistics for the last 30 days. Time intervals that don’t apply to a particular report are dimmed. For a custom time interval, enter the start time and end time using this format: yyyy/mm/dd hh:mm:ss
You can view the newest data and see data points as they’re added to the chart dynamically. To display the newest data, click Show newest data.
Viewing the SSL report
The SSL report displays the SSL requested and established connection rate for the time period specified. The SSL report contains the information listed in this table.
The SSL report contains this information:
Requested Connection Rate
Displays the rate of requested SSL connections.
Established Connection Rate
Displays the rate established SSL connections.
The navigator shadows the requested connection rate series.
The SSL report answers these questions:
• What’s the rate of established SSL connections?
• What’s the rate of connection requested SSL connections?
Mouse over a specific data point to see what the y values and exact time stamp were in relation to peaks.
The Riverbed system reports on performance for periods up to one month. Due to performance and disk space considerations, the display granularity decreases with time passed since the data was sampled. The data is collected at a 5-minute granularity for the entire month.
You view the SSL report under Reports > Optimization: SSL.
SSL page
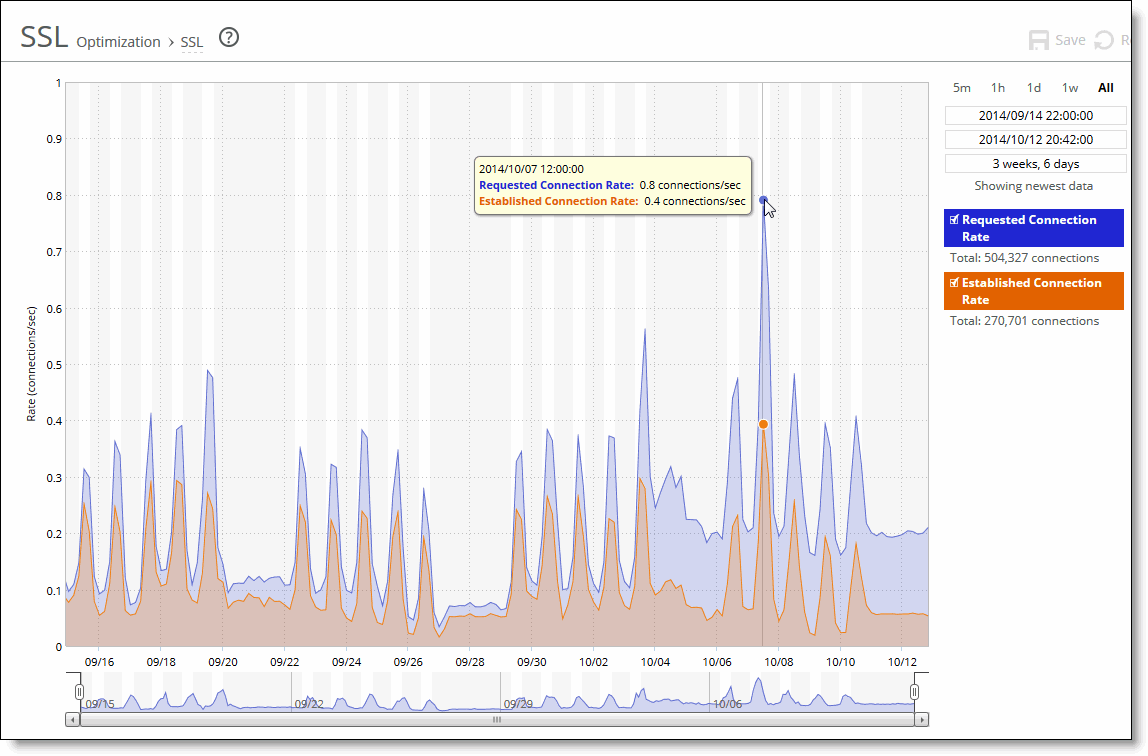
This option is available to customize the report:
Time interval
Specifies a report time interval of 5 minutes (5m), 1 hour (1h), 1 day (1d), 1 week (1w), All, or type a custom date. All includes statistics for the last 30 days. Time intervals that don’t apply to a particular report are dimmed. For a custom time interval, enter the start time and end time using this format: yyyy/mm/dd hh:mm:ss
You can view the newest data and see data points as they’re added to the chart dynamically. To display the newest data, click Show newest data.
Viewing the HTTP cache report
This report is available under Reports > Optimization: HTTP Cache.
HTTP cache report

This report shows the hit rates for cacheable requests, requests served from the cache, cacheable responses, and responses saved to cache. This report applies only to client-side appliances.
Viewing the Data Store Status report
The Data Store Status report summarizes the current status and state of the RiOS data store synchronization process.
If you have enabled data store synchronization, this report summarizes the state of the replication process. For details, see
About data store synchronization.
The Data Store Status report contains these statistics that summarize data store activity:
Synchronization Connection
Indicates the status of the connection between the synchronized SteelHeads.
Synchronization Catch-Up
Indicates the status of transferring data between the synchronized SteelHeads. Catch-Up is used for synchronizing data that was not synchronized during the Keep-Up phase.
Synchronization Keep-Up
Indicates the status of transferring new incoming data between the synchronized SteelHeads.
Data Store Percentage Used (Since Last Clear) displays the percentage of the RiOS data store that is used.
The Data Store Status report answers these questions:
• Is the synchronization connection active?
• Is the SteelHead in the catch-up or keep-up phase of RiOS data store synchronization?
• What percentage of the RiOS data store is unused?
You view the Data Store Status report under Reports > Optimization: Data Store Status.
These options are available to customize the reports:
Refresh
Specifies a refresh rate from the drop-down list:
• To refresh the report every 10 seconds, select 10 seconds.
• To refresh the report every 30 seconds, select 30 seconds.
• To refresh the report every 60 seconds, select 60 seconds.
• To disable refresh, click Off.
Go
Displays the report.
To print the report, choose File > Print in your web browser to open the Print dialog box.
Viewing the Data Store SDR-Adaptive report
The Data Store SDR-Adaptive report summarizes:
• how much adaptive compression is occurring in the RiOS data store using legacy mode. The report combines the percentages due to both local and remote adaptive compression (as signaled by the peers).
• the percentage of the traffic, in bytes, that is adapted to in-memory-only (or transient), compared to the total SDR traffic (SDR-adaptive mode).
You must enable the SDR-Adaptive setting before creating this report.
The report contains these statistics that summarize RiOS data store adaptive compression activity, shown as a percent of total SDR data:
Compression-Only Due To Disk/CPU Pressure
Displays the adaptive compression occurring due to disk/CPU pressure.
Compression-Only Due To In-Path Rule
Displays the adaptive compression occurring due to the in-path rule.
In-Memory SDR Due To Disk/CPU Pressure
Displays the in-memory SDR due to disk/CPU pressure.
In-Memory SDR Due To In-Path Rule
Displays the maximum in-memory SDR due to the in-path rule.
The navigator shadows the compression-only due to disk/CPU pressure series.
The Data Store SDR-Adaptive report answers this question:
• What’s the relative adaptive compression when SDR-Adaptive is enabled at various times of the day?
You view the Data Store SDR-Adaptive report under Reports > Optimization: Data Store SDR-Adaptive.
Data Store SDR-Adaptive page
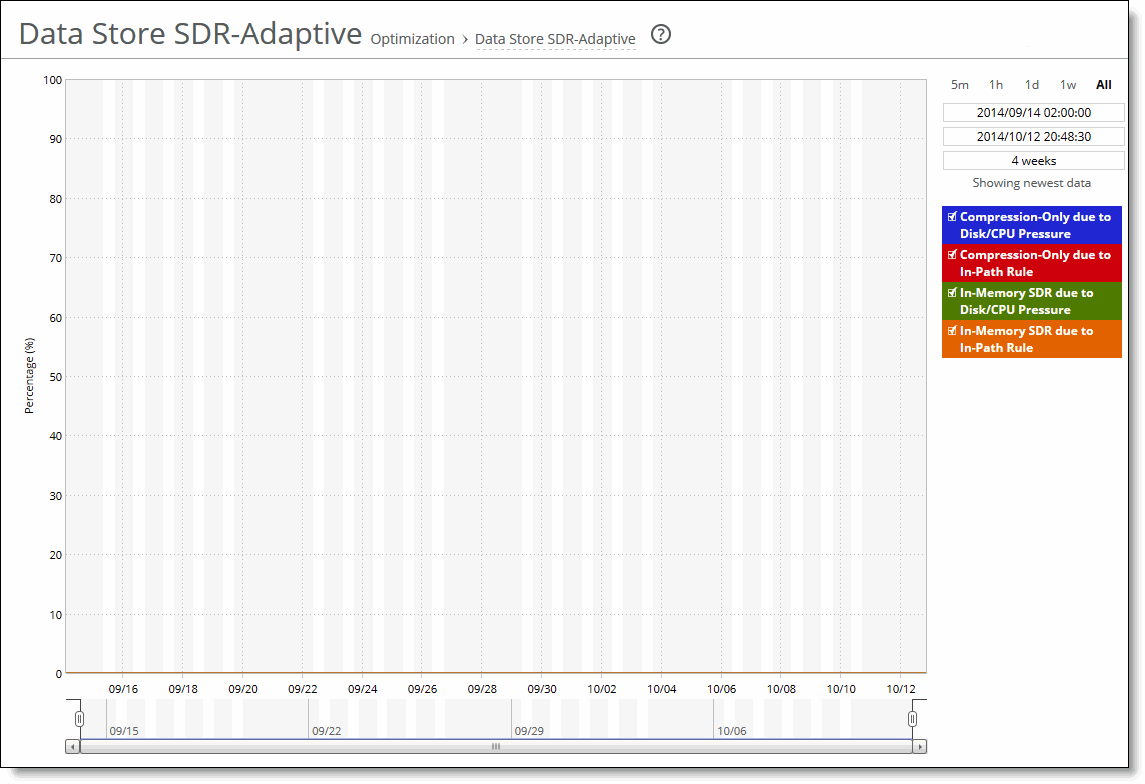
This option is available to customize the report:
Time interval
Specifies a report time interval of 5 minutes (5m), 1 hour (1h), 1 day (1d), 1 week (1w), All, or type a custom date. All includes statistics for the last 30 days. Time intervals that don’t apply to a particular report are dimmed. For a custom time interval, enter the start time and end time using this format: yyyy/mm/dd hh:mm:ss
You can view the newest data and see data points as they’re added to the chart dynamically. To display the newest data, click Show newest data.
Viewing the Data Store Disk Load report
The Data Store Disk Load report summarizes the RiOS data store disk load due to SDR only as related to the benchmarked capacity of the RiOS data store. Consider any value under 90 as healthy. Any value higher than a sustained load over 90 is considered high and might indicate disk pressure. A red line with shading appears at the top of the report to indicate the threshold of 90 and above. When a value is consistently higher than 90, contact Support for guidance on reconfiguring the RiOS data store to alleviate disk pressure. The report contains this statistic that summarizes the RiOS data store disk load:
Disk Load
Displays the RiOS data store disk load.
The Data Store Disk Load report answers these questions:
• Is there any indication of disk pressure?
• What’s the disk load at different times of the day?
You view the Data Store Disk Load report under Reports > Optimization: Data Store Disk Load.
Data Store Disk Load page
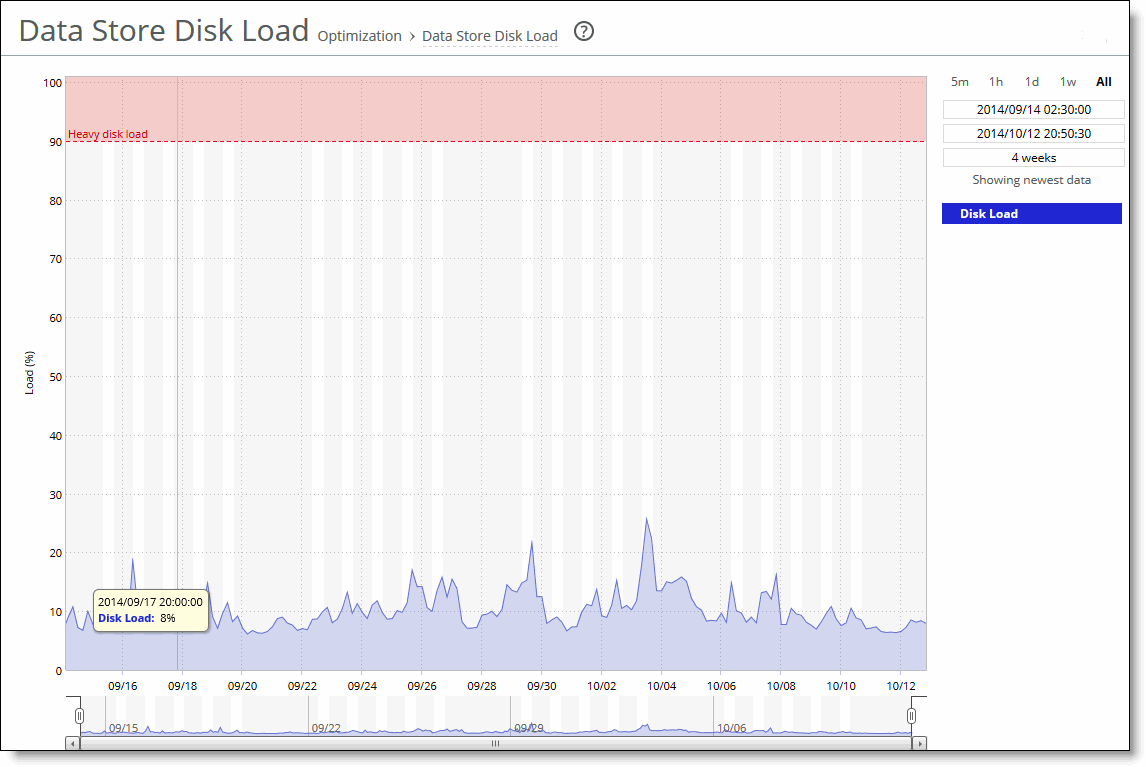
Viewing the Alarm Status report
The Alarm Status report provides status for the SteelHead alarms.
The SteelHead tracks key hardware and software metrics and alerts you of any potential problems so you can quickly discover and diagnose issues.
RiOS groups certain alarms into top-level categories, such as the SSL Settings alarm. When an alarm triggers, its parent expands to provide more information. For example, the System Disk Full top-level alarm aggregates over multiple partitions. If a specific partition is full, the System Disk Full alarm triggers and the Alarm Status report displays more information regarding which partition caused the alarm to trigger.
The health of an appliance falls into one of these states:
• Needs Attention—Accompanies a healthy state to indicate management-related issues not affecting the ability of the SteelHead to optimize traffic.
• Degraded—The SteelHead is optimizing traffic but the system has detected an issue.
• Admission Control—The SteelHead is optimizing traffic but has reached its connection limit.
• Critical—The SteelHead might or might not be optimizing traffic; you must address a critical issue.
The Alarm Status report includes this alarm information.
Alarm | SteelHead state | Reason |
|---|
Admission Control | Admission Control | • Connection Limit—Indicates that the system connection limit has been reached. Additional connections are passed through unoptimized. The alarm clears when the SteelHead moves out of this condition. • CPU—Indicates that the SteelHead has entered admission control due to high CPU use. During this event, the SteelHead continues to optimize existing connections, but passes through new connections without optimization. The alarm automatically clears when the CPU usage decreases. • MAPI—Indicates that the total number of MAPI optimized connections has exceeded the maximum admission control threshold. By default, the maximum admission control threshold is 85 percent of the total maximum optimized connection count for the client-side SteelHead. The SteelHead reserves the remaining 15 percent so the MAPI admission control doesn’t affect the other protocols. The 85 percent threshold is applied only to MAPI connections. The alarm automatically clears when the MAPI traffic decreases; however, it can take one minute for the alarm to clear. The system preemptively closes MAPI sessions to reduce the connection count in an attempt to bring the SteelHead out of admission control. RiOS closes MAPI sessions in this order: – MAPI prepopulation connections – MAPI sessions with the largest number of connections – MAPI sessions with the most idle connections – Most recently optimized MAPI sessions or the oldest MAPI session – MAPI sessions exceeding the memory threshold • Memory—Indicates that the appliance has entered admission control due to memory consumption. The appliance is optimizing traffic beyond its rated capability and is unable to handle the amount of traffic passing through the WAN link. During this event, the appliance continues to optimize existing connections, but new connections are passed through without optimization. No other action is necessary as the alarm automatically clears when the traffic decreases. • TCP—Indicates that the appliance has entered admission control due to high TCP memory use. During this event, the appliance continues to optimize existing connections, but new connections are passed through without optimization. The alarm automatically clears when the TCP memory pressure decreases. |
Asymmetric Routing | Needs Attention | Indicates that the system is experiencing asymmetric traffic. Indicates OK if the system isn’t experiencing asymmetric traffic. In addition, any asymmetric traffic is passed through, and the route appears in the Asymmetric Routing table. |
Connection Forwarding | Degraded | Indicates that the system has detected a problem with a connection-forwarding neighbor. The connection-forwarding alarms are inclusive of all connection-forwarding neighbors. For example, if a SteelHead has three neighbors, the alarm triggers if any one of the neighbors is in error. In the same way, the alarm clears only when all three neighbors are no longer in error. • Cluster Neighbor Incompatible—Indicates that a connection-forwarding neighbor in a Interceptor cluster has path selection enabled while path selection isn’t enabled on another appliance in the cluster. This alarm can also indicate that a connection-forwarding neighbor is running a RiOS version that is incompatible with IPv6. Neighbors must be running RiOS 8.5 or later. The SteelHead neighbors pass through IPv6 connections when this incompatibility is detected. • Multiple Interface—Indicates that the connection to an appliance in a connection forwarding cluster has been lost or disconnected due to a configuration incompatibility. • Single Interface—Indicates that the connection to a SteelHead connection-forwarding neighbor is lost. These issues trigger the single connection-forwarding alarm: – The connection-forwarding neighbor has not sent a keepalive message within the time-out period to the neighbor SteelHead(s), indicating that the connection has been lost. – The connection can’t be established with a connection-forwarding neighbor. – The connection has been closed by the connection-forwarding neighbor. – The connection has been lost with the connection-forwarding neighbor due to an error. – The connection has been lost because requests have not been acknowledged by a connection-forwarding neighbor within the set threshold. – The SteelHead has timed out while waiting for an initialization message from a connection-forwarding neighbor. – The amount of latency between connection-forwarding neighbors has exceeded the specified threshold. |
CPU Utilization | Degraded | Indicates that the system has reached the CPU threshold for any of the CPUs in the SteelHead. If the system has reached the CPU threshold, check your settings. For details, see About alarm settings. If your alarm thresholds are correct, reboot the SteelHead. For details, see Viewing system permissions. Note: If more than 100 MB of data is moved through a SteelHead while performing PFS synchronization, the CPU utilization might become high and result in a CPU alarm. This CPU alarm isn’t cause for concern. |
Data Store | Critical | • Corruption—Indicates that the RiOS data store is corrupt or has become incompatible with the current configuration. • Data Store Clean Required—Indicates that you must clear the RiOS data store. To clear the data store, choose Administration > Maintenance: Services and select the Clear Data Store check box before restarting the appliance. Clearing the data store degrades performance until the system repopulates the data. • Encryption Level Mismatch—Indicates a RiOS data store error such as an encryption, header, or format error. • Synchronization Error—Indicates that the RiOS data store synchronization between two SteelHeads has been disrupted and the RiOS data stores are no longer synchronized. For details, see About data store synchronization. Resetting the Data Store alarm If a data store alarm was caused by an unintended change to the configuration, you can change the configuration to match the previous RiOS data store settings, and then restart the service without clearing the data store to reset the alarm. Typical configuration changes that require a restart with a clear RiOS data store are enabling the extended peer table or changing the data store encryption type. For details, see About Peering, Autodiscovery, In-Path Rules, and Service Ports and About data store encryption. |
Disk Full | | Indicates that the system partitions (not the RiOS data store) are full or almost full. For example, RiOS monitors the available space on /var, which is used to hold logs, statistics, system dumps, TCP dumps, and so on. Examine the directory to see if it is storing an excessive amount of snapshots, system dumps, or TCP dumps that you could delete. You could also delete any RiOS images that you no longer use. |
Domain Authentication Alert | Needs Attention | Indicates that the system is unable to communicate with the DC, has detected an SMB signing error, or delegation has failed. CIFS-signed and Encrypted-MAPI traffic is passed through without optimization. |
Domain Join Error | Degraded | Indicates an attempt to join a Windows domain has failed. For details, see Troubleshooting a domain join failure. |
Flash Protection Failure | Critical | Indicates that the USB flash drive has not been backed up because there isn’t enough available space in the /var filesystem directory. Examine the /var directory to see if it is storing an excessive amount of snapshots, system dumps, or TCP dumps that you could delete. You could also delete any RiOS images that you no longer use. |
Hardware | Either Critical or Degraded, depending on the state | • Disk Error—Indicates that one or more disks is offline. To see which disk is offline, enter this the show raid diagram CLI command from the system prompt. • Fan Error—Indicates that a fan is failing or has failed and must be replaced. • Flash Error—Indicates an error with the flash drive hardware. At times, the USB flash drive that holds the system images might become unresponsive; the SteelHead continues to function normally. When this error triggers you can’t perform a software upgrade, as the SteelHead is unable to write a new upgrade image to the flash drive without first power cycling the system. To reboot the appliance, go to the Administration > Maintenance: Reboot/Shutdown page or enter the CLI reload command to automatically power cycle the SteelHead and restore the flash drive to its proper function. On desktop SteelHead x50 and x55 models, you must physically power cycle the appliance (push the power button or pull the power cord). • IPMI—Indicates an Intelligent Platform Management Interface (IPMI) event (not supported on all appliance models). This alarm triggers when there has been a physical security intrusion. These events trigger this alarm: – chassis intrusion (physical opening and closing of the appliance case) – memory errors (correctable or uncorrectable ECC memory errors) – hard drive faults or predictive failures – power supply status or predictive failure By default, this alarm is enabled. • Management Disk Size Error—Indicates that the size of the management disk is too small for the SteelHead model. This condition can occur when upgrading a SteelHead to a VCX model without first expanding the management disk to a size that supports the higher end models. To clear the alarm, increase the size of the management disk. • Memory Error—Indicates a memory error (for example, when a system memory stick fails). |
| | • Other Hardware Error—Indicates one of these hardware issues: – the SteelHead doesn’t have enough disk, memory, CPU cores, or NIC cards to support the current configuration. – the SteelHead is using a memory Dual In-line Memory Module (DIMM), a hard disk, or a NIC that isn’t qualified by Riverbed. • DIMMs are plugged into the SteelHead but RiOS can’t recognize them because: – a DIMM is in the wrong slot. You must plug DIMMs into the black slots first and then use the blue slots when all of the black slots are in use. —or— – a DIMM is broken and you must replace it. – other hardware issues exist. By default, this alarm is enabled. • Safety Valve: disk access exceeds response times—Indicates that the SteelHead is experiencing increased disk access time and has started the safety valve disk bypass mechanism that switches connections into SDR-A. SDR-A performs data reduction in memory until the disk access latency falls below the safety valve activation threshold. Disk access time can exceed the safety valve activation threshold for several reasons: the SteelHead might be undersized for the amount of traffic it is required to optimize, a larger than usual amount of traffic is being optimized temporarily, or a disk is experiencing hardware issues such as sector errors, failing mechanicals, or RAID disk rebuilding. You configure the safety valve activation threshold and timeout using CLI commands: datastore safety-valve threshold datastore safety-value timeout For details, see the Riverbed Command-Line Interface Reference Guide. To clear the alarm, restart the SteelHead. • Power Supply—Indicates an inserted power supply cord doesn’t have power, as opposed to a power supply slot with no power supply cord inserted. • RAID—Indicates an error with the RAID array (for example, missing drives, pulled drives, drive failures, and drive rebuilds). An audible alarm might also sound. To see if a disk has failed, enter the show raid diagram CLI command from the system prompt. For drive rebuilds, if a drive is removed and then reinserted, the alarm continues to be triggered until the rebuild is complete. Rebuilding a disk drive can take 4-6 hours. |
Licensing | Needs Attention, Degraded, or Critical, depending on the state | Indicates whether your licenses are current. • Appliance Unlicensed—This alarm triggers if the SteelHead a license installed for its currently configured model or feature set. For details about updating licenses, see Viewing system permissions. • Autolicense Critical Event—This alarm triggers on a SteelHead appliance when the Riverbed Licensing Portal can’t respond to a license request with valid licenses. The Licensing Portal can’t issue a valid license for one of these reasons: – A newer SteelHead appliance is already using the token, so you can’t use it on the SteelHead appliance displaying the critical alarm. Every time the SteelHead appliance attempts to refetch a license token, the alarm retriggers. – The token has been redeemed too many times. Every time the SteelHead appliance attempts to refetch a license token, the alarm retriggers. Discontinue use of the other SteelHead appliance or contact Support. • Autolicense Informational Event—This alarm triggers if the Riverbed Licensing Portal has information regarding the licenses for a SteelHead appliance. For example, the SteelHead appliance displays this alarm when the portal returns licenses that are associated with a token that has been used on a different SteelHead appliance. Make sure that any previous SteelHead appliances that were licensed with that token are no longer running. The alarm automatically clears the next time the SteelHead appliance fetches the licenses from the Licensing Portal. • Licenses Expired—This alarm triggers if one or more features has at least one license installed, but all of them are expired. • Licenses Expiring—This alarm triggers if the license for one or more features is going to expire within two weeks. The licenses expiring and licenses expired alarms are triggered per feature. For example, if you install two license keys for a feature, LK1-FOO-xxx (expired) and LK1-FOO-yyy (not expired), the alarms don’t trigger, because the feature has one valid license. If the Licenses Expiring alarm triggers, the system status changes to Needs Attention. The Licenses Expired alarm changes the system status to Degraded. Depending on the expiring license, other alarms might trigger simultaneously. For example, if the primary license expires, the Appliance Unlicensed alarm triggers and changes the health to Critical. |
Link Duplex | Degraded | Indicates that an interface was not configured for half-duplex negotiation but has negotiated half-duplex mode. Half-duplex significantly limits the optimization service results. The alarm displays which interface is triggering the duplex error. Choose Networking > Networking: Base Interfaces and examine the SteelHead link configuration. Next, examine the peer switch user interface to check its link configuration. If the configuration on one side is different from the other, traffic is sent at different rates on each side, causing many collisions. To troubleshoot, change both interfaces to automatic duplex negotiation. If the interfaces don’t support automatic duplex, configure both ends for full duplex. You can enable or disable the alarm for a specific interface. To disable an alarm, choose Administration: System Settings > Alarms and select or clear the check box next to the link alarm. |
Link I/O Errors | Degraded | Indicates that the error rate on an interface has exceeded 0.1 percent while either sending or receiving packets. This threshold is based on the observation that even a small link error rate reduces TCP throughput significantly. A properly configured LAN connection experiences few errors. The alarm clears when the error rate drops below 0.05 percent. You can change the default alarm thresholds by entering the alarm link_io_errors err-threshold <threshold-value> CLI command at the system prompt. For details, see the Riverbed Command-Line Interface Reference Guide. To troubleshoot, try a new cable and a different switch port. Another possible cause is electromagnetic noise nearby. You can enable or disable the alarm for a specific interface. For example, you can disable the alarm for a link after deciding to tolerate the errors. To enable or disable an alarm, choose Administration > System Settings: Alarms and select or clear the check box next to the link name. |
Link State | Degraded | Indicates that the system has lost one of its Ethernet links due to an unplugged cable or dead switch port. Check the physical connectivity between the SteelHead and its neighbor device. Investigate this alarm as soon as possible. Depending on what link is down, the system might no longer be optimizing, and a network outage could occur. You can enable or disable the alarm for a specific interface. To enable or disable the alarm, choose Administration > System Settings: Alarms and select or clear the check box next to the link name. |
Local and Remote Logging | Degraded | Indicates an expired or expiring remote log server certificate for the secure remote log server. You must have a log server certificate installed for secure remote logging. • Secure logging expired certificates—This alarm triggers if there is an expired log server certificate. • Secure logging expiring certificates—This alarm triggers if there is a log server certificate that is expiring. |
Memory Error | Degraded | Indicates that the system has detected a memory error. A system memory stick might be failing. First, try reseating the memory first. If the problem persists, contact Support for an RMA replacement as soon as practically possible. |
Memory Paging | Degraded | Indicates that the system has reached the memory paging threshold. If 100 pages are swapped approximately every two hours the appliance is functioning properly. If thousands of pages are swapped every few minutes, reboot the appliance. If that does not resolve the issue, contact Support. |
Neighbor Incompatibility | Degraded | Indicates that the system has encountered an error in reaching a SteelHead configured for connection forwarding. |
Network Bypass | Critical | Indicates that the system is in bypass failover mode. If the appliance is in bypass failover mode, restart the optimization service. If restarting the service doesn’t resolve the problem, reboot the appliance. If rebooting doesn’t resolve the problem, shut down and restart the appliance. |
NFS V2/V4 Alarm | Degraded | Indicates that the system has detected either NFSv2 or NFSv4 is in use. The SteelHead supports only NFSv3 and passes through all other versions. |
Optimization Service | Critical | • Internal Error—The optimization service has encountered a condition that might degrade optimization performance. Go to the Administration > Maintenance: Services page and restart the optimization service. • Unexpected Halt—The optimization service has halted due to a serious software error. See if a system dump was created. If so, retrieve the system dump and contact Support immediately. For details, see Viewing logs. • Service Status—The optimization service has encountered an optimization service condition. The message indicates the reason for the condition: – optimization service is not running This message appears after an optimization restart. For more information, review the SteelHead logs. – in-path optimization is not enabled This message appears if an in-path setting is disabled for an in-path SteelHead. For more information, review the SteelHead logs. – optimization service is initializing This message appears after a reboot. The alarm clears. For more information, review the SteelHead logs. – optimization service is not optimizing This message appears after a system crash. For more information, review the SteelHead logs. – optimization service is disabled by user This message appears after entering the CLI command no service enable or shutting down the optimization service from the Management Console. For more information, review the SteelHead logs. – optimization service is restarted by user This message appears after the optimization service is restarted from either the CLI or Management Console. You might want to review the SteelHead logs for more information. |
Outbound QoS WAN Bandwidth Configuration | Degraded (Needs Attention) | Indicates that the outbound QoS WAN bandwidth for one or more of the interfaces is set incorrectly. You must configure the WAN bandwidth to be less than or equal to the interface bandwidth link rate. This alarm triggers when the system encounters one of these conditions: • An interface is connected and the WAN bandwidth is set higher than its bandwidth link rate: for example, if the bandwidth link rate is 1536 kbps, and the WAN bandwidth is set to 2000 kbps. • A nonzero WAN bandwidth is set and QoS is enabled on an interface that is disconnected; that is, the bandwidth link rate is 0. • A previously disconnected interface is reconnected, and its previously configured WAN bandwidth was set higher than the bandwidth link rate. The Management Console refreshes the alarm message to inform you that the configured WAN bandwidth is set higher than the interface bandwidth link rate. While this alarm appears, the SteelHead puts existing connections into the default class. The alarm clears when you configure the WAN bandwidth to be less than or equal to the bandwidth link rate or reconnect an interface configured with the correct WAN bandwidth. By default, this alarm is enabled. |
Path Selection Path Down | Degraded | Indicates that one of the predefined paths for a connection is unavailable because it has exceeded either the timeout value for path latency or the threshold for observed packet loss. When a path fails, the SteelHead directs traffic through another available path. When the original path comes back up, the SteelHead redirects the traffic back to it. |
Path Selection Path Probing Error | Degraded | Indicates that a path selection monitoring probe for a predefined path has received a probe response from an unexpected relay or interface. |
Process Dump Creation Error | Degraded | Indicates that the system has detected an error while trying to create a process dump. This alarm indicates an abnormal condition in which RiOS can’t collect the core file after three retries. It can be caused when the /var directory, which is used to hold system dumps, is reaching capacity or other conditions. When this alarm is raised, the directory is blacklisted. Contact Support to correct the issue. |
Proxy File Service | Degraded | Indicates that there has been a PFS operation or configuration error. • Proxy File Service Configuration—Indicates that a configuration attempt has failed. If the system detects a configuration failure, attempt the configuration again. • Proxy File Service Operation—Indicates that a synchronization operation has failed. If the system detects an operation failure, attempt the operation again. |
Secure Transport | | Indicates that a peer SteelHead has encountered a problem with the secure transport controller connection. The secure transport controller is a SteelHead that typically resides in the data center and manages the control channel and operations required for secure transport between SteelHead peers. The control channel between the SteelHeads uses SSL to secure the connection between the peer SteelHead and the secure transport controller. • Connection with Controller Lost—Indicates that the peer SteelHead is no longer connected to the secure transport controller for one of these reasons: – The connectivity between the peer SteelHead and the secure transport controller is lost. – The SSL for the connection isn’t configured correctly. • Registration with Controller Unsuccessful—Indicates that the peer SteelHead isn’t registered with the secure transport controller, and the controller doesn’t recognize it as a member of the secure transport group. |
Secure Vault | Degraded | Indicates a problem with the secure vault. • Secure Vault Locked—Needs Attention. Indicates that the secure vault is locked. To optimize SSL connections or to use RiOS data store encryption, the secure vault must be unlocked. Choose Administration > Security: Secure Vault and unlock the secure vault. • Secure Vault New Password Recommended—Degraded. Indicates that the secure vault requires a new, nondefault password. Reenter the password. • Secure Vault Not Initialized—Critical. Indicates that an error has occurred while initializing the secure vault. When the vault is locked, SSL traffic isn’t optimized and you can’t encrypt the RiOS data store. For details, see Unlocking the secure vault. |
Software Compatibility | Needs Attention or Degraded, depending on the state | Indicates that there’s a mismatch between software versions in the Riverbed system. • Peer Mismatch—Needs Attention. Indicates that the appliance has encountered another appliance that is running an incompatible version of system software. Refer to the CLI, Management Console, or the SNMP peer table to determine which appliance is causing the conflict. Connections with that peer will not be optimized, connections with other peers running compatible RiOS versions are unaffected. To resolve the problem, upgrade your system software. No other action is required as the alarm automatically clears. • Software Version Mismatch—Degraded. Indicates that the appliance is running an incompatible version of system software. To resolve the problem, upgrade your system software. No other action is required as the alarm automatically clears. By default, this alarm is enabled. |
SSD Write Cycle Level Exceeded | Degraded | Indicates that the accumulated Solid-State Disk (SSD) write cycles are exceeding a predefined write cycle level (95 percent) on SteelHead models with SSDs. If the alarm triggers, the administrator can swap out the disk before any problems arise. RiOS tracks the number of writes to each block. To view the associated statistics, enter the show stats alarm ssd_wear_warning CLI command. For details, see the Riverbed Command-Line Interface Reference Guide. |
SSL | Needs Attention | Indicates that an error has been detected in your secure vault or SSL configuration. • Non-443 SSL Servers—Indicates that during a RiOS upgrade (for example, from 8.5 to 9.0), the system has detected a preexisting SSL server certificate configuration on a port other than the default SSL port 443. SSL traffic might not be optimized. To restore SSL optimization, you can add an in-path rule to the client-side SteelHead to intercept the connection and optimize the SSL traffic on the nondefault SSL server port. After adding an in-path rule, you must clear this alarm manually by entering this CLI command: stats alarm non_443_ssl_servers_detected_on_upgrade clear • SSL Certificates Error—Indicates that an SSL peering certificate has failed to reenroll automatically within the Simple Certificate Enrollment Protocol (SCEP) polling interval. • SSL Certificates Expiring—Indicates that an SSL certificate is about to expire. Two types of certificates can trigger this alarm: Certificate Authority certificates used to validate servers and SSL Server Certificates that the SteelHead uses when acting as a trusted man in the middle. Depending on the type of certificate, you can review the expiring certificates on the Optimization: SSL > Certificate Authorities page or the Optimization: SSL > SSL Main Settings page. (The alarm only redirects you to the Certificate Authorities page, but you might need to review the SSL Main Settings page for your certificate.) Note, certificates are sorted by name and the expiring certificates might not be visible until you scroll through the list. • SSL Certificates SCEP—Indicates that an SSL certificate has failed to reenroll automatically within the SCEP polling interval. • SSL HSM private key not accessible—Indicates that the server-side SteelHead can’t import the private key corresponding to the proxy certificate from a SafeNet Luna Hardware Security Module (HSM) server. The private key is necessary to establish mutual trust between the SteelHead and the HSM for proxied SSL traffic optimization. Check that the server-side SteelHead can access the HSM device and that the private key exists on the HSM server. For details, see the Riverbed Command-Line Interface Reference Guide. |
Storage Profile Switch Failed | Either Critical or Needs Attention, depending on the state | On a SteelHead EX, indicates that an error has occurred while repartitioning the disk drives during a storage profile switch. The repartitioning was unsuccessful. A profile switch changes the disk space allocation on the drives to allow VE and VSP to use varying amounts of storage. It also clears the SteelFusion and VSP data stores, and repartitions the data stores to the appropriate sizes. You switch a storage profile by entering the disk-config layout CLI command at the system prompt or by choosing Administration > System Settings: Disk Management on an EX or EX+SteelFusion SteelHead and selecting a storage profile. A storage profile switch requires a reboot of the SteelHead. The alarm appears after the reboot. These reasons can cause a profile switch to fail: • RiOS can’t validate the profile. • The profile contains an invalid upgrade or downgrade. • RiOS can’t clean up the existing VDMKs. During cleanup, RiOS uninstalls all slots and deletes all backups and packages. When you encounter this error, reboot the SteelHead and then switch the storage profile again. If the switch succeeds, the error clears. If it fails, RiOS reverts the SteelHead to the previous storage profile. • If RiOS successfully reverts the SteelHead to the previous storage profile, the alarm status displays needs attention. • If RiOS is unable to revert the SteelHead to the previous storage profile, the alarm status becomes critical. |
System Detail Report | Degraded | Indicates that the system has detected a problem with an optimization or system module. |
Temperature | Critical or Warning | • Critical—Indicates that the CPU temperature has exceeded the critical threshold. The default value for the rising threshold temperature is 80°C; the default reset threshold temperature is 67°C. • Warning—Indicates that the CPU temperature is about to exceed the critical threshold. |
Web Proxy | Degraded | • Configuration—Indicates that the system has detected an error with the web proxy configuration. • Service Status—Indicates that the system has detected an error with the web proxy service. |
The Alarm Status report answers this question:
• What’s the current status of the SteelHead?
You view the Alarm Status report under Reports > Diagnostics: Alarm Status. Alternately, you can select the current system status that appears in the status box in the upper-left corner of each page (Healthy, Admission Control, Degraded, or Critical) to display the Alarm Status page.
To print the report, choose File > Print in your web browser to open the Print dialog box.
Viewing the CPU Utilization report
The CPU Utilization report summarizes the percentage of all of the CPU cores used in the system within the time period specified. You can display individual cores or an overall average, or both. Typically, a SteelHead operates on approximately 30 to 40 percent CPU capacity during nonpeak hours and approximately 60 to 70 percent capacity during peak hours. No single SteelHead CPU usage should exceed 90 percent.
The CPU Utilization report answers these questions:
• How much of the CPU is being used?
• What’s the average and peak percentage of the CPU being used?
Mouse over a specific data point to see the values and exact time stamp.
You view the CPU Utilization report under Reports > Diagnostics: CPU Utilization.
CPU Utilization page
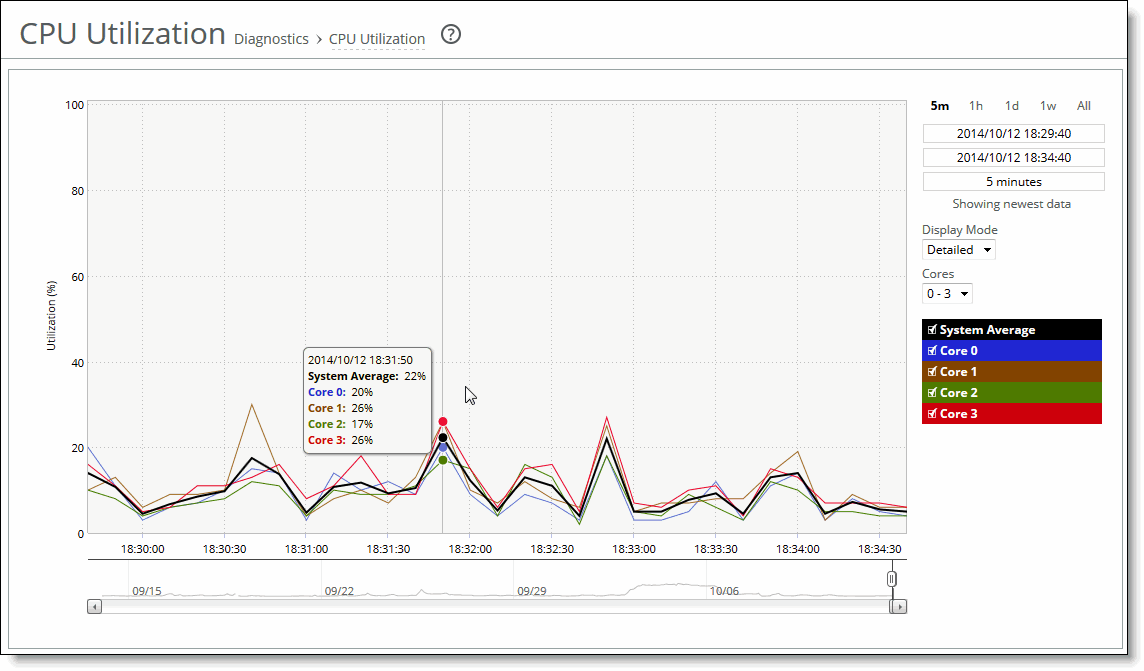
These options are available to customize the report:
Time Interval
Specifies a report time interval of 5 minutes (5m), 1 hour (1h), 1 day (1d), 1 week (1w), All, or type a custom date. All includes statistics for the last 30 days. Time intervals that don’t apply to a particular report are dimmed. For a custom time interval, enter the start time and end time using this format: yyyy/mm/dd hh:mm:ss
You can quickly see the newest data and see data points as they’re added to the chart dynamically. To display the newest data, click Show newest data.
Display Mode
Specifies one of these displays from the drop-down menu:
• Brief—Displays the CPU utilization percentage of all CPU cores combined as a system-wide average.
• Detailed—Displays the CPU percentages for each RiOS core individually. The individual cores appear with a number and a color in the data series. To hide or display a core in the plot area, select or clear the check box next to the core name.
Viewing the Memory Paging report
The Memory Paging report provides the rate at which memory pages are swapped out to disk. The Memory Page report includes this statistic that describes memory paging activity for the time period you specify:
Page Swap Out Rate
Specifies the total number of pages swapped per second. If 100 pages are swapped approximately every two hours, the SteelHead is functioning properly. If thousands of pages are swapped every few minutes, contact Support.
The Memory Paging report answers this question:
• How many memory pages are swapping out?
Mouse over a specific data point to see the values and exact time stamp.
You view the Memory Paging report under Reports > Diagnostics: Memory Paging.
Memory Paging page
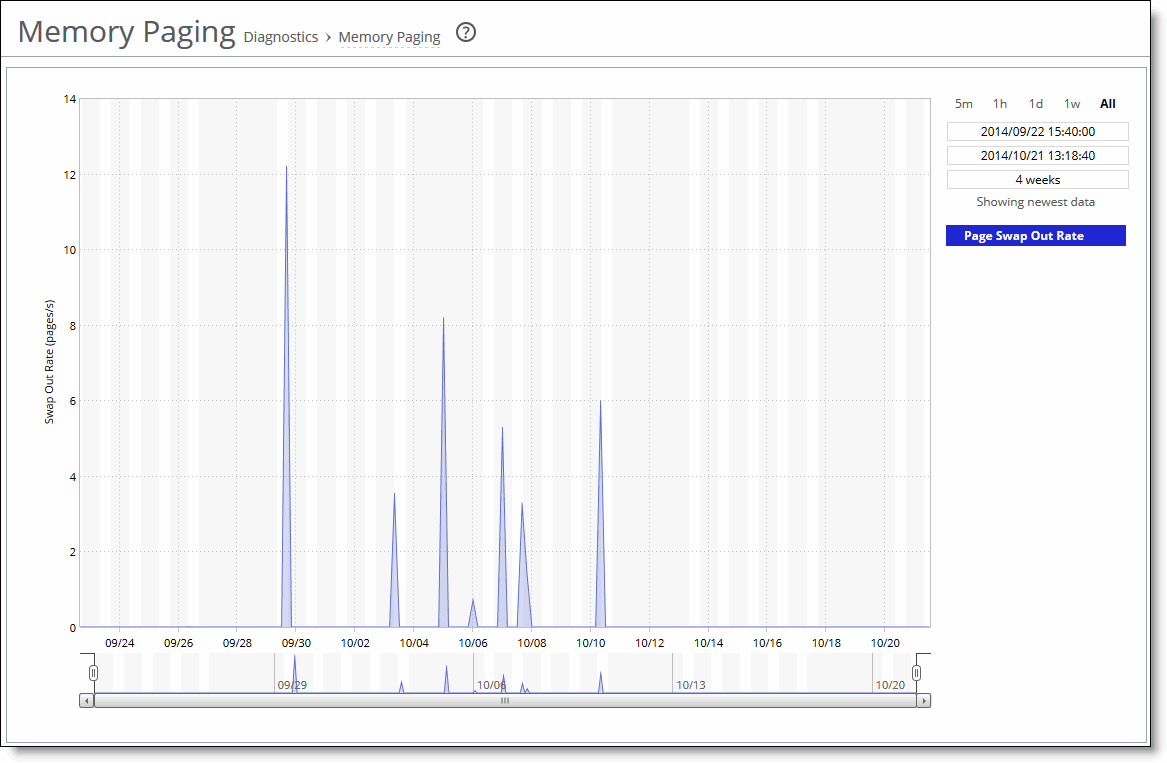
This option is available to customize the report:
Time Interval
Specifies a report time interval of 5 minutes (5m), 1 hour (1h), 1 day (1d), 1 week (1w), All, or type a custom date. All includes statistics for the last 30 days. Time intervals that don’t apply to a particular report are dimmed. For a custom time interval, enter the start time and end time using this format: yyyy/mm/dd hh:mm:ss.
You can quickly see the newest data and see data points as they’re added to the chart dynamically. To display the newest data, click Show newest data.
Viewing the TCP Memory report
The TCP Memory report simplifies the analysis of unexplainable throughput degradations, stalled and timed-out connections, and other network-related problems by providing the history of the TCP memory consumption and any TCP memory pressure events detected during network traffic processing. Use this report to gather preliminary information before calling Support to troubleshoot an issue. The TCP Memory report includes two graphs. The TCP usage graph provides the absolute number of memory bytes allocated by the TCP subsystem. This graph includes these statistics that describe TCP memory activity for the time period you specify:
Max Threshold
Displays the maximum amount of memory bytes that the TCP stack can allocate for its needs.
Cutoff Threshold
Displays the number of memory bytes allocated until the TCP memory allocation subsystem doesn’t apply memory-saving mechanisms and rules. As soon as the TCP memory consumption reaches the cutoff limit, the TCP stack enters a “memory pressure” state. This state applies several important limitations that restrict memory use by incoming and transmitted packets. In practice, this means that part of the incoming packets can be discarded, and user space code is limited in its abilities to send data.
Enable Threshold
Displays the lower boundary of TCP memory consumption, when the memory pressure state is cleared and the TCP stack can use the regular memory allocation approach again.
Memory Usage
Displays the average memory consumption by the TCP/IP stack.
Memory Pressure
Displays the maximum percentage of time that the kernel has spent under TCP memory pressure.
The navigator shadows the memory usage series.
In many cases, even an insignificant increase in network traffic can cause TCP memory pressure, leading to negative consequences. There are many conditions that can cause TCP memory pressure events. However, all of them can be sorted into these two categories to identify the bottleneck in the data transfer chain:
• Slow client cases—Occur when the receiver (client) isn’t able to accept data at the rate the client-side SteelHead or the server-side SteelHead transfers data. This condition usually causes two TCP memory pressure points—one on the sender's side and another one on the receiver's (client's) side. The slow client on the sender's side (usually the client-side SteelHead) is characterized by a large amount of unsent data collected in the send socket buffers. Incorrect SteelHead settings, such as overly large send buffers, can trigger TCP memory pressure, even with relatively normal network traffic.
• Fast server cases—Occur when the sender is able to transfer data faster than the receiver can accept it. This condition can be triggered not only because of insufficient CPU resources, but also because of an insufficient disk transfer rate (especially with a cold and warm data pattern). The most common causes of this problem are a lack of processing power on the SteelHead and a large receive buffer setting.
The TCP Memory report answers these questions:
• How much time is the kernel spending under TCP memory pressure?
• What’s the average TCP memory consumption for the SteelHead?
Mouse over a specific data point to see the values and exact time stamp.
The Riverbed system reports on performance for periods up to one month. Due to performance and disk space considerations, the display granularity decreases with time passed since the data was sampled with a granularity of 5 minutes for the day, 1 hour for the last week, and 2 hours for the rest of the month.
You view the TCP Memory report under Reports > Diagnostics: TCP Memory.
TCP Memory page
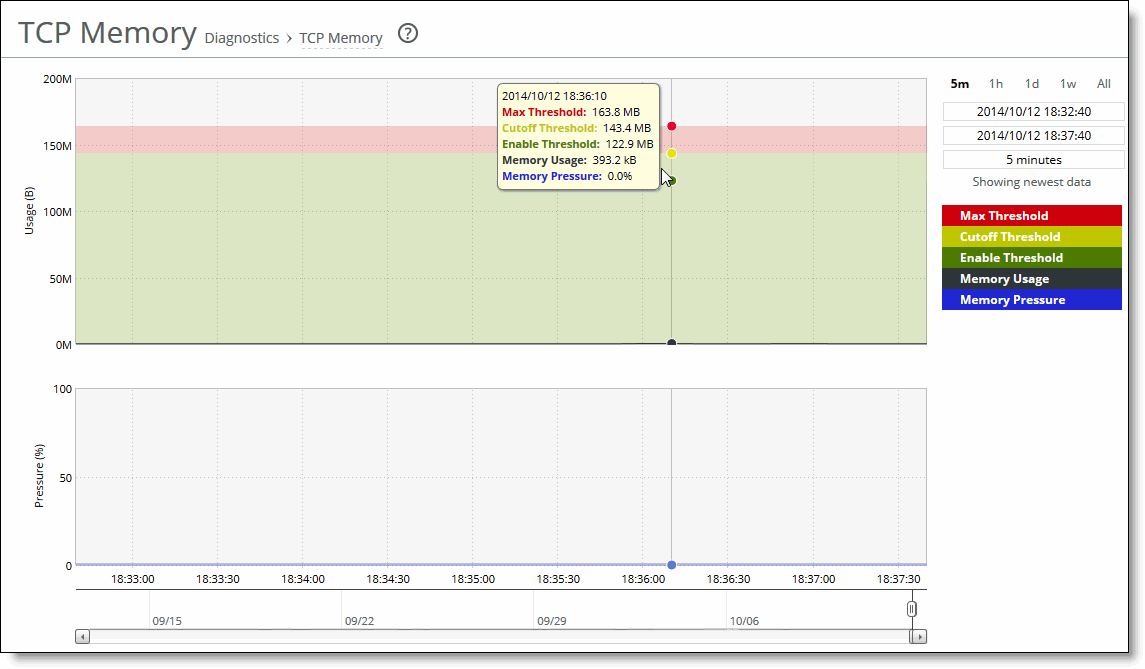
This option is available to customize the report:
Time Interval
Specifies a report time interval of 5 minutes (5m), 1 hour (1h), 1 day (1d), 1 week (1w), All, or type a custom date. All includes statistics for the last 30 days. Time intervals that don’t apply to a particular report are dimmed. For a custom time interval, enter the start time and end time using this format: yyyy/mm/dd hh:mm:ss
You can quickly see the newest data and see data points as they’re added to the chart dynamically. To display the newest data, click Show newest data.
Viewing the Disk Status report
The Disk Status report appears on Fault Tolerant Storage (FTS) enabled SteelHead models to alert you to a disk failure or recovery. SteelHeads using Solid-State Disk (SSD) technology to store optimization data also use FTS. FTS technology is a high-performance alternative to RAID and has these benefits:
• Service reliability. FTS allows the SteelHead to continue working at full operating speed after a drive failure with the remaining drives. The optimization data store is slightly smaller until you replace the failed SSD. In the 7050-L, a single SSD failure means that the data store size drops from 2.24 TB to 2.08 TB, slightly reducing the size of the optimization vocabulary known by the SteelHead. FTS-enabled SteelHead can optimize traffic up to the point that every data store drive fails.
• Performance. When you replace the failed SSD, the data store returns to its original size.
A disk failure or recovery can occur when the optimization service is:
• not running.
• running, but idle because there’s no traffic.
• handling optimized connections but not using the disk.
• writing to the disk.
• reading from the disk.
The Disk Status report includes this information:
Disk
Displays the disk number.
Status
Displays the disk status:
• Degraded—Indicates a failure of one or more of the RAID arrays. The disk itself has not failed.
• Failed—Indicates the disk has failed. The alarm email notification denotes whether the failure is on a management or data store disk. The optimization service continues to run normally without interruption or dropped connections when a single disk fails, albeit with reduced data store capacity and performance degradation. This message can also indicate that a disk has been inserted into an incorrect slot or that the disk has already been used in another appliance. If all disks fail, the optimization service halts.
• Missing—There is no disk in the slot.
• Rebuilding—The disk is rebuilding after it has been inserted into the slot. Rebuilding a data store disk takes approximately one hour or less to rebuild; a management disk that is part of a RAID mirror can take longer (4 to 6 hours). The status continues to be rebuilding until the drive is completely rebuilt.
• Online—Disk is up and working.
Task
Displays the system component the disk is used for: either data store or management. If the disk is used for both, the task column doesn’t appear.
The Disk Status report answers these questions:
• How many disks are on the SteelHead?
• What’s the current status of each disk?
• What function is the disk performing?
You view the Disk Status report under Reports > Diagnostics: Disk Status to display the Disk Status page. This menu item appears only on SteelHead models using Solid State Disks (SSDs).
To print the report, choose File > Print in your web browser to open the Print dialog box.
Viewing the System Details report
The System Details report takes a current snapshot of the system to provide a one-stop report you can use to check for any issues with the SteelHead. The report examines key system components. For example, the CPU and memory. Use this report to gather preliminary system information before calling Support to troubleshoot an issue.
To view the reports, choose Reports > Diagnostics: System Details.
Module
Displays the SteelHead module. Select a module name to view details. A right arrow to the left of a module indicates that the report includes detailed information about a submodule. Click the arrow to view submodule details.
This report examines these modules:
• CPU—Displays information about idle time, system time, and user time per CPU.
• Memory—Displays information about the total, used, and free memory by percentage and in kilobytes.
• Intercept—Click the right arrow to view statistics for message queue, GRE, and WCCP. Also includes table length and watchdog status.
• Accelerators—Displays how many accelerator objects have been created for read-ahead, write-behind, and cached-mode folder synchronization. One accelerator object corresponds to the optimization of one particular Outlook action.
– Read-ahead is for downloading an email attachment (in noncached Outlook mode or for public folders).
– Write-behind is for uploading an email attachment.
– Cache-sync is for downloading the new contents of a folder (in cached mode).
• Requests and responses—Displays the number of MAPI round-trips used and saved. Includes the number of responses and faults along with the fault reason: for example, access denied.
• MAPI decryption and encryption (RPCCR)—Displays whether MAPI decryption and encryption is enabled. Includes the number of client-side and server-side SteelHead encrypted MAPI sessions, along with details about how many sessions were not encrypted, how many sessions were successfully decrypted and encrypted, how many sessions were passed through, and how many sessions experienced an authentication failure.
• Connection sessions—Displays the number of client-side and server-side SteelHead MAPI sessions, counting the number of MAPI 2000, 2003, 2007, and pass-through sessions.
• Secure Peering—Click the right arrow and submodule name to view details for secure inner channels, including information about certificate and private key validity, peer SteelHead trust, and blacklisted servers.
• Splice Policy—Displays details about the splice policy in use.
• TLS—Displays details about the TLS configuration. Click the right arrow and the submodule name to view details.
– TLS Blade—displays whether TLS optimization is enabled and the connection totals including: Optimized and Passthrough connections, Handshake failures, and Client-auth connections.
– Keystone—displays the Keystone transport server settings, including the selection mode, Certificate Services including requests received, accepted and failed, Transports created and currently connected, and Transport Details.
Status
Displays one of these results:
• OK (Green)
• Warning (Yellow)
• Error (Red)
• Disabled (Gray). Appears when you manually disable the module.
The System Details report answers this question:
• Is there a problem with one particular application module or does the issue affect multiple modules?
You view the System Details report under Reports > Diagnostics: System Details.
To print the report, choose File > Print in your web browser to open the Print dialog box.
Checking network health status
You can run diagnostic tests on SteelHead connectivity under Reports > Diagnostics: Network Health Check.
The network health check provides a convenient way to troubleshoot connectivity issues by running a set of general diagnostic tests. Viewing the test results can pinpoint any issues with appliance connectivity and significantly speed problem resolution.
These configuration options are available:
Gateway Test
Determines if each configured gateway is connected correctly. Run this test to ping each configured gateway address with 4 packets and record the number of failed or successful replies. The test passes if all 4 packets are acknowledged. The default packet size is 64 bytes.
• Internet Protocol—Select IPv4 or IPv6 from the drop-down list.
• Run—Click to run the test.
If the test fails and all packets are lost, ensure the gateway IP address is correct and the SteelHead is on the correct network segment. If the gateway is reachable from another source, check the connections between the SteelHead and the gateway.
If the test fails and only some packets are lost, check your duplex settings and other network conditions that might cause dropped packets.
Cable Swap Test
Ensures that the WAN and LAN cables on the SteelHead are connected to the LAN and WAN of the network. The test enumerates the results by interface (one row entry per pair of bypass interfaces). By default, this test is disabled.
Certain network topologies might cause an incorrect result for this test. For the following topologies, we recommend that you confirm the test result manually:
• SteelHeads deployed in virtual in-path mode.
• Server-side SteelHeads that receive significant amounts of traffic from nonoptimized sites.
• SteelHeads that sit in the path between other SteelHeads that are optimizing traffic.
If the test fails, ensure a straight-through cable is not in use between an appliance port and a router, or that a crossover cable is not in use between an appliance port and a switch.
Duplex Test
Determines if the speed and duplex settings match on each side of the selected interface. If one side is different from the other, then traffic is sent at different rates on each side, causing a great deal of collision. This test runs the ping utility for 5 seconds with a packet size of 2500 bytes against the interface.
• Interface—Specify an interface to test.
• IP Address—Specify an IPv4 or IPv6 address that is on the testing interface side.
• Run—Click to run the test.
The test passes if the system acknowledges 100 percent of the packets and receives responses from all packets. If any packets are lost, the test fails.
If the test fails, ensure the speed and duplex settings of the appliance's Ethernet interface matches that of the switch ports to which it’s connected.
The test output records the percentage of any lost packets and number of collisions.
For accurate test results, traffic must be running through the SteelHead.
Peer Reachability Test
Sends a test probe to a specified peer and await the probe response. If a response is not received, the test fails.
To view the current peer appliances, choose Reports > Optimization: Peers.
• IP Address—Specify the IPv4 or IPv6 address of the peer appliance to test.
• Run—Click to run the test.
Notes:
• This test might not be accurate when the peer SteelHead is configured out-of-path.
• Do not specify the primary or auxiliary IP of the same SteelHead displayed in the Peers report (the primary or auxiliary IP to which the SteelHead is connected).
If the test fails, ensure that there are no firewalls, IDS/IPS, VPNs, or other security devices that might be stripping or dropping connection packets between SteelHeads.
IP Port Reachability Test
Determines whether a specified IP address and optional port is correctly connected. If you specify only an IP address, the test sends an ICMP message to the IP address. If you specify a port number, the test telnets to the port.
• Interface—Optionally, specify an interface to test.
• IP Address—Specify the IP4 or IPv6 address to test.
• Port—Optionally, specify a port to test.
• Run—Click to run the test.
If the test fails, ensure that dynamic or static routing on your network is correctly configured and that the remote network is reachable from hosts on the same local subnet as this appliance.
Run Selected
Runs the selected tests.
View or Hide Test Output
Displays or hides the test results.
The Last Run column displays the time and date the last test was run.
The Status column displays Initializing temporarily while the page loads. When the test starts, the Status column displays Running, and then the test result appears in the Results column.
The Results column displays one of these test results:
• Passed
• Failed
• Undetermined—A test with an undetermined status indicates that the test couldn’t accurately determine a pass or fail test status.
You view diagnostic test results under Reports > Diagnostics: Network Health Check.
Under the test name, click View Test Output.
To print the test results, click View Test Output and choose File > Print in your web browser to open the Print dialog box.
Checking domain health
You run Windows domain diagnostic tests on a SteelHead in the Reports > Diagnostics: Domain Health Check page.
The RiOS Windows domain health check executes a variety of tests that provide diagnostics about the status of domain membership, both manual and automatic constrained delegation, and DNS resolution. This information enables you to resolve issues quickly.
Before running domain diagnostic delegation tests, choose Optimization > Active Directory: Auto Config or Optimization > Active Directory: Service Accounts to configure a Windows user account that you can use for delegation purposes. The Windows domain health check on the SteelHead doesn’t create the delegate user; the Windows domain administrator must create the account in advance. For details, see
About Active Directory easy configuration.
You run domain health tests under Reports > Diagnostics: Domain Health Check.
Test DNS
Checks SteelHead DNS settings, which must be correct for Windows domain authentication, SMB signing, SMB2/3 signing, and encrypted MAPI optimization. A test status appears for the most recent test run: Passed, Failed, or Undetermined.
• Domain/Realm—Specify the fully qualified Active Directory domain in which the SteelHead is a member. Typically, this is your company domain name.
• Test DNS—Click to run the test. The Management Console dims this button until you specify the domain name.
Test Join
Confirms that the SteelHead is correctly joined to the Windows domain by verifying that the domain join configuration of the SteelHead is valid on the backend domain controller in Active Directory. A test status appears for the most recent test run: Passed, Failed, or Undetermined.
• Test Join—Click to run the test.
Test Delegation Setup
Checks whether an account has the necessary Active Directory privileges for delegation or automatic delegation. A test status appears for the most recent test run: Passed, Failed, or Undetermined.
• Delegation Domain/Realm—Select the fully qualified domain in which the SteelHead is a member. Typically, this is your company domain name.
• Domain Controller—Specify the host that provides user login service in the domain.
• Test Delegation Setup—Click to run the test. The Management Console dims this button until you specify all required information.
Test Delegation Privileges
Confirms delegation privileges for a particular server by verifying that the correct privileges are set to perform constrained delegation. Within SMB signing, SMB2/3 signing, and encrypted MAPI in delegation mode, the SteelHead and the AD environment must have correct privileges to obtain Kerberos tickets for the CIFS or Exchange Server and perform the subsequent authentication. A test status appears for the most recent test run: Passed, Failed, or Undetermined.
• Delegation Domain/Realm—Select the domain in which the SteelHead is a member. Typically, this is your company domain name.
• Server—Specify a delegate server hostname.
• Server IP—Specify the delegate server IP address.
• Service—Select either CIFS or Exchange MDB.
• Account to Delegate—Specify a domain username.
• Test Delegation Privileges—Click to run the test. The Management Console dims this button until you specify all required information.
Test NTLM Authentication
Tests whether NTLM can successfully authenticate a user to the joined domain. A test status appears for the most recent test run: Passed, Failed, or Undetermined.
• Username—Specify an Active Directory domain username.
• Password—Specify a password.
• Domain/Realm—Specify the fully qualified domain of the Active Directory in which the SteelHead is a member. Typically, this is your company domain name.
• Short Domain Name—Specify the short domain (NetBIOS) name if it doesn’t match the first portion of the Active Directory domain name. Case matters; NBTTECH isn’t the same as nbttech.
• Test NTLM Authentication—Click to run the test. The Management Console dims this button until you specify all required information.
Common domain health errors
This section describes common problems that can occur when joining a Windows domain.
System time mismatch
The number one cause of failing to join a domain is a significant difference in the system time on the Windows domain controller and the SteelHead. When the time on the domain controller and the SteelHead don’t match, this error message appears:
lt-kinit: krb5_get_init_creds: Clock skew too great
We recommend using NTP time synchronization to synchronize the client and server clocks. It is critical that the SteelHead time is the same as on the Active Directory controller. Sometimes an NTP server is down or inaccessible, in which case there can be a time difference. You can also disable NTP if it isn’t being used and manually set the time. You must also verify that the time zone is correct. For details, see
About the date and time settings.
Select the primary DNS IP address to view the Networking > Networking: Host Settings page.
Invalid domain controller IP
A domain join can fail when the DNS server returns an invalid IP address for the Domain Controller. When a DNS misconfiguration occurs during an attempt to join a domain, these error messages appear:
Failed to join domain: failed to find DC for domain <domain name>
Failed to join domain: No Logon Servers
Additionally, the Domain Join alarm triggers and messages similar to these appear in the logs:
Oct 13 14:47:06 bravo-sh81 rcud[10014]: [rcud/main/.ERR] - {- -} Lookup for bravo-sh81.GEN-VCS78DOM.COM Failed
Oct 13 14:47:06 bravo-sh81 rcud[10014]: [rcud/main/.ERR] - {- -} Failed to join domain: failed to find DC for domain GEN-VCS78DOM.COM
When you encounter this error, choose Networking > Networking: Host Settings and verify that the DNS settings are correct.
Verifying hardware capabilities of a SteelHead
After you deploy a SteelHead, you might want to verify its optimization and disk usage performance before using it in a production environment. You can run tests that benchmark the SteelHead performance against that of other Riverbed products from the Reports > Diagnostics: Benchmarks page. Test results indicate the highest model SteelHead that can run on the hardware supporting the tested appliance.
This performance test appears only on SteelHead appliances.
A group is a collection of one or more tests. You can only select and run a group of tests but not individual tests. The tool provides two groups, one for benchmarking the storage devices (sequential writes, random reads), and one for benchmarking the RiOS optimization service (mixed traffic).
The Sequential Write or Random Read benchmark tests emulate common disk use on the storage devices. Running these tests clears all data from the RiOS data store.
For details on SteelHead, see the SteelHead User Guide.
You view hardware capabilities under Reports > Diagnostics: Benchmarks.
If the optimization service is running, click Stop. Alternatively, you can stop the optimization service on the Administration > Maintenance: Reboot/Shutdown page.
Select the tests that you want to run. Click Run Selected Tests.
The tool runs only one test at a time, and queues the others. When a test completes, the tool pulls the next test from the queue and starts it.
When every test in a group completes, you can put the group back into the queue immediately without having to wait for any running test from another group to complete.
While the test runs, you can freely navigate to another page and come back to view the test results. You can also start the tests using the CLI and then return to the Benchmarks page to monitor the results.
The Last Run column displays the time and date the last test was run. The Duration column displays how long, from start to finish, it took to run the test.
When the test starts, the Status column displays Running, and then Done. The test result appears in the Results column.
The Status column might also show Queued for test that will run according to their sequence in the queue, Error for tests that encountered an error while running, and Timed Out, which indicates the test was stopped before it completed.
The Results column displays a list of Riverbed product models that this appliance qualifies; that is, it matches or exceeds performance. The list sorts the qualified models in descending order (best to worst)
An empty list indicates that the hardware under performs all Riverbed models, and this message appears:
This appliance is out performed by all similar appliances in Riverbed's product line.
Viewing logs
SteelHead log reports provide a high-level view of network activity. You can view both user and system logs.
Viewing user logs
You can view user logs in the Reports > Diagnostics: User Logs page. The user log filters messages from the system log to display messages that are of immediate use to the system administrator.
View user logs to monitor system activity and to troubleshoot problems. For example, you can monitor who logged in, who logged out, and who entered particular CLI commands, alarms, and errors. The most recent log events are listed first.
You view and customize user logs under Reports > Diagnostics: User Logs.
These options are available to customize the report:
Show
Specifies one of the archived logs or Current Log from the drop-down list.
Lines per Page
Specifies the number of lines you want to display in the page.
Jump to
Specifies one of these options from the drop-down list:
• Page—Specify the number of pages you want to display.
• Time—Specify the time for the log you want to display.
Filter
Specifies one of these filtering options from the drop-down list:
• Regular expression—Specify a regular expression on which to filter the log.
• Error or higher—Displays Error level logs or higher.
• Warning or higher—Displays Warning level logs or higher.
• Notice or higher—Displays Notice level logs or higher.
• Info or higher—Displays Info level logs or higher.
Go
Displays the report.
To print the report, choose File > Print in your web browser to open the Print dialog box.
You can continuously display new lines as the log grows and appends new data.
You view a continuous log under Reports > Diagnostics: User Logs.
Click Launch Continuous Log in the upper-right corner of the page.
If the continuous log doesn’t appear after clicking Launch Continuous Log, a pair of SteelHeads might be optimizing HTTP traffic between the user's web browser and the primary or auxiliary interface of the SteelHead for which the user is viewing the log, and they’re buffering the HTTP response.
To display the continuous log, you can switch to HTTPS because the SteelHeads will not optimize HTTPS traffic. Alternatively, you can configure the other SteelHeads to pass-through traffic on the primary or auxiliary interfaces for port 80.
Viewing system logs
You can view system logs in the Reports: Diagnostics: System Logs page. View System logs to monitor system activity and to troubleshoot problems. The most recent log events are listed first.
You customize system logs under Reports > Diagnostics: System Logs.
The options are available to customize the report:
Show
Specifies one of the archived logs or Current Log from the drop-down list.
Lines per page
Specifies the number of lines you want to display in the page.
Jump to
Specifies one of these options from the drop-down list:
• Page—Specify the number of pages you want to display.
• Time—Specify the time for the log you want to display.
Regular Expression Filter
Specifies one of these filtering options from the drop-down list:
• Regular expression—Specify a regular expression on which to filter the log.
• Error or higher—Displays Error level logs or higher.
• Warning or higher—Displays Warning level logs or higher.
• Notice or higher—Displays Notice level logs or higher.
• Info or higher—Displays Info level logs or higher.
Go
Displays the report.
To print the report, choose File > Print in your web browser to open the Print dialog box.
You view a continuous log under Reports > Diagnostics: System Logs.
Click Launch Continuous Log in the upper-right corner of the page.
If the continuous log doesn’t appear after clicking Launch Continuous Log, a pair of SteelHeads might be optimizing the HTTP traffic between the user's web browser and the primary or auxiliary interface of the SteelHead for which the user is viewing the log, and they’re buffering the HTTP response.
To display the continuous log, you can switch to HTTPS because the SteelHeads will not optimize HTTPS traffic. You might want to configure the other SteelHeads to pass-through traffic on the primary or auxiliary interface
Downloading log files
This section describes how to download user and system log files.
You can download both user and system logs.
Downloading user log files
You can download user logs under Reports > Diagnostics: User Logs Download. Download user logs to monitor system activity and to troubleshoot problems.
The User Logs Download page displays up to 10 archived log files plus the current day log file. By default, the system rotates each file every 24 hours or if the file size reaches one Gigabyte uncompressed. You can change this to rotate every week or month in the Administration: System Settings > Logging page. Additionally, you can rotate the files based on file size.
The automatic rotation of system logs deletes your oldest log file, labeled as Archived log #10, pushes the current log to Archived log # 1, and starts a new current-day log file.
Click the log name in the Download Plain Text column or the Download Compressed column.
Open or save the log (these procedures vary depending on which browser you are using).
Click Rotate Logs to manually archive the current log to a numbered archived log file and then clear the log so that it is empty again.
When you click Rotate Logs, your archived file #1 contains data for a partial day because you are writing a new log before the current 24-hour period is complete.
Downloading system log files
You can download system logs under Reports > Diagnostics: System Logs Download. Download system logs to monitor system activity and to troubleshoot problems.
The System Logs Download page displays up to 10 archived log files plus the current day log file. By default, the system rotates each file every 24 hours or if the file size reaches one Gigabyte uncompressed. You can change this to rotate every week or month in the Administration: System Settings > Logging page. Additionally, you can rotate the files based on file size.
The automatic rotation of system logs deletes your oldest log file, labeled as Archived log #10, pushes the current log to Archived log # 1, and starts a new current-day log file.
Click the log name in the Download Plain Text column or the Download Compressed column.
Open or save the log (these procedures vary depending on which browser you are using).
Click Rotate Logs to manually archive the current log to a numbered archived log file and then clear the log so that it is empty again.
When you click Rotate Logs, your archived file #1 contains data for a partial day because you are writing a new log before the current 24-hour period is complete.
Generating system dumps
You can generate, display, and download system dumps under Reports > Diagnostics: System Dumps. A system dump contains a copy of the kernel data on the system. System dump files can help you diagnose problems in the system.
Under Generate System Dump, select the type of information to include in the report:
• Include Statistics—Select to collect and include CPU, memory, and other statistics in the system dump (this option is enabled by default). These statistics are useful while analyzing traffic patterns to correlate to an issue. The system adds the statistics to a file in the system dump called stats.tgz.
• Include All Logs—Removes the 50 MB limit for compressed log files, to include all logs in the system dump.
Click Generate System Dump.
Because generating a system dump can take a while, a spinner appears during the system dump creation. When the system dump is complete, its name appears in the list of links to download.
You view system dump files under Reports > Diagnostics: System Dumps.
Click Download to view a previously saved system dump.
Select the filename to open a file or save the file to disk.
To remove a log, select the check box next to the name and click Remove Selected.
To print the report, choose File > Print in your web browser to open the Print dialog box.
You can upload a system dump file to Riverbed Support under Reports > Diagnostics: System Dumps.
Select the filename. Optionally, specify a case number that corresponds to the system dump. We recommend using a case number: for example, 194170. You can also enter the CLI command file debug dump upload URL to specify a URL instead of a case number. When you specify a URL, the dump file goes directly to the URL.
If the URL points to a directory on the upload server, it must have a trailing forward slash (/).
For example:
ftp://ftp.riverbed.com/incoming/
(not ftp://ftp.riverbed.com/incoming)
The filename as it exists on the appliance will then match the filename on the upload server.
For details, see the Riverbed Command-Line Interface Reference Guide.
Click Upload.
Because uploading a system dump can take a while, the status appears during the upload. When the system dump finishes uploading, the date, time, and a status of either uploaded (appears in green) or failed (appears in red). An explanation appears for uploads that fail.
Viewing process dumps
You can display and download process dumps under Reports > Diagnostics: Process Dumps. A process dump is a saved copy of memory including the contents of all memory, bytes, hardware registers, and status indicators. Process dumps are written for any process that crashes, on both physical and virtual appliances.
Process dumps aren’t written with any specific frequency during normal operation, they’re only written on demand, should a process crash for some reason.
Process dump files can help you diagnose problems in the system.
Select the filename to open a file or save the file to disk.
To remove an entry, select the check box next to the name and click Remove Selected.
To download a process dump file, choose Reports > Diagnostics: Process Dumps
Click Download to receive a copy of the previously saved process dump.
To upload a process dump file to Riverbed Support, choose Reports > Diagnostics: Process Dumps. Optionally, specify a case number that corresponds to the process dump. We recommend using a case number: for example, 194170. You can also enter the CLI command file process dump upload URL to specify a URL instead of a case number. When you specify a URL, the dump file goes directly to the URL.
If the URL points to a directory on the upload server, it must have a trailing forward slash (/).
For example:
ftp://ftp.riverbed.com/incoming/
(not ftp://ftp.riverbed.com/incoming)
The filename as it exists on the appliance will then match the filename on the upload server.
For details, see the Riverbed Command-Line Interface Reference Guide.
Click Upload.
Because uploading a process dump can take a while, a progress bar appears during the upload. When the process dump finishes uploading, the date, time, and a status of either uploaded (appears in green) or failed (appears in red) are indicated. An explanation appears for uploads that fail.
Capturing and uploading TCP dump files
You can create, download, and upload TCP dump (capture) files under Reports > Diagnostics: TCP Dumps.
Capture files contain summary information for every internet packet received or transmitted on the interface to help diagnose problems in the system.
RiOS provides an easy way to create and retrieve multiple capture files from the Management Console. You can create capture files from multiple interfaces at the same time, limit the size of the capture file, and schedule a specific date and time to create a capture file. Scheduling and limiting a capture file by time or size allows unattended captures.
You can’t upload a capture file to the SteelHead using Packet Analyzer.
The top of the TCP Dumps page displays a list of existing capture files and the bottom of the page displays controls to create a capture file. The bottom of the page also includes the capture files that are currently being generated, and the controls to create a trigger that stops a capture when a specific event occurs. The Running Capture Name list includes captures running at a particular time. It includes captures started manually and also any captures that were scheduled previously and are now running.
Capturing TCP dump files with Interceptor deployments
Starting with RiOS 9.6, the SteelHead appliance detects Interceptors in your network, and automatically customizes the displays nder Reports > Diagnostics: TCP Dumps to make them specific to Interceptor deployments. Instead of entering IP addresses and ports to capture traffic flows between a client-side and server-side SteelHead, enter information for either the client-side or server-side SteelHead only. When TCP dumps are generated, the SteelHead appliance creates a dump file for the traffic flows on the SteelHead connections you specify.
You can enter additional parameters to limit the size of the dump; the other fields on this page are unchanged.
If there are IPv6 extension headers in the original data packet that originated from the client or server, IPv6 packets are not captured.
These configuration options are available. (Some choices appear only if you have a Interceptor in your network deployment.)
Add a New TCP Dump
Displays the controls for creating a capture file.
Capture Name
Specifies the name of the capture file. Use a unique filename to prevent overwriting an existing capture file. The default filename uses this format:
hostname_interface_timestamp.cap
hostname is the hostname of the SteelHead, interface is the name of the interface selected for the trace (for example, lan0_0, wan0_0), and timestamp is in this format: yyyy-mm-dd-hh-ss
If this capture file relates to an open Riverbed Support case, specify the capture filename case_number where number is your Riverbed Support case number: for example, case_12345.
The .cap file extension isn’t included with the filename when it appears in the capture queue.
Endpoints (non-Interceptor deployments)
Specifies IP addresses and port numbers to capture packets between them:
• IPs—Specify IP addresses of endpoints on one side. Separate multiple IP addresses using commas. You can enter IPv6 addresses separated by commas. The default setting is all IP addresses.
• Ports—Specify ports on one side. Separate multiple ports using commas. The default setting is all ports.
—and—
• IPs—Specify IP addresses of endpoints on the other side. Separate multiple IP addresses using commas. You can enter IPv6 addresses separated by commas. The default setting is all IP addresses.
• Ports—Specify ports on the other side. Separate multiple ports using commas. The default setting is all ports.
To capture traffic flowing in only one direction or to enter a custom command, use the CLI tcpdump command. For details, see the Riverbed Command-Line Interface Reference Guide.
Endpoints (Interceptor deployments)
Select Interceptor Location—Select either Client or Server. Your choice determines the endpoints you can specify. The endpoints are IP addresses and port numbers in your network.
If you select Client:
• IPs—Specify All to capture traffic on all IP addresses between the client side and server side (the default). You can limit the capture to specific endpoints connected to the client-site SteelHead by specifying the IP addresses of those endpoints. You can also limit capture to specific IP addresses on the server-side SteelHead by specifying those IP addresses. You can use either IPv4 or IPv6 addresses. Separate multiple addresses with commas.
• Ports—Specify All to capture all ports on the client side (the default). You can also specify one or more SteelHead ports, endpoint ports, or both. Separate multiple ports using commas.
If you select Server:
• IPs—Specify All to capture traffic on all IP addresses between the server side and client side (the default). You can limit the capture to specific endpoints connected to the server-site SteelHead by specifying the IP addresses of those endpoints. You can also limit capture to specific IP addresses on the client-side SteelHead by specifying those IP addresses. You can use either IPv4 or IPv6 addresses. Separate multiple addresses with commas.
• Ports—Specify All to capture all ports on the server side (the default). You can also specify one or more SteelHead ports, endpoint ports, or both. Separate multiple ports using commas.
Capture Inner Channel Data—Select this check box to capture all inner and redirected traffic between the Interceptor and SteelHead for the specified IP address and port. This check box is deselected by default.
Appliance IP address—Specify the in-path IP address of the local SteelHead.
Service Port—Specify the service port of the local SteelHead. The default service port number is 7800.
To capture traffic flowing in only one direction or to enter a custom command, use the CLI tcpdump command. For details, see the Riverbed Command-Line Interface Reference Guide.
Capture Interfaces
Captures packet traces on the selected interfaces. You can select all interfaces or a base or in-path interface. The default setting is none. You must specify a capture interface.
If you select several interfaces at a time, the data is automatically placed into separate capture files.
When path selection is enabled, we recommend that you collect packet traces on all LAN and WAN interfaces.
Capture Parameters
Captures information about dot1q VLAN traffic. You can match traffic based on VLAN-tagged or untagged packets, or both. You can also filter by port number or host IP address and include or exclude ARP packets. Select one of these parameters for capturing VLAN packets:
• Capture Untagged Traffic Only—Select this option for these captures:
– All untagged VLAN traffic.
– Untagged 7850 traffic and ARP packets. You must also specify or arp in the custom flags field in this page.
– Only untagged ARP packets. You must also specify and arp in the custom flags field in this page.
• Capture VLAN-Tagged Traffic Only—Select this option for these captures:
– Only VLAN-tagged traffic.
– VLAN-tagged packets with host 10.11.0.6 traffic and ARP packets. You must also specify 10.11.0.6 in the IPs field, and specify or arp in the custom flags field in this page.
– VLAN-tagged ARP packets only. You must also specify and arp in the custom flags field in this page.
• Capture both VLAN and Untagged Traffic—Select this option for these captures:
– All VLAN traffic.
– Both tagged and untagged 7850 traffic and ARP packets. You must also specify the following values in the custom flags field in this page:
(port 7850 or arp) or (vlan and (port 7850 or arp))
– Both tagged and untagged 7850 traffic only. You must also specify 7850 in one of the port fields in this page. No custom flags are required.
– Both tagged and untagged ARP packets. You must also specify the following values in the custom flags field in this page:
(arp) or (vlan and arp)
Capture Duration (Seconds)
Specifies a positive integer to set how long the capture runs, in seconds. The default value is 30. Specify 0 or continuous to initiate a continuous trace.
For continuous capture, we recommend specifying a maximum capture size and a nonzero rotate file number to limit the size of the TCP dump.
Maximum Capture Size
Specifies the maximum capture file size in megabytes. The default value is 100. After the file reaches the maximum capture size, TCP dump starts writing capture data into the next file, limited by the Number of Files to Rotate field. We recommend a maximum capture file size of 1024 MB (1 GB).
Buffer Size
Specifies the maximum amount of data, in kilobytes, allowed to queue while awaiting processing by the capture file. The default value is 154 kilobytes.
Snap Length (bytes)
Specifies the snap length value for the capture file or specify a custom value. The snap length equals the number of bytes the report captures for each packet. Having a snap length smaller than the maximum packet size on the network enables you to store more packets, but you might not be able to inspect the full packet content.
Select 65535 for a full packet capture (recommended for CIFS, MAPI, and SSL captures). The default value is 1518 bytes.
When using jumbo frames, we recommend selecting 9018. The default custom value is 16383 bytes.
Number of Files to Rotate
Specifies how many capture files to keep for each interface before overwriting the oldest file. To stop file rotation, you can specify 0; however, we recommend rotating files, because stopping the rotation can fill the disk partition.
This control limits the number of files created to the specified number and begins overwriting files from the beginning, thus creating a rotating buffer.
The default value is 5. The maximum value is 2147483647.
Custom Flags
Specifies custom flags as additional statements within the filter expression. Custom flags are added to the end of the expression created from the Endpoints fields and the Capture Parameters radio buttons (pertaining to VLANs).
If you require an “and” statement between the expression created from other fields and the expression that you are entering in the custom flags field, you must include the “and” statement at the start of the custom flags field.
Do not use host, src, or dst statements in the custom flags field. Although it is possible in trivial cases to get these statements to start without a syntax error, they don’t capture GRE-encapsulated packets that some modes of SteelHead communications use, such as WCCP deployments or Interceptor connection-setup traffic. We recommend using bidirectional filters by specifying endpoints.
For complete control of your filter expression, use the CLI tcpdump command. For details, see the Riverbed Command-Line Interface Reference Guide.
Schedule Dump
Schedules the capture to run at a later date and time.
Start Date
Specifies a date to initiate the capture, in this format: yyyy/mm/dd
Start Time
Specifies a time to initiate the capture, in this format: hh:mm:ss
Troubleshooting
If the tcpdump command results in a syntax error with an immediate or scheduled TCP dump, this message appears:
Error in tcpdump command. See System Log for details.
Review the system log to see the full tcpdump command attempt. Check the expression for issues such as a missing “and” statement as well as contradictory instructions such as looking for VLAN-tagged traffic and nontagged traffic.
Custom flag use examples
The examples in this table focus on the custom flag entry but rely on other fields to create a complete filter.
Filter purpose | Custom flag |
|---|
To capture all traffic on VLAN 10 between two specified endpoints: 1.1.1.1 and 2.2.2.2 | and vlan 10 |
To capture any packet with a SYN or an ACK | tcp[tcpflags] & (tcp-syn|tcp-ack) != 0 |
To capture any packet with a SYN | tcp[tcpflags] & (tcp-syn) != 0 —or— tcp[13] & 2 == 2 |
To capture any SYN to or from host 1.1.1.1 | and (tcp[tcpflags] & (tcp-syn) != 0) —or— and (tcp[13] & 2 == 2) |
IPv6 custom flag use examples
The examples in this table focus on the custom flag entry but rely on other fields to create a complete filter.
To build expressions for TCP dump, IPv6 filtering doesn’t currently support the TCP, UDP, and other upper-layer protocol types that IPv4 does. Also, these IPv6 examples are based on the assumption that only a single IPv6 header is present.
Filter purpose | Custom flag |
|---|
To capture all FIN packets to or from host 2001::2002 | and (ip6[53] & 1!=0) |
To capture all IPv6 SYN packets | ip6 or proto ipv6 and (ip6[53] & 2 == 2) |
Stopping a TCP dump after an event occurs
Capture files offer visibility into intermittent network issues, but the amount of traffic they capture can be overwhelming. Also, because rotating logs is common, after a capture logs an event, the SteelHead log rotation can overwrite debugging information specific to the event.
RiOS 8.5.x and later make troubleshooting easier because they provide a trigger that can stop a continuous capture after a specific log event occurs. The result is a smaller file to help pinpoint what makes the event happen.
The stop trigger continuously scans the system logs for a search pattern. When it finds a match, it stops all running captures.
You can stop a capture after a specific log event under Reports > Diagnostics: TCP Dumps.
Schedule a capture.
In the Pattern text box, enter a Perl regular expression (regex) to find in a log. RiOS compares the Perl regex against each new line in the system logs and the trigger stops if it finds a match.
The simplest regex is a word or a string of characters. For example, if you set the pattern to “Limit,” the trigger matches the line “Connection Limit Reached.”
Notes:
• Perl regular expressions are case sensitive.
• Perl treats the space character like any other character in a regex.
Perl reserves some characters, called metacharacters, for use in regex notation. The metacharacters are:
{ } [ ] ( ) ^ $ . | * + ? \
You can match a metacharacter by putting a backslash before it. For example, to search for a backslash in the logs, you must enter two backslashes (\\) as the pattern.
• The pattern follows Perl regular expression syntax. For details, go to:
• You can’t change the pattern while a scan is running. You must stop the scan before changing a pattern.
• You don’t need to wrap the pattern with the metacharacters to match the beginning or end of a line (^ $) or with the wildcard character (*).
Specify the amount of time to pause before stopping all running captures when RiOS finds a match. The time delay gives the system some time to log more data without abruptly cutting off the capture. The default is 30 seconds. Specify 0 for no delay; the capture stops immediately.
After a trigger has fired, the capture can stop by itself before the delay expires. For example, the capture duration can expire.
Click Start Scan.
When the scan stops, RiOS sends an email to all email addresses on the Administration: System Settings > Email page appearing under Report Events via Email. The email notifies users that the trigger has fired.
The page indicates “Last Triggered: Never” if a TCP Dump stop trigger has never triggered on the SteelHead. After the delay duration of the stop trigger, RiOS displays the last triggered time.
Before changing the Perl regular expression or amount of delay, you must first stop the process.
To stop a running scan, click Stop Scan to halt the background process that monitors the system logs. RiOS dims this button when the stop trigger is idling.
These limitations apply to the stop trigger:
• You can’t create a trigger to stop a specific capture; the trigger affects all running captures.
• If the search pattern contains a typo, the trigger might never find a match.
• Only one instance of a trigger can run at one time.
Viewing a TCP dump
The top of the TCP Dumps page displays a list of existing captures.
You can view a capture file under Reports > Diagnostics: TCP Dumps.
Under Stored TCP Dumps, select the capture name to open the file.
Click Download to view a previously saved capture file.
To remove a capture file, select the check box next to the name and click Remove Selected.
You can print a capture file under Reports > Diagnostics: TCP Dumps.
Under Download Link, select the capture filename to open the file.
When the file opens, choose File > Print in your web browser to open the Print dialog box.
You can stop a running capture under Reports > Diagnostics: TCP Dumps.
Select the capture filename in the Running Capture Name list.
Click Stop Selected Captures.
Uploading a TCP dump
Riverbed offers a way to upload capture files to the support server for sharing with the support team while diagnosing issues.
You can upload the capture file to Support in continuous mode on the TCP Dumps page. Select the running capture and click Stop Selected Captures.
For timed captures that are complete, skip to Step 2.
The capture appears as a download link in the list of Stored TCP Dumps.
Select the capture filename.
Optionally, specify a case number that corresponds to the capture. We recommend using a case number: for example, 194170.
To specify a URL instead of a case number, you must use the CLI. You can enter the CLI command file tcpdump upload url. When you specify a URL, the capture file goes directly to the URL.
If the URL points to a directory on the upload server, it must have a trailing forward slash (/).
For example:
ftp://ftp.riverbed.com/incoming/
(not ftp://ftp.riverbed.com/incoming)
The filename as it exists on the appliance will then match the filename on the upload server.
For details, see the Riverbed Command-Line Interface Reference Guide.
Click Upload.
Because uploading a capture file can take a while, a progress bar displays the percentage of the total upload completed, the case number (if applicable), and the date and time the upload began. When the capture file finishes uploading, the date, time, and a status of either uploaded (appears in green) or failed (appears in red) are indicated.
Successful uploads show the status, the case number (if applicable), and the date and time the upload finished.
For uploads that fail, an explanation, the case number (if applicable), and the upload starting date and time appear.
Exporting performance statistics
You export performance statistics in CSV format under Reports > Report Data: Export. The CSV format allows you to easily import the statistics into spreadsheets and databases. You can open the CSV file in any text editor.
The CSV file contains commented lines (comments beginning with the # character) at the beginning of the file. These comments report what host generated the file, the report that was generated, time boundaries, the time the export occurred, and the version of the SteelHead the file was exported from. The statistical values are provided in columns: the first column is the date and time of the statistic sample, and the columns that follow contain the data.
These options are available to customize the report:
Report
Specifies the type of report you want to export from the drop-down list.
Period
Specifies a report time interval of custom, last five minutes, last hour, last day, last week, or last month.
Email Delivery
Sends the report to an email address.
Email Address
Specifies the email address of the recipient.
Export
Exports the report data.
Viewing in-path rule statistics
The In-Path Rule Statistics report displays statistics for in-path rules.
The In-Path Rule Statistics report answers these questions:
• When was the rule created?
• What is the IP address of the host where the rule was created?
• Which user created the rule?
• How many hits are in-path rules getting?
• When was the last time the in-path rule was hit?
• When was the counter last cleared?
This report provides you with the following data:
• The number of hits each in-path rule is shown, which lets you see which in-path rules are being used, and which aren’t.
• All pass-through rules are listed in this report, which makes them easy to find. Pass-through rules are sometimes created as a workaround for a temporary network issue. When the issue is resolved, the rule can be forgotten, which results in traffic not being optimized.
• A field in this table shows you when email notifications are being sent, which is another way to track pass-through in-path rules.
• If the rule ignores the global latency detection setting.
You can view the In-Path Rule Statistics report under Reports > Rules Statistics: In-Path Rule Statistics.
These statistics summarize the in-path rule activity:
Rule ID
Indicates the in-path rule ID. This ID corresponds to the Rule ID in the Optimization > Network Services: In-Path Rules page.
Rule Summary
Provides a summary of the rule's attributes.
Description
Provides a description that corresponds to the optional Description field for the rule in the Optimization > Network Services: In-Path Rules page.
Hit Count
Indicates the number of hits the rule has received.
Last Hit Time
Indicates the last time the in-path rule was matched.
Counter Clear Time
Indicates the last time the counter was cleared.
Creation time
Indicates the time that the rule was created.
Hostname
Indicates the hostname of the machine from where the user has logged in.
Created by
Indicates the SteelHead user ID of the user that created the rule (for example, admin).
Clear Stats
Clears the statistics.
Email Notify
(Applies only if you specify a pass-through in-path rule.) Indicates whether emails are sent when one or more pass-through in-path rules are configured. Reminder emails are also sent every 15 days.
To enable email notifications, verify the following additional changes:
• Select the Enable Email Notification check box when creating the rule in the Optimization > Network Services: In-Path Rules page.
• Select the Send Reminder of Passthrough Rules via email check box in the Administration > System Settings: Email page.
• Select the Report Events via Email check box and specify an email address in the in the Administration > System Settings: Email page.
Ignore Latency Detection
Indicates if the rule applies latency-detection passthrough.
Optionally, select Clear Stats to clear statistics for a single in-path rule. To clear all in-path rule statistics, select the Clear All Statistics check box, and then click Submit.


