Monitoring and Troubleshooting
This topic provides information about visibility tools and troubleshooting methods for SteelConnect. It includes these sections:
Viewing network topology
The dashboard map offers a unified at-a-glance view of your network topology, including a summary of the established tunnels, tunnels that need attention, sites under construction, and new events. It also provides continuous automatic monitoring of network events and site status.
To view the dashboard
•Choose Dashboard.
Multiple sites within an organization
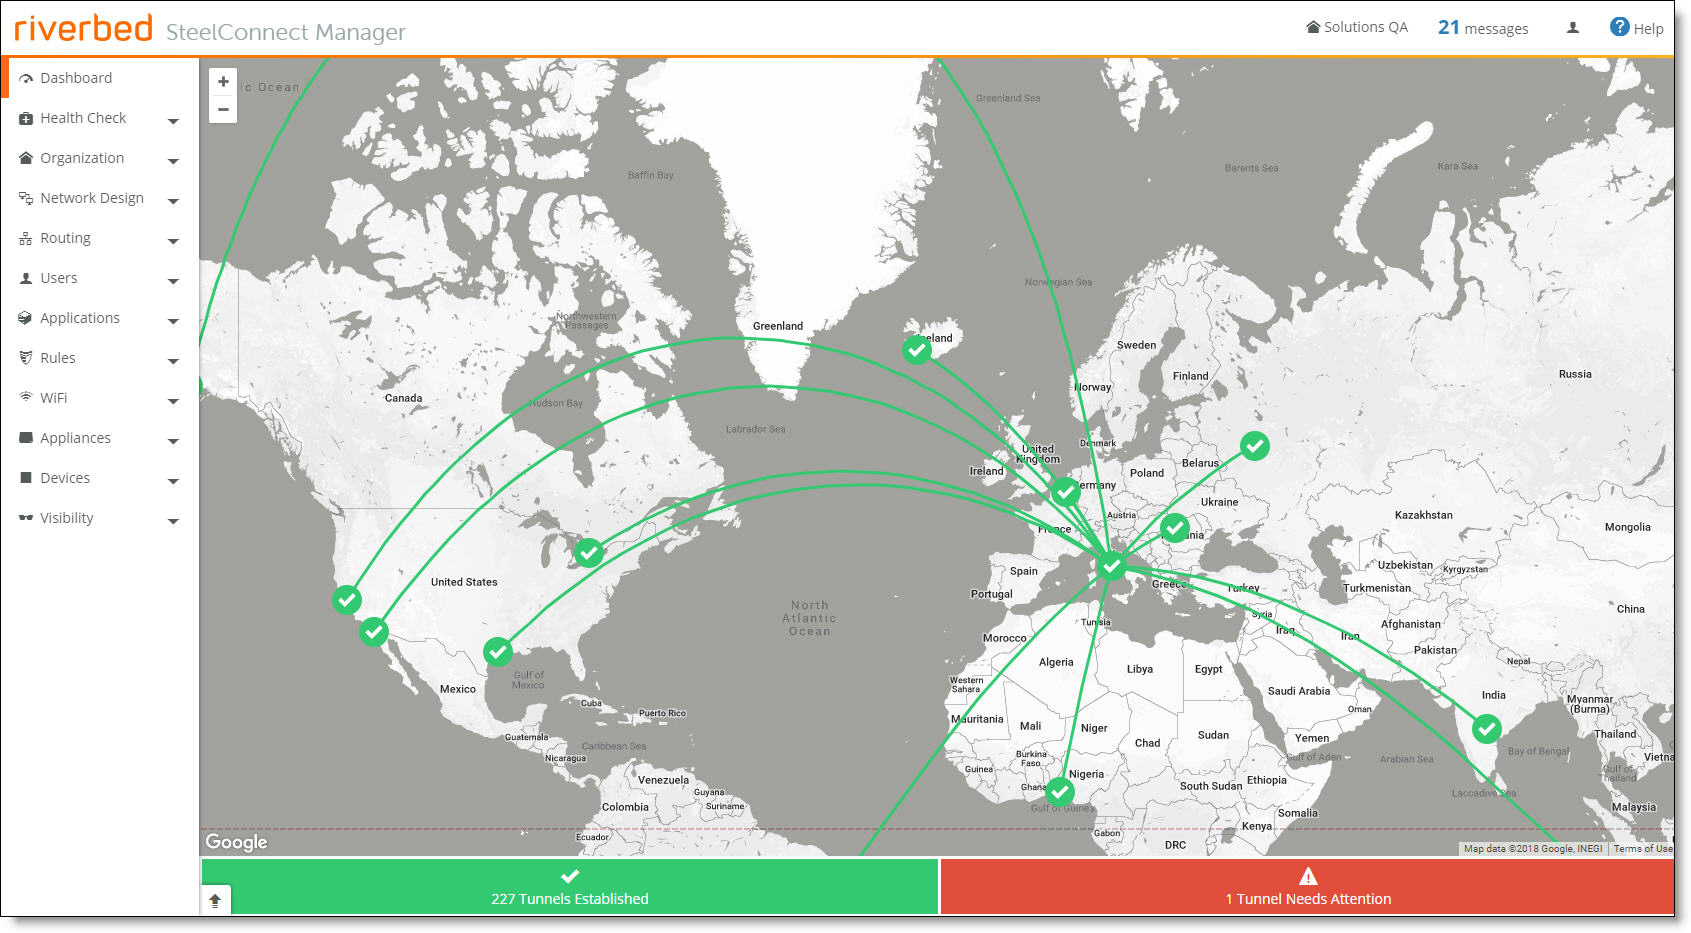
The Google Map displays the sites and tunnels within an organization. Double-click to zoom in.
The dashboard map provides a graphic view of a single full-duplex tunnel. Each tunnel on the dashboard represents both directions.
Viewing tunnel status
The dashboard displays the tunnels in the full-mesh network for networks with less than 16 sites. Click a tunnel to view tunnel status. For networks with 16 or more sites, the dashboard displays only problematic tunnels, such as tunnels that are down or congested. For networks with 16 or more sites, the tunnels appear after you click a site marker.
•Green line - Indicates that the VPN tunnel is successfully established.
•Red dashed line - Indicates that the VPN tunnel can’t be established or is down.
•Gray dashed line - Indicates that the VPN tunnel is under construction.
To view tunnel status on a dashboard with less than 16 sites
•On the dashboard map, click the green line indicating a path.
To view tunnel status on a dashboard with 16 or more sites
1. On the dashboard map, click the site marker.
Viewing tunnel status
2. Click the green line indicating a path.
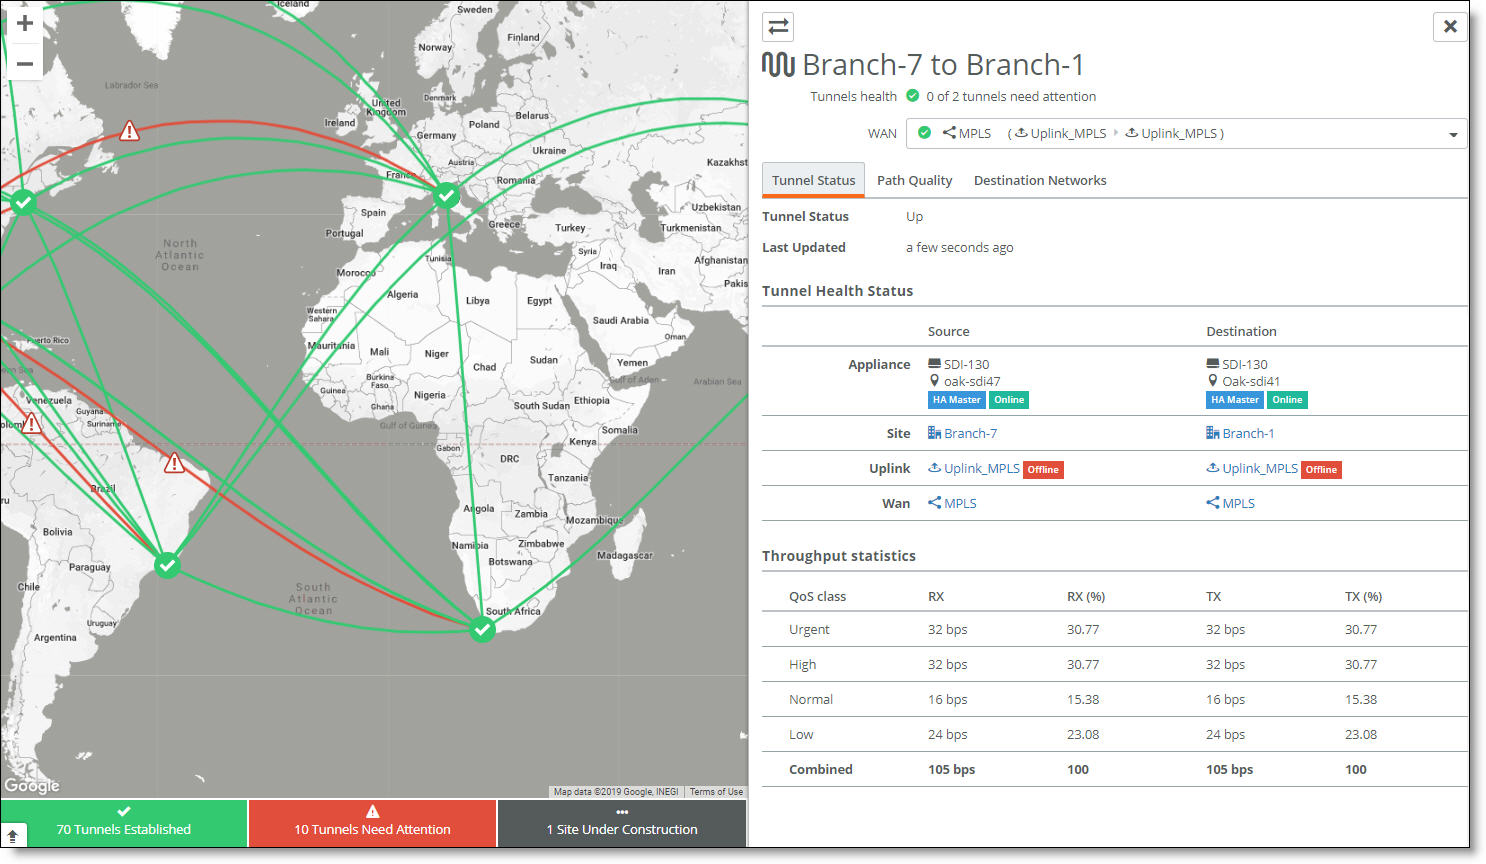
The tunnel detail window appears. Select a tab to see details about the tunnel status, path quality, or destination networks.
Click the double arrows in the top left corner of the tunnel detail window to see tunnel statistics in the reverse direction.
The Tunnel Status tab reports on the tunnel status, shows details about the tunnel source and destination, and includes throughput statistics by QoS class.
The Health Check > Overlay Routes and Health Check > Tunnel Status pages provide more information. For details, see
Checking overlay routes by site and
Checking tunnel health by tunnel.
To change the WAN view
•Select a WAN from the drop-down list.
The Path Quality tab reports metrics on the path quality, including statistics on latency, jitter, and packet loss by QoS class. For more details on these metrics, see
Monitoring path quality.
The Destination Networks tab displays the number of destination networks between the local and remote sites, including both reachable and unreachable networks. You can filter the destination networks by IP address. For more details, see
Destination Networks tab.
Viewing site and appliance status
You can monitor the real-time status of your sites along with the appliance status from the dashboard.
You can also monitor path quality metrics if you’re using path selection. For details, see
Monitoring path quality.
To view site status
•On the dashboard map, click the site marker.
The site’s tunnel status, appliance status, and location appear:
Green - SCM measures the AutoVPN health of a site as a whole. As long as there is one AutoVPN tunnel from that site to another, it shows a green check mark for the site status. Green indicates that some or all tunnels associated with the site are established.
Gray - A gray dashed icon indicates that the site is under construction. This includes:
–sites that are in the process of being defined within SCM, but are not yet live with actual appliances
–sites with shadow appliances.
Red - A red icon indicates that there is a problem with the site.
•If the city for a site is invalid, a purple question mark appears in an ocean on the dashboard map.
Invalid city marker for a site

–Click the marker to view the invalid address. Click the invalid address to go to the Location tab where you can fix the city.
To return to the dashboard, click the site marker again.
Monitoring tools
This section provides an overview of the SteelConnect monitoring tools, such as tunnel uptime and downtime indicators, NetFlow and SNMP integration, event logging, connectivity tests, and syslog message export to a remote server.
Local monitoring tools
SteelConnect 2.12 includes tools that monitor all SCM events, the underlay routing and reachability, and provide the collection, visualization, analysis and long-term storage of network statistics.
Tool | Description | See |
SNMP traps | Monitor SCM events. Realm administrators may configure traps for all appliances within the realm. | |
Event log | Select the Events tab or choose Visibility > Event log to monitor traffic, security, and user events on SCM. | |
CLI commands | Perform advanced monitoring and troubleshooting using CLI commands such as sysdump, show connections, and so on. | |
Underlay | Monitor the underlay’s routing and reachability on SteelHead SD appliances. | |
Connectivity tests | Run connectivity, packet capture, and echo tests from SCM on SDI gateways. | |
Syslog | Enable syslog monitoring of all appliances in a realm or organization. | |
NetFlow | Monitor all traffic flows that enter and exit the appliances, including flows on the underlay, overlay, and local flows. | |
Export data to remote servers
Tool | Description | See |
Syslog | Export syslog messages to a remote server. Realm administrators may configure for all organizations in the realm. | |
NetFlow | Export NetFlow data to one or more remote servers. Realm administrators may configure for all organizations in the realm. | |
Sysdump | Export a system dump file that contains diagnostic information about the common hypervisor, Control VM (CVM), Routing VM (RVM), and Service VM (SVM) nodes of a SteelHead SD appliance and an SDI-2030 gateway. On an SDI-5030 gateway, the file also contains information about the Host VM (HVM). | |
Systemwide visibility
Tool | Description | See |
Dashboard | View your network topology, including a summary of the established tunnels, tunnels that need attention, sites under construction, and new events. | |
Health Check | Track system resources using a layered troubleshooting approach. Drill down to specifics across the entire SD-WAN network. | |
Flow-based visibility with log integration
Tool | Description | See |
SteelCentral Insights | Provides deep integration with SteelCentral Insights for detailed flow-based visibility and analysis. | |
Integration with third-party products | Send logs to third-party products such as Splunk and Loggly for in-depth NetFlow analysis. | |
Troubleshooting tools
This table lists several troubleshooting tools provided in SteelConnect 2.12.
Tool | Description | See |
Show Path | Displays the potential paths for a given destination prefix. It also shows the current connections on the appliance using the paths. Use the show path tool in SCM or from the CLI. | |
show connections command | Displays traffic flows passing through the appliance. | |
Health Check | Displays the tunnel details and status in SCM. | |
Troubleshoot command | Identifies and reports status for all interfaces reaching SCM (SteelHead SD appliances). | |
configure network command | Configures static IP addressing for SteelHead SD in situations where DHCP is not an option. | |
sysdump | Creates a system dump at the appliance level to help diagnose problems. The system dump file contains diagnostic information about the common hypervisor, Control VM (CVM), Routing VM (RVM), and Service VM (SVM) nodes of a SteelHead SD appliance and an SDI-2030 gateway. On an SDI-5030 gateway, the file also contains information about the Host VM (HVM). | |
NetFlow | Monitors all traffic flows that enter and exit the appliances, including flows on the underlay, overlay, and local flows. | |
CLI commands | Perform advanced monitoring and troubleshooting using CLI commands such as sysdump, show connections, and so on. | |
Support package | Gather details when an issue is encountered, including high availability and data center cluster details. | |
BGP, OSPF, and FIB routing table search enhancements | Search the routing tables •by appliance serial number. •for all appliances in a site. | SteelHead SD User Guide |
Troubleshooting common questions
How do I find out where traffic is going when it leaves the gateway?
The Show Path tool displays the potential paths for a given destination prefix. It also shows the current connections on the appliance using the paths. Use the show path tool in SCM. See
Show Path tool.
How do I determine what influences the path?
Beyond basic routing, these configurations and settings influence the actual path the traffic takes.
How do I verify the traffic path?
The Show Path tool displays the potential paths for a given destination prefix. It also shows the current connections on the appliance using the paths. For details, see the
Show Path tool.
How can I isolate the problem when the SteelHead SD is unable to communicate with SCM?
The troubleshooting command for SteelHead SD identifies all interfaces reaching SCM. For details, see
troubleshoot.
Where can I see a list of tunnels?
Choose Health Check > Overlay Routes and Health Check > Tunnel Health to view a summary of the overlay tunnels and specific tunnels health. For details, see
Checking network overlays.
How can I verify the underlay routing for a brownfield transit deployment?
The Show Path tool displays the underlay routing. For details, see the
Show Path tool.
How do I check the status of a high availability pair?
From one of the SteelHead SD appliance partners in a pair, enter this CLI command:
show ha_info
For details, see
show ha_info.
How do I view the routing table entries?
Choose Health Check > Routing Tables. The Routing Tables page provides BGP, OSPF, and Forwarding Information Base (FIB) information for each appliance that is managed by SCM. For details, see
Displaying underlay ARP tables in the
SteelHead SD User Guide.
Monitoring with SNMP, syslog, and NetFlow
This section describes three useful ways to monitor your SD-WAN network: SNMP reporting for appliances, the syslog service that network devices use to send syslog messages to an external syslog server, and NetFlow to export flow information to a collector.
SNMP
The Organization SNMP tab configures an SCM appliance to send SNMP data directly to a network management system (NMS) and export messages to an external server. When you configure these settings at the organization level, you override the global realm settings.
For details on enabling SNMP and configuring direct reporting or remote logging at the realm level, see
Enabling SNMP reporting and logging. For a list of SNMP events, see
SNMP traps.
Sending SNMP data directly to your network management system
When direct SNMP reporting is enabled, all gateways in an organization send SNMP data directly to your network management system. You can also enable direct SNMP reporting for all gateways in a realm.
To enable direct SNMP reporting at the organization level
1. Choose Organization.
2. Select the organization.
3. Select the SNMP tab.
4. Under Direct SNMP reporting, click On.
5. Type your NMS IPv4 address.
6. Type the NMS server port number. The default port is 162.
7. Type a string to authenticate and identify the read-only community: for example, public. The maximum number of characters is 30.
8. Click Submit.
SCM forwards the configuration to the SteelConnect gateways, and the gateways use this configuration to set up the SNMP agent daemon. The SNMP agent services the GET and WALK requests from the NMS and also generates traps and sends them to the NMS.
Configuring the NMS
To enable SNMP operations (such as SNMP GET and WALK requests or asynchronous traps) from a SteelConnect appliance, you need to provide the NMS interface IP address through which the appliance is reachable.
Syslog
For mid to large enterprises that require log exporting to a central server while keeping security, compliance, and audit requirements intact, SCM provides remote logging. With remote logging, all system logs from different appliances can be aggregated and stored in a single remote server located within the same enterprise network.
External syslog servers can be modified at the realm or the organization level. Organization-level configuration takes precedence over a realm-level configuration.
When an event occurs, SteelConnect generates a syslog message and places it in a syslog file in the on the local device and, if configured, on a remote device.
After all logs are aggregated on one server, using third-party monitoring tools such as Splunk can make log analysis and reporting simpler. This log aggregation is also useful for archiving logs. You can also forward real-time system messages from appliances to the remote server.
To send syslog data to a remote server at the organization level
1. Choose Organization.
2. Select the organization.
3. Select the Logging tab.
4. Under Remote Logging, click On. Clicking On enables all remote logging configuration fields.
5. Type the remote syslog server’s IPv4 address or hostname. The remote server must be running the standard syslogd utility.
6. Type the syslog server port number on which to send syslog messages: for example, 514 for UDP. Use the same port number on the firewall and the syslog server. The default setting is 514.
7. Select the protocol used to transfer the log to the syslog server: TCP, UDP, or TLS (Transport Layer Security version 2.12). The default setting is UDP. You can use TCP for guaranteed log forwarding or UDP when speed is desirable and error correction isn’t necessary. TLS provides the most secure log message delivery.
When you select TLS as the transport method, you must establish trust between the syslog server and the appliances by copying and pasting the appliance core certificate to the remote log server certificate field. TLS uses a handshake process to authenticate the server and client. After the handshake is complete, the server and appliance negotiate an encryption algorithm and cryptographic keys before exchanging data. Log messages are encrypted during transfer to the remote server.
The TLS authentication process on the appliance uses:
–The appliance certificate generated by Riverbed core that is made available by default during manufacturing. The appliance certificate area is read-only.
–The appliance private key
–The certificate of CA that signed the server certificates. If the syslog server CA is an intermediate CA, you must paste the complete certificate chain up to the root.
The TLS authentication process on the remote server uses:
–The server certificate generated by any trusted authority
–The server private key
–The certificate of Riverbed core
8. Type a text string to use as a prefix on messages sent by the log source. The maximum number of characters is 30. The string prefix is added to each syslog entry being forwarded. When you prefix a syslog entry, you can then easily search for a specific log entry based on the prefix. The default prefix is RVBD.
9. Select the minimum severity level for the log messages. The log contains all messages with this severity level or higher. Select a level from the drop-down list:
–0 - Emergency - Critical alerts, errors, and security events; the system is unusable.
–1- Alert - Action must be taken immediately.
–2 - Critical - Conditions that affect the functionality of the appliance or gateway.
–3 - Error - Conditions that probably affect the functionality of the appliance or gateway.
–4 - Warning - Conditions that could affect the functionality of the appliance or gateway, such as authentication failures.
–5 - Notice - Normal but significant conditions, such as a configuration change.
–6 - Info - Informational messages that provide general information about system operations. This is the default setting.
–7 - Debug - Debugging messages that provide general information about system operations.
10. Click Submit.
SCM pushes the configuration data to the SteelConnect appliances, and the appliances use this configuration to transport syslog messages to the remote syslog server.
Configuring TLS on the syslog server
Complete these steps on the local or remote syslog server when using TLS as the authentication process.
1. Open the syslog server’s /etc/rsyslog.config file and configure it for TLS mode.
2. Add the syslog server certificate and key path.
3. Add the path and port number for the appliance certificate generated by Riverbed core. (/etc/ssl/certs)
4. Restart the syslog service.
Viewing the Remote Log Server Configurations
When logging is disabled at the organization level, SCM displays the realm level remote server and status.
To view a list of remote log servers
1. Choose Health Check > Appliance Health.
2. Select an appliance.
3. Under Manageability, click the plus sign next to Management Interfaces.
Remote log servers appear with a description that includes the protocol, port, IP address, and reachability status. The status is updated every 300 seconds.
Remote log servers
NetFlow
NetFlow is a network protocol for the collection and monitoring of network traffic flow data generated by NetFlow-enabled appliances. Appliances running SteelConnect 2.12 can be enabled as flow exporters to export network flow information to a flow collector. In the flow exporter role, the appliances aggregate packet information into flows, and then export the flow records to one or more flow collectors using the IPFIX (IP Flow Information Export) protocol. For details on IPFIX, see
RFC5101.
The flow collector receives, stores, and preprocesses the flow data.
NetFlow monitors all traffic flows that enter and exit the appliances, including flows on the underlay, overlay, and local flows. These flow records provide a central monitor with the SteelConnect view of the network.
Configuring NetFlow for SteelConnect
You can enable NetFlow data export to a flow collector at the realm, organization, or appliance level. When NetFlow is enabled for an organization, the organization settings take precedence over the realm settings. For details on configuring NetFlow at the realm level, see
Exporting NetFlow data.
SteelConnect supports NetFlow exporting on the SDI-130, SDI-330, SDI-1030, virtual gateways, SDI-2030, SDI-5030, and SteelHead SD appliances.
For details on NetFlow configuration levels, see
Exporting NetFlow data.
Collectors
NetProfiler or third-party collectors can be configured using an IPv4 address or fully qualified domain name. You can configure a maximum of four NetFlow collectors (three collectors from either a realm or an organization and one from an appliance).
You can also configure one NetFlow collector on a single SDI gateway or SteelHead SD appliance. Typically, NetFlow export is enabled at the realm or organization level and you don't need to configure individual appliances. By default, NetFlow is enabled on individual appliances and becomes active when it is also enabled at the realm or organization level.
Notes
•An SDI-5030 gateway cannot reach collectors over the overlay or underlay across the WAN.
•When NetFlow is enabled on an appliance pair configured for high availability, the active appliance in the pair will export the flows.
•When SNMP is enabled, you might need to add or modify inbound (NAT) rules to accept SNMP requests from the collector hosts. For details, see
Policy controls.
•When NetFlow is enabled on a SteelHead SD appliance pair configured for high availability, the active appliance in the pair will export flows.
When SNMP is enabled, you might need to add or modify inbound (NAT) rules to accept SNMP requests from the collector hosts. For details, see
Policy controls.
To enable NetFlow export for an organization
1. Choose Organizations.
2. Select the organization.
3. Select the NetFlow tab.
NetFlow tab
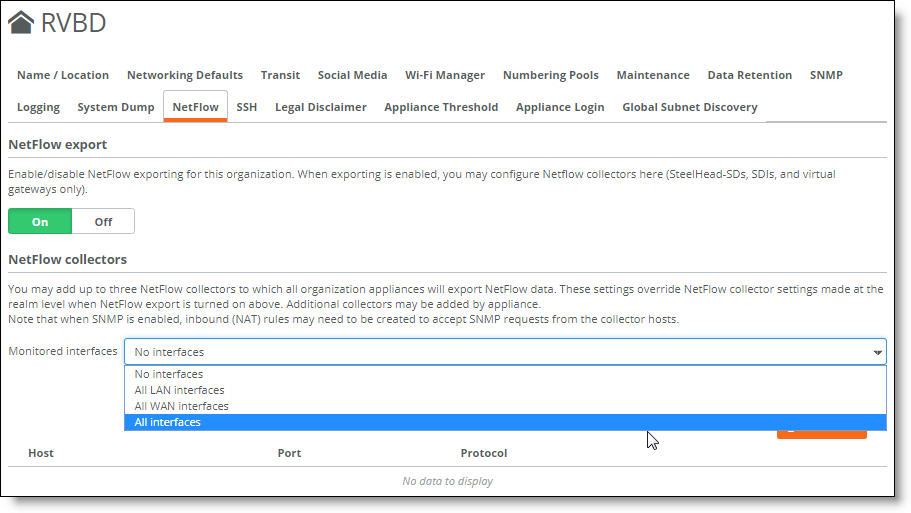
4. Under NetFlow export, click On.
The next step is to customize the monitoring to balance the level of visibility versus the amount of CPU load the appliances can handle.
5. Next to Monitored interfaces, select an option from the drop-down list.
–No interfaces - Do not monitor any interfaces. Monitoring is turned off.
–All LAN interfaces - Monitor all of the traffic that flows in or out of the appliance through the LAN. Includes all internal LAN traffic that is routed across VLANs. This option will not include the internal VLAN traffic routed by the hardware.
Because site-to-site traffic is already encrypted, IP addresses and ports will not be visible.
–All WAN interfaces - Monitor all the underlay and overlay flows from an uplink perspective.
–All interfaces - Monitor all LAN and WAN traffic. This option provides the most visibility, but increases the overall CPU load. VPN WAN monitoring excludes dedicated internet access (DIA) traffic.
On an SDI-5030 gateway, all interfaces are monitored and the other monitoring options do not apply.
6. Click Submit.
SteelConnect pushes the NetFlow configuration to all of the appliances in the organization. If NetFlow monitoring is disabled on an appliance, or if an appliance is running SteelConnect 2.11.x or earlier, it will not export NetFlow data.
To configure collectors for all gateways and appliances in the organization
1. Under NetFlow collectors, click Add Collector.
Adding a NetFlow collector
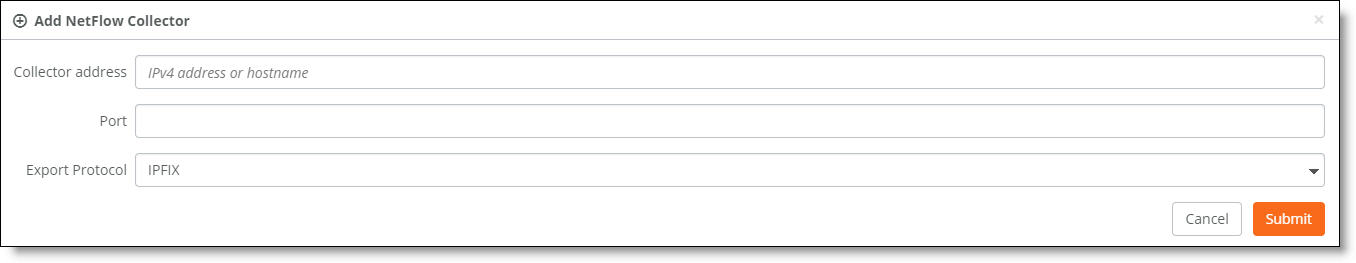
2. Specify the collector hostname or IPv4 address. If you specify a FQDN, the appliance will perform the DNS resolution at the time of export. Make sure that the DNS server can resolve the collector hostname.
3. Specify the UDP port the flow collector is listening on.
The exporter will iterate through the list of collectors when sending packets to the UDP destination.
The default protocol for exporting metrics for IP traffic flows is IPFIX. IPFIX is the only supported export protocol in SteelConnect 2.12. IPFIX flow records exported by the appliance are unencrypted.
4. Click Submit.
5. To configure collectors that use a different port, repeat
Step 1 through
Step 4.
To view a list of NetFlow collectors
1. Choose Organization and select the organization.
2. Select the NetFlow tab.
NetFlow collectors
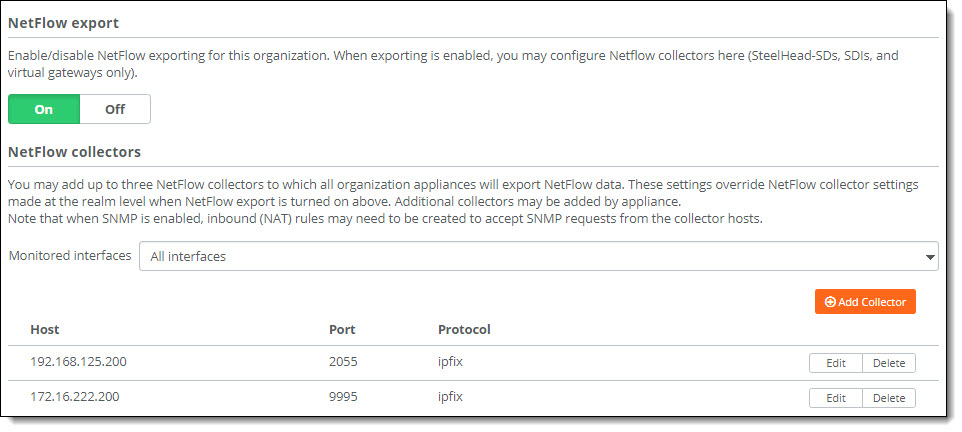
SCM displays the configured NetFlow collectors, the port the collector is listening on, and the default IPFIX export protocol. Any collectors configured at the appliance level do not appear.
To delete a NetFlow collector
1. Select the NetFlow tab.
2. Click Delete next to the collector.
3. Click Confirm.
To change a NetFlow collector host or port for an organization
1. Select the NetFlow tab.
2. Click Edit next to the collector.
3. Changes the settings and click Submit.
System dump collection and management
This section describes how to generate, upload, and manage system dump files.
System dump
A system dump file contains diagnostic information about the common hypervisor, Control VM (CVM), Routing VM (RVM), and Service VM (SVM) nodes of a SteelHead SD appliance and an SDI-2030 gateway. On an SDI-5030 gateway, the file also contains information about the Host VM (HVM).
This information is helpful when troubleshooting. For more information on SteelConnect components, see SteelHead SD Installation Guide.
The appliance uses secure FTP (SFTP) to upload system dumps securely to the external server.
By default, when you request a system dump, it is uploaded to support.riverbed.com. You can specify an external server to receive the system dump uploads instead of sending them to Riverbed Support.
We recommend that you generate system dumps at your convenience during off-peak hours to minimize demands on your computing environment.
To verify an appliance’s connectivity to support.riverbed.com, choose Health Check > Appliance Health, select the appliance, and click the plus sign (+) next to Management URLs.
In SteelConnect 2.11.x and earlier, a customer case number is required before you can trigger a sysdump. In SteelConnect 2.12, a customer case number is optional. When an SCM running 2.12 is connected to an appliance running 2.11.x or earlier and a sysdump is triggered without specifying a case number, the action will not complete.
To configure a system dump server
1. Choose Organization.
2. Select the organization.
3. Select the System Dump tab.
4. Under System dump server, click On to enable all system dump server configuration fields. By default, this setting is off.
System Dump tab at the organization level
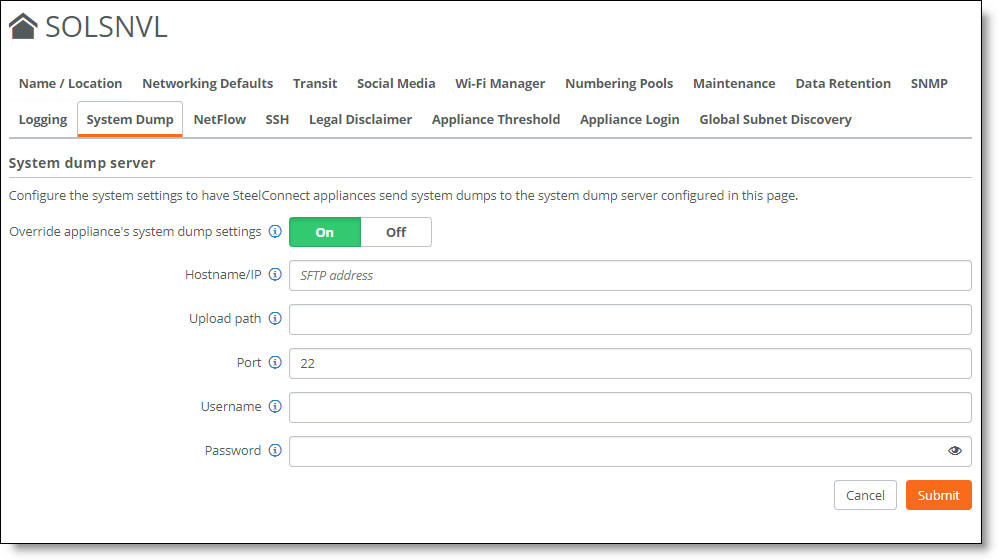
5. In the Hostname/IP field, enter the IP address or hostname of the SFTP server that will receive the system dump uploads.
6. In the Upload path field, enter the absolute path name of the directory where SCM will copy the system dump.
7. In the Port field, enter the port number of the SFTP server. The default setting is 22.
8. In the Username field, enter the username to log in to the SFTP server.
9. In the Password field, enter the password to log in to the SFTP server.
10. Click Submit.
The SFTP server appears.
To trigger a system dump from an appliance
1. Choose Appliances > Overview.
2. Select an appliance.
3. Select the System dump tab.
System dump tab at the appliance level
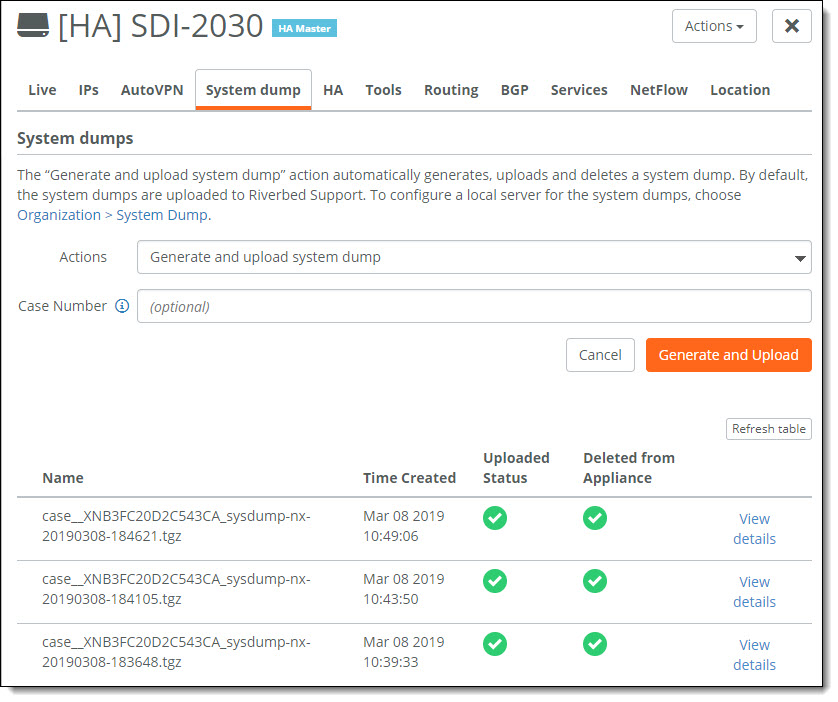
System dump is supported on the SDI-2030 gateway, SDI-5030 gateway, and SteelHead SD appliances. On the SDI-130, SDI-330, and SDI-1030 gateways, the System dump tab is dimmed and unavailable.
4. Select Generate and upload system dump from the drop-down menu.
5. Optionally, enter a case number.
6. Click Generate and Upload.
SCM generates the system dump, which can take up to ten minutes depending on the appliance model. The bottom of the page displays statistical data about the latest systen dumps generated for the appliance.
Managing system dumps
An appliance can store up to five system dumps at a time, but it’s unlikely to ever reach that limit. By default, when you create a system dump through SCM, it uploads to riverbed.support.com or a configured system dump server and deletes it from the appliance. The system dumps stored on the appliance include only those for which a previous upload and delete attempt had failed and those triggered without the options for upload and delete (by entering the
sysdump CLI command). For details, see
sysdump.
To view more details such as case number (if provided), sysdump name, file size, and more, click View details.
View details
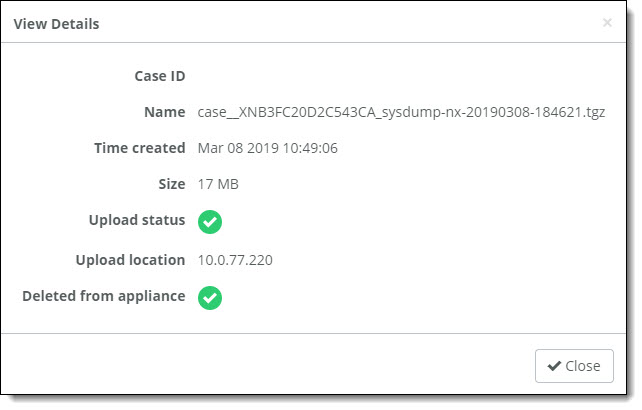
If there are already five system dumps stored on the appliance and you request a new system dump, SCM will attempt to overwrite the existing system dumps. First, it determines if any of the existing system dumps have already been uploaded to a URL and are stored on the appliance only because the subsequent attempt to delete the system dump failed. If it finds a system dump that has already been uploaded, it will delete it and then trigger the new system dump.
If SCM doesn’t find any existing system dumps that have already been uploaded, it displays a message asking you to upload or delete one.
To create available space on the appliance
1. Choose Actions.
2. Select Upload or Delete.
3. Select the system dump.
To update the system dump details
•Click Refresh table.
Troubleshooting command
When a SteelConnect gateway or SteelHead SD appliance is unable to reach SCM, we recommend that you access the appliance through its serial console port and enter the troubleshoot command from the Control VM (CVM), which is the default setting, or the hypervisor.
Entering the
troubleshoot command from the hypervisor provides status such as CVM image presence, hypervisor bootup, flow switch status, and so on. In the case of a failure, the output includes next steps. For example, if the core resolution DNS test fails, the output suggests that you “Check DNS server health and verify if it is listening on port 53” as the next step. For details, see
troubleshoot.
Export troubleshooting logs
How can I export troubleshooting logs to a USB drive?
After entering the troubleshoot command, you can write the results into a troubleshooting log and then export the log to a USB drive for analysis by Riverbed support.
To export troubleshooting logs
1. Insert the USB drive.
2. Enter the following CLI command:
troubleshoot hyp [run | export | logfile <filename> | ls <filename>]
3. When the transfer is complete, the message "Troubleshoot logs copied to USB successfully" appears and the log file is copied to the USB drive. The logfile in .tgz format is stored in top level directory on the USB drive.
4. Remove the USB drive.
Show Path tool
The Show Path tool displays the potential paths for a given destination prefix. For active flows, it shows which path a flow is currently using.
The Show Path tool answers these questions:
•Where is the traffic from this appliance to a destination host or IP address supposed to go?
•Where is the traffic going now?
The Show Path tool is supported on SteelHead SD 570-SD, 770-SD, and 3070-SD appliances and SDI gateways.
To show all possible paths for a destination
1. Choose Appliances and select a gateway or appliance. You can select any gateway or appliance within an organization. The gateway or appliance must be online, registered with SCM, and assigned to a site; offline and shadow appliances are dimmed and unavailable.
2. Select the Tools tab.
3. Under Utilities, select Show Path from the drop-down menu.
Show path test
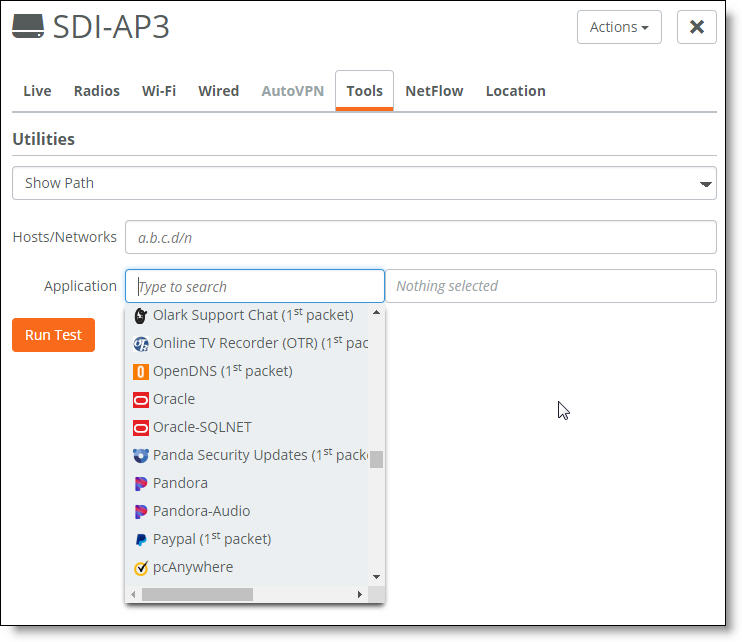
4. In the Hosts/Networks field, enter a destination hostname or network IP address. This is the destination to which you are looking for potential paths. The destination prefix is restricted to /24 through/32.
When you enter a destination prefix without specifying an application, SteelConnect filters the overlay, underlay, and active flows for the application.
5. Optionally, in the Application field, click the search selector to select an application from the drop-down list or enter an application name. Use this field to filter the current connections for a specific application.
–You must select an individual application; application groups are not allowed.
–When you select an application without specifying a destination prefix, SteelConnect filters the active flows for the prefix.
–To delete an application from the test, click the trash can icon.
6. Click Run Test.
SteelConnect searches for all possible paths and traffic flows for that destination and the application, if specified.
SCM shows the message “Waiting for Packet Path results” before the response appears.
Response times will be affected by the load on the appliance, and the response times for different appliances will vary. If you run the Show Path tool continuously, you might see different response times from the same appliance.
Show Path tool
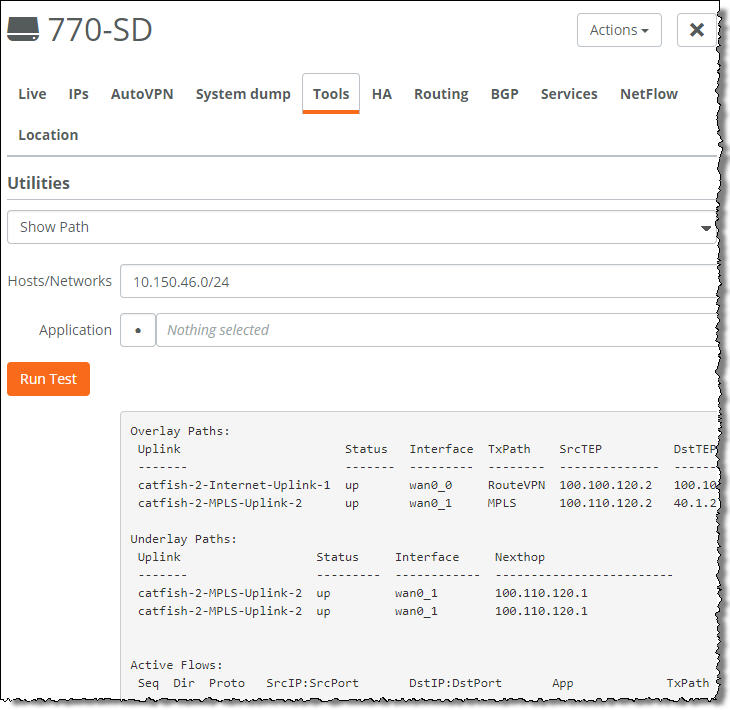
Show path output
The Show Path test displays details for up to 50 active flows. When there are more than 50 flows for this filter, a message tells you that they can’t all be shown. To view up to 100 flows, enter this CLI command (SteelHead SD, SDI-2030 and SDI-5030 gateways only):
show paths [options] [dst_prefix <prefix | <host> | appid <id>]
For CLI command details, see
show path.
Show Path output
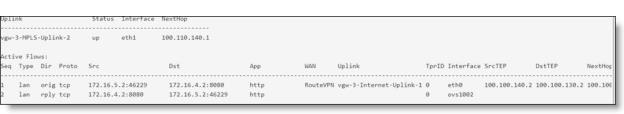
For active flows, the output shows the active paths and their possible paths, including:
•Traffic flow direction
•Protocol
•Source and destination IP addresses
•Source and destination port IP addresses
•Source and destination tunnel endpoints
•Traffic path rule ID
•WAN (TX) path
•Application
For an overlay tunnel, the output shows:
•Uplink
•Tunnel status
•Inbound and outbound interfaces
•WAN (TX) path
•Source and destination tunnel endpoint (TEP) addresses
For the underlay, the output shows:
•Uplink and uplink status
•Interfaces
•Next-hop IP address
The settings from the previous test remain in place the next time you return to the Tools tab.
Show path output limitations
•The destination prefix is restricted to /24 or a more specific prefix.
•When only a destination prefix is specified, the output includes all possible paths for that destination and all flows for that destination.
•When only an application ID is specified, the output displays paths and flows only when there are flows on that application. If there are no flows on the application, there is no output.
•When both the destination prefix and the application ID are specified, the output displays all possible paths and active flows for that destination prefix and application ID. If no flows for the application are present, the output shows all possible paths based on the destination prefix.
•Transit or multiple hop use cases are not supported. For every flow, SCM shows outgoing and incoming WAN data.
•IPv6 is not supported.
•Overlay paths don’t include path metrics.
Connectivity tests
The Ping and Traceroute tests are useful to determine if a destination is reachable.
•Ping - Verifies reachability by sending ICMP packets from an appliance to a host on an Internet Protocol (IP) network.
•Traceroute - Sends a sequence of User Datagram Protocol (UDP) packets between two points and shows you the route the packets take. Traceroute also measures the transit delays of packets across an IP network.
If the destination is unreachable, the tests report where the connection failed.
The SteelHead SD 570-SD, 770-SD, and 3070-SD appliances and the SDI-2030 and SDI-5030 gateways don’t support the ping or traceroute tests.
We recommend using the ping or traceroute tests to verify connectivity, followed by a packet capture or an echo test to dive deeper into troubleshooting. See
Packet capture and
Echo test.
To run a ping or traceroute test
1. Choose Appliances and select a gateway. You can select any gateway within an organization. The appliance must be online, registered with SCM, and assigned to a site; offline and shadow appliances are dimmed and unavailable.
2. Select the Tools tab.
Tools tab
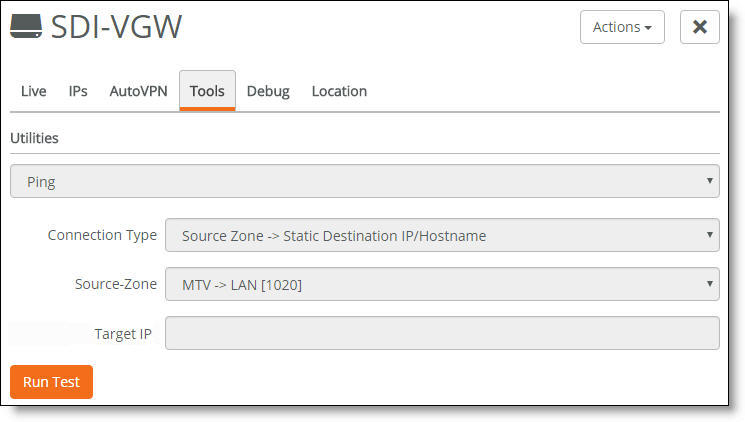
3. Select Ping or Traceroute from the drop-down menu.
4. Select a connection type from the drop-down menu:
–Source uplink and static destination IP address or hostname.
–Source uplink to a destination uplink.
–Source zone to a static destination IP address.
The display changes depending on the connection type.
–If you’re testing an uplink to a static destination, select the uplink from the drop-down list and type the IP address or hostname.
–If you’re testing an uplink to an uplink, select the source uplink, appliance, and destination uplink from the drop-down lists.
–If you’re testing a source zone to a static destination, select the source zone and uplink from the drop-down list and type the IP address.
Ping and traceroute tests from a source zone using the GUI work differently than ping and traceroute tests from a source zone using the CLI. When you select a source zone from the GUI, the gateway allocates an additional interface with an IP address in the selected zone and runs the ping or traceroute from it. This additional interface emulates the traffic path that a host in the same subnet takes, which might be different than the path the packets take when originating from the gateway.
The gateway must be able to allocate a free IP in the selected zone. If your zone only has a /30 subnet, or all IP addresses are in use, the ping or traceroute will fail and display an error message such as "Ping could not complete."
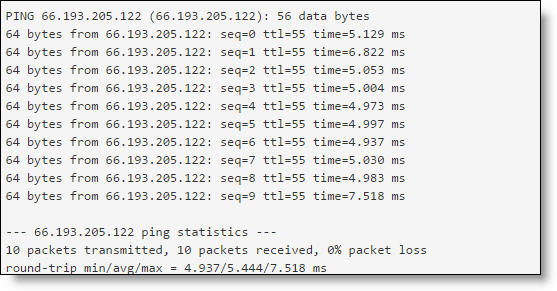
5. Click Run Test.
The test response appears.
Ping test response
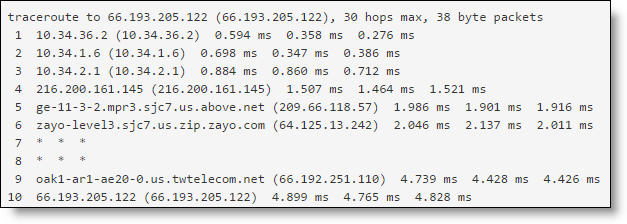
Traceroute test response
The settings from the previous test remain in place the next time you return to the Tools tab.
Packet capture
You can request an on-demand packet capture for a gateway and download the capture file from the Tools tab. Capture files contain summary information for every internet packet received or transmitted on the appliance interface to help diagnose problems in the system.
The SteelHead SD 570-SD, 770-SD, and 3070-SD appliances and the SDI-2030 and SDI-5030 gateways don’t support packet capture.
To perform a packet capture
1. Choose Appliances and select a gateway. The gateway must be online and registered with SCM; offline and shadow appliances are dimmed and unavailable.
2. Select the Tools tab.
3. Select Packet Capture from the drop-down menu.
4. Select a physical target port (Management, WAN, or LAN) from the drop-down list.
LAN ports must be configured as an uplink to appear on the drop-down list.
5. Optionally, specify the snap length value, in bytes. The snap length equals the number of bytes of each packet to be captured. Specify 1500 for a full packet capture. The default value is 500 bytes per packet.
6. Optionally, specify how long the capture runs, in seconds.
The packet capture typically completes within 90 to 100 seconds and times out after 120 seconds.
SCM and the gateway work together to provide a best-effort service. SCM sends the snap length and time for capture on a particular port to the gateway. The gateway attempts to capture packets on that port until either:
–500 packets are captured (each packet will contain bytes of data set by the snap length value)
Or
–The capture time is reached.
The packet capture stops when one of these criteria is reached, whichever occurs first. For example, on a very busy port (a port where many packets are flowing) the system might always hit the 500 packet boundary but never reach the capture time. On a relatively idle port, the system might reach the capture time after capturing only 300 packets.
7. Click Run Test.
A message reports the test status.
8. Click Download Capture File to view the results of a successful packet capture.
Echo test
The echo test dives deeper into troubleshooting by testing network connectivity between a client-side and a server-side zone using a TCP port number and the TCP protocol. The echo test tells you if the communication from appliance A to appliance B is crossing the network overlay.
The SteelHead SD 570-SD, 770-SD, and 3070-SD appliances and the SDI-2030 and SDI-5030 gateways don’t support the echo test.
To run an echo test
1. Choose Appliances and select a gateway. The gateway must be online and registered with SCM; offline and shadow appliances are dimmed and unavailable.
2. Select the Tools tab.
3. Select Echo Test from the drop-down menu.
4. Select a primary zone from the drop-down menu.
5. Select a secondary appliance on the other side from the drop-down menu.
6. Select a secondary zone on the other side from the drop-down menu.
7. Specify a TCP port number from 1 to 65535.
8. Click Run Test.
Support package
A support package offers appliance status information in a single JavaScript Object Notation (JSON) file that you can view in SCM or download.
To generate a support package
1. Choose Appliances.
2. Select an appliance.
You can’t generate a support package for SDI-2030 and SDI-5030 gateways or SteelHead SD 570-SD, 770-SD, and 3070-SD appliances. For these appliances, generate a system dump as described in
System dump collection and management.
3. Click Live or select the Debug tab.
4. Click Request to generate a support package.
The Event log reports the request for a support package.
After the support package is generated, you can view it in SCM or download it as a JSON file. The package is categorized by diagnostic commands and categories. From SCM you can collapse or expand the output for each command or category.
Requesting another support package overwrites any previous support package output.
To view a specific support package category without downloading the JSON file
1. If you requested a support package from the Live tab, select the Debug tab.
The Debug tab
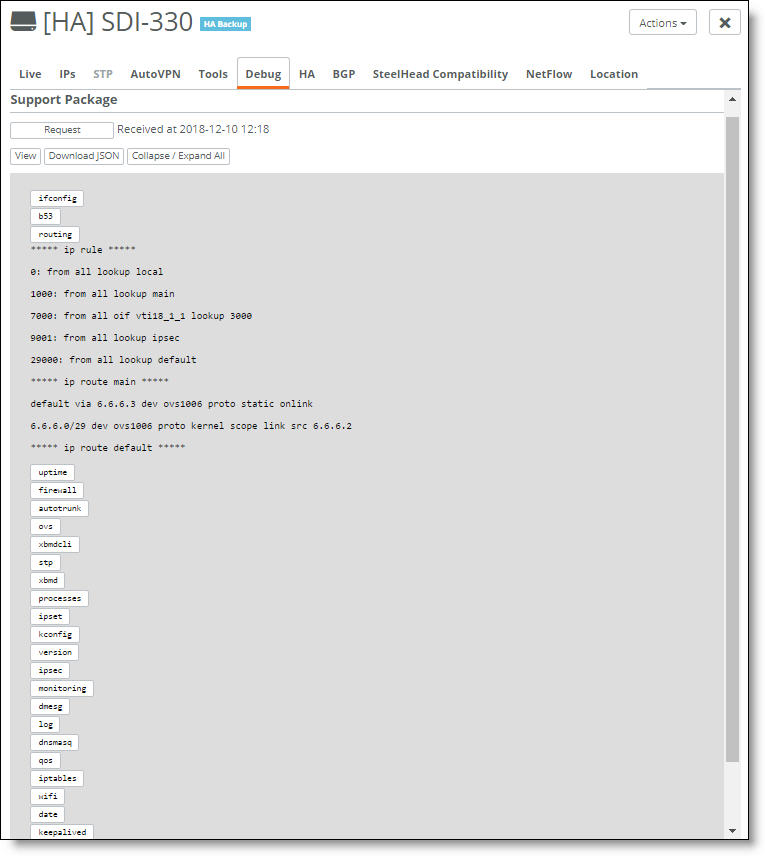
You can copy and paste the output from the Debug tab for use in another application.
2. Click a category to filter the output.
Category | Description |
routing | Shows the current IP routing table. |
monitoring | Shows the results from system monitoring, such as uplink configuration. |
wifi | Shows the Wi-Fi status, such as whether an SSID is broadcasting, and includes information about wireless interfaces. |
swconfig | Shows the appliance software configuration and status. |
version | Shows the current firmware version. |
autotrunk | Shows the interconnected trunking between two gateways. |
dmesg | Shows the message buffer of the kernel. The output of this command contains the messages produced by the device drivers. |
ipsec | Shows the IPsec encryption tunnel status, including endpoints, virtual IP pools, the IKE daemon status, and more. |
iptables | Shows the filter table rules in place to allow and block traffic and the network address translation (NAT) table rules in place to rewrite packets, allowing NAT. Includes the chain prerouting, input, output, and post routing. |
ifconfig | Shows the appliance interface(s) information, such as configuration, packets received and transmitted, statistics, and status. |
qos | Shows the Quality of Service (QoS) statistics. |
lldpctl | Shows information about the Link Layer Discovery Protocol. |
ovs | Shows the current state of an OpenFlow switch, including features, configurations, table entries, and the configuration database entries. |
uptime | Shows the system uptime in 24-hour format, a timeframe of how long the system has been running, and the average system load. For the system load output, translate the two decimal points as a percentage. For example, 0.25 means 25% and 0.19 means 19%. The sequence 0.25, 0.25, 0.19 represents the load over the past 1 minute, 5 minutes, and 15 minutes. Lower numbers mean better system performance. |
processes | Shows the current running processes. |
log | Shows the last 1000 entries of the appliance log. |
To expand or collapse the display
•Click Collapse/Expand All to toggle the view for the entire output.
•Click an output category to toggle the view for that category.
To download the JSON file
•Click Download JSON.
You can open the file in any JSON file viewer.
If the View, Collapse/Expand All, and Download JSON buttons aren’t visible, request another support package. After the support package is generated, the buttons appear.
Appliance configuration
How can I tell if the appliance configuration is up to date?
•Choose Appliances > Overview.
Under the Config column, “Up-to-date” indicates that the latest configuration was applied successfully.
Provisioning
How do I get an appliance to show up in SCM?
Check for firewalls. In most cases, the first provisioning fails due to local firewall restrictions for TCP port 3900 and 3902.
For a gateway, make sure that internet connectivity and a DHCP server are available on the WAN port of the gateway to allow the first provisioning to succeed. While booting up, one green LED of the gateway will glow as long as a connection to SCM was established successfully. Glowing will stop in normal operation mode.
An access point appliance attempts to receive an IP address through DHCP from the zone automatically. Make sure that you have added your SSIDs (choose Wi-Fi) and then assign the SSIDs to sites (choose Wi-Fi > Broadcasts). All access points in a site will broadcast the SSIDs as configured in the Wi-Fi section.
While booting up, two LEDs (green and orange) on the access point blink as long as a connection to SCM was established successfully. Blinking stops in normal operation mode.
If the appliance comes online but the VPN tunnels aren’t established, make sure UDP/4500 inbound is allowed for the appliance.
How do I bring an appliance online?
•If the IP address configuration through DHCP fails, check your DHCP server. The DNS resolution of core.riverbed.cc should resolve to 82.115.105.183.
•Connect to YourCC.riverbed.cc via TCP Port 3900 and 3902, and enter the telnet command:
telnet YourCC.riverbed.cc 3900
telnet YourCC.riverbed.cc 3902
Zscaler
For troubleshooting solutions, see
Troubleshooting Zscaler tunnels.
Multiple DNS servers for a site
What is the format for entering more than one DNS server for a site?
Separate the servers by a space: for example, 208.67.222. 123 8.8.8.8.
Uplink subnet mask format
What is the format for specifying a subnet mask on an uplink?
The uplink subnet mask format is xxx.xx.xxx.xx/xx. For example: 121.73.131.14/16.
VPN
Why is AutoVPN not working?
AutoVPN is enabled by default and provides connectivity between sites on the same organization. In each site there can be only one appliance acting as an AutoVPN endpoint.
The VPN appliance should ideally be the gateway for this site or placed in-path to pass all traffic entering and exiting the site.
If AutoVPN is down, check the uplink status and cabling, and check the tunnel.
To check the uplink status and cabling
1. Choose Network Design > Uplinks.
2. Select an uplink to view the status. Are any appliance uplinks reported as off-line?
3. Select Ports to verify that the port is online and within capacity and error thresholds.
To check the tunnel
•Check that the uplinks and appliance status are online.
•Log in to both affected gateways to verify that a tunnel is established.
•Check the IPsec ports via IPsec debugging to see whether inbound IPsec/IKE packets are received.
•Ensure you can reach UDP ports 500 and 4500 on the remote gateway.
Wi-Fi
Why are clients not receiving IP addresses via DHCP in guest zone SSID?
•Choose Wi-Fi > Broadcasts to check the broadcast SSIDs for the zones.
•Choose Appliances > Overview and check the access point’s wired configuration mode. Check that the access point port LAN port is set up correctly. It needs to be set up in multizone if more than one Wi-Fi is broadcast.
Why is the wireless client roaming inefficiently?
Roaming behavior depends on the wireless client’s network adapter. Some manufacturers such as Intel provide documentation regarding roaming behavior:
If the wireless client is roaming inefficiently, check the signal strength and quality first and verify if the issue is persistent on other devices as well.
Access points
Can I run an access point without a SteelConnect gateway?
Yes, you just need to ensure that there is a DHCP service running in the configured access point zone to provide IPs to the wireless client services.
When no gateway is present, internal servers need to provide network services like DHCP.
If you want to use different broadcasts with more than one zone (VLAN) for your Wi-Fi networks, make sure that the access point is attached to a VLAN-capable switch.
Recovery mode
What does it mean when an appliance is in recovery mode?
Recovery mode is a mechanism used by the appliance in an attempt to restore communication to its SCM controller when an uplink is not working, usually due to a misconfiguration.
The WAN ports on the SDI gateway go into recovery mode approximately five minutes after communication is lost to its SCM controller. In recovery mode, the WAN port receives an IP address through DHCP and then uses this IP address to reach SCM. The last working WAN configuration is restored after 15 minutes if a configuration change has broken the SCM connectivity.
If recovery mode does not work, you can also restore the gateway using an off-line USB method. For details, see
How do I provision a gateway offline?.
Do SDI gateways and SteelHead SD appliances behave differently in recovery mode?
Yes, there are subtle differences. When a SteelHead SD appliance is in recovery mode, it doesn’t automatically restore the configuration. It stays in recovery mode until there’s a configuration change on SCM.
A SteelHead SD appliance in recovery mode attempts to connect to the SCM with the last working configuration and might use a site-level or default DNS server to resolve SCM.