Network Visibility
The Visibility menu item is where you can read event logs, view a traffic timeline, and view a history of the DHCP server IP address assignments.
Viewing a traffic timeline
To view a traffic timeline
1. Choose Visibility > Traffic Timeline.
The traffic timeline provides network visibility
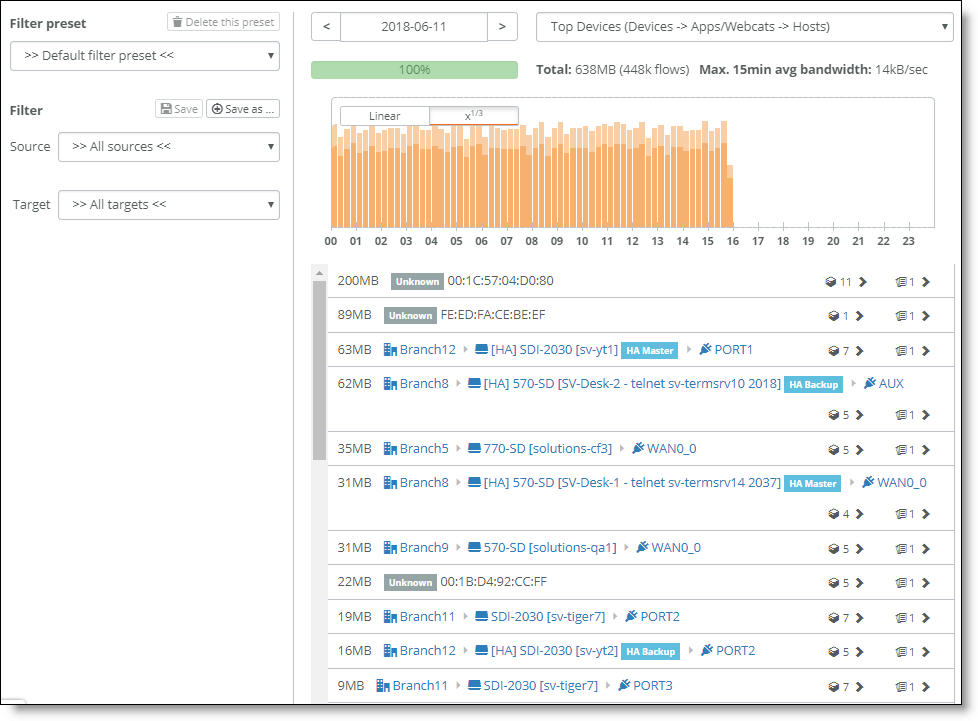
The timeline shows you everything that happened today in the network for a particular site or companywide.
2. Filter to view all the traffic for your headquarters, all the devices, and all the hosts accessed during the day.
3. To view activity by application groups, such as all social networking activity, choose the group: for example, Social Networking.
4. To view a certain slice of the day to identify the cause of traffic spikes or other anomalies, click the traffic activity graph.
Click and drag the mouse to select multiple slices.
Viewing the event log
You can use the event log to track a number of events occurring across a network; for example, you can track exactly which user has done what at what time, or you can monitor the link state for online appliances. The event log reports on events approximately every 5 seconds.
The event log does not receive events while an appliance is offline.
To view configuration changes
•Select Visibility > Event Log.
The event log tracks administrator activity and appliance link state
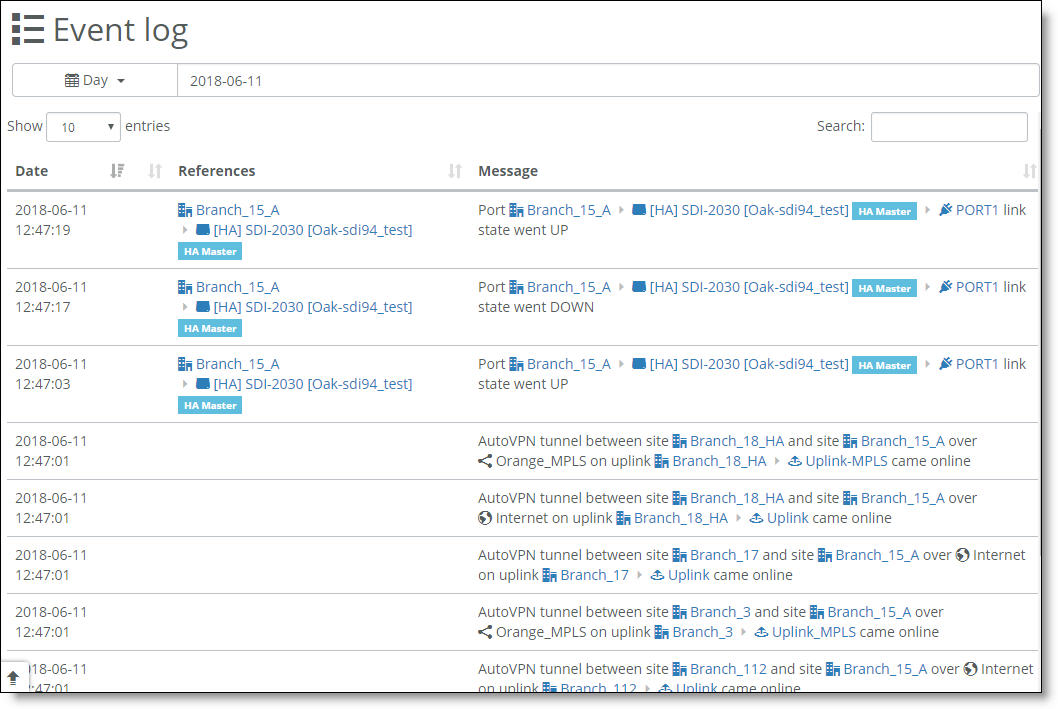
A log displays all activity performed by system administrators in any office and in any location. The event log conveys a lot of information about events SCM is detecting. The best way to narrow the log is to use the search field.
Because a tunnel is always bidirectional, the log message “AutoVPN tunnel between X and Y came online” also means the tunnel between Y and X came online.