Expanding the Health Check page
Field | Description |
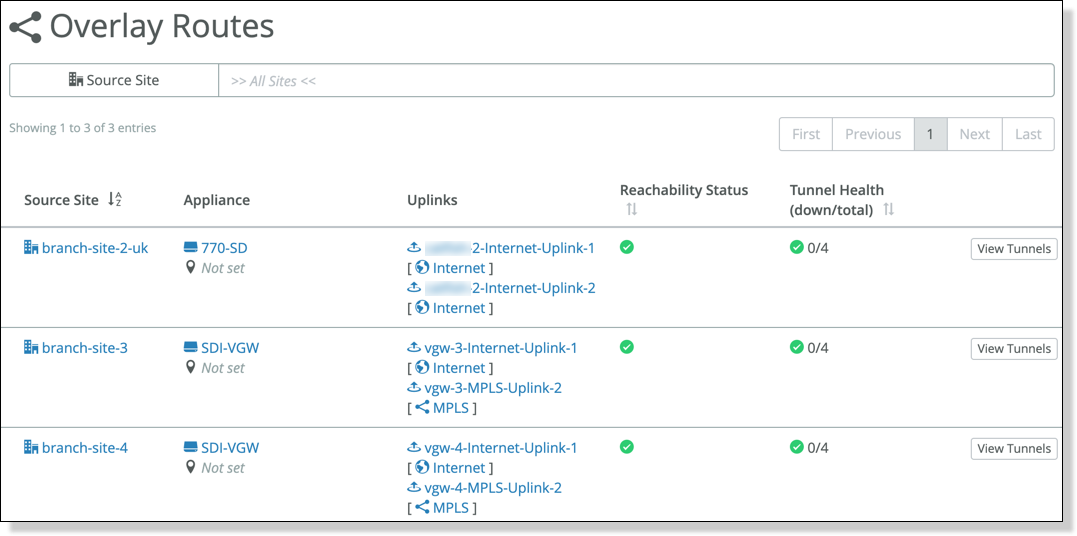
Source Site | The name of the source site. |
Appliance | The name and type of appliance. |
Uplinks | The uplink names. |
Reachability Status | The reachability status of the site.  Up - At least one tunnel from this site is up. Up - At least one tunnel from this site is up. Down - All tunnels are down. Down - All tunnels are down. |
Tunnel Health | Displays an icon with the overall tunnel statistics. Up - All tunnels are up. Degraded - One or more tunnels are down. The number of down tunnels out of all tunnels appears.Down - All tunnels are down. Degraded - One or more tunnels are down. The number of down tunnels out of all tunnels appears.Down - All tunnels are down. |
Field | Description |
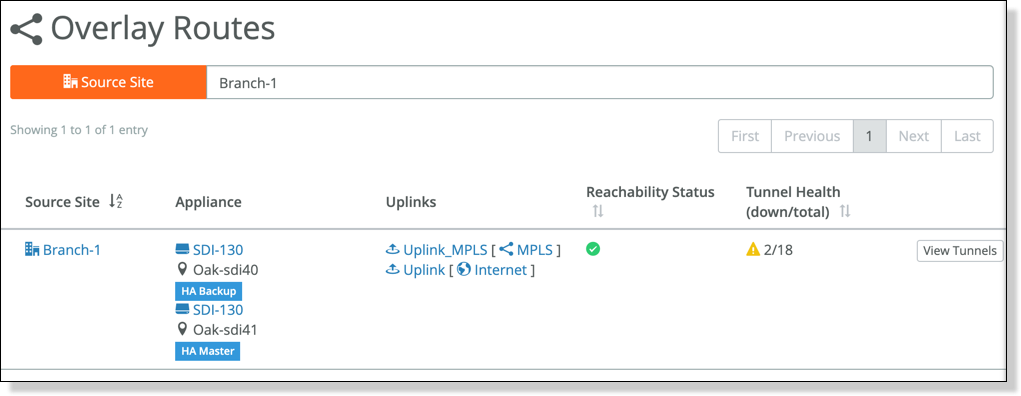
Source Site | The name of the source sites. |
Appliance | The name and type of appliance. |
Uplinks | The uplink names. |
Reachability Status | The reachability status of the overlay tunnels between sites. Up - All tunnels are up.Down - One or more tunnels are down. |
Tunnel Health (down/total) | The tunnel health of the overlay tunnels between sites. Up - All tunnels are up.Degraded - One or more tunnels are down. The number of down tunnels out of all tunnels appears.Down - All tunnels are down. |
Field | Description |
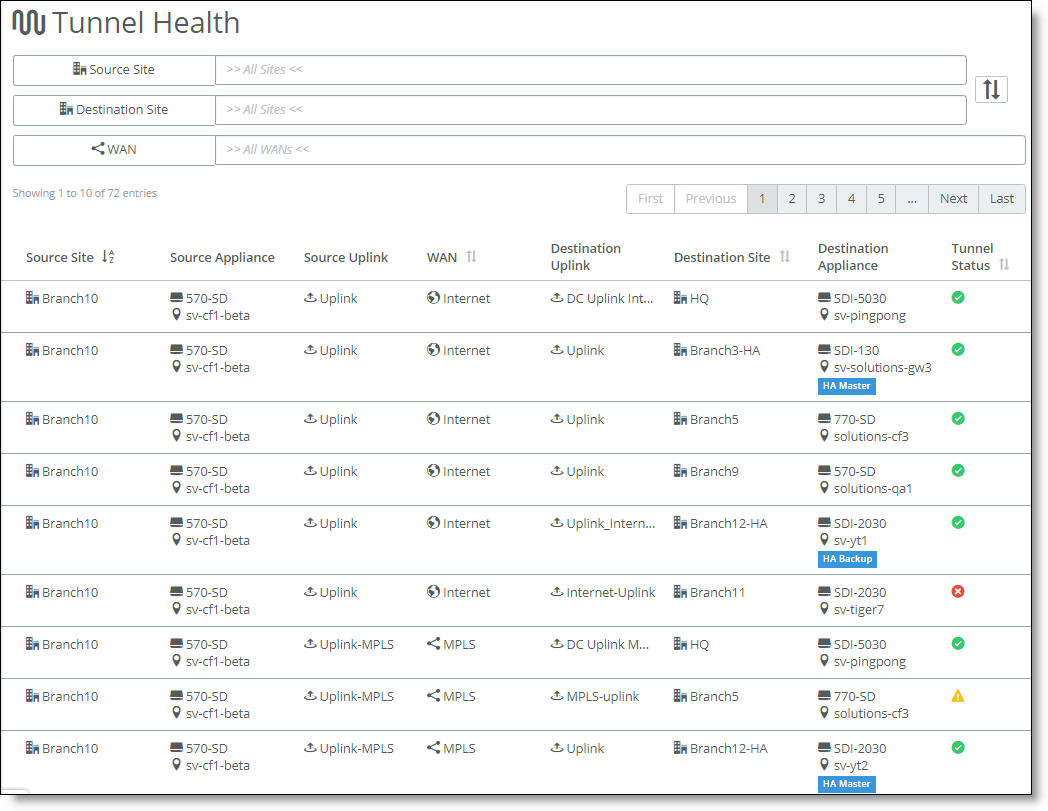
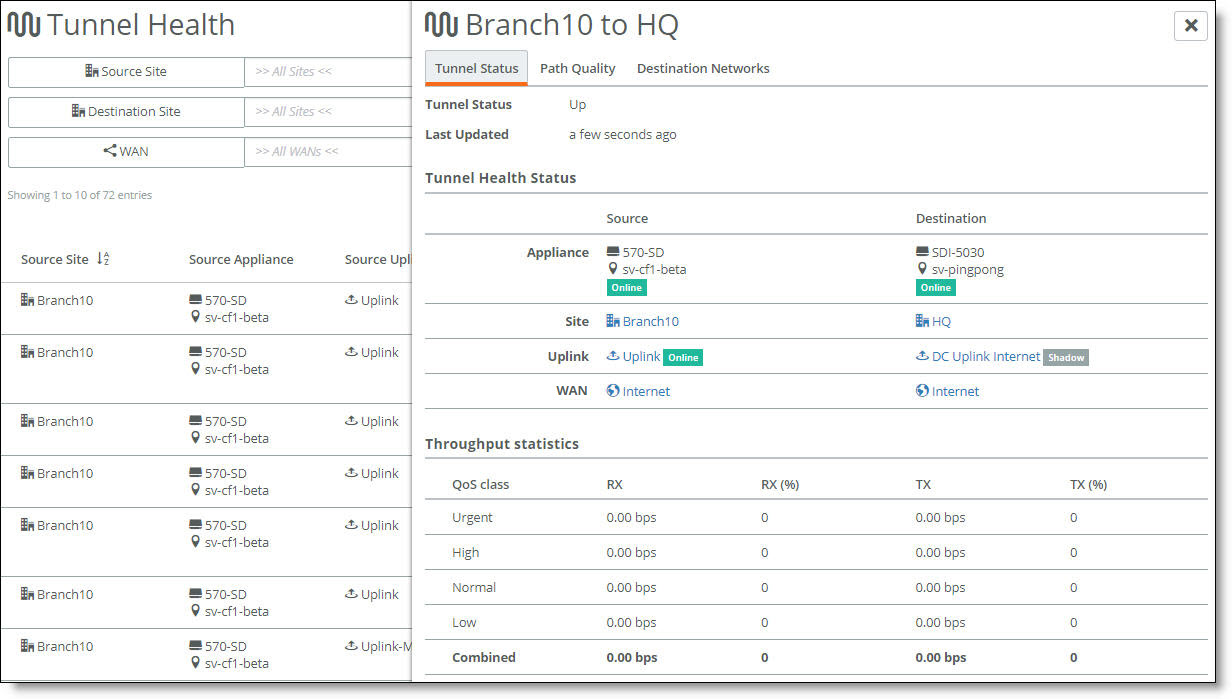
Source | Shows the name of the source appliance, site, uplink, and WAN. |
Destination | Shows the name of the destination appliance, site, uplink, and WAN. |
Field | Description |
QoS class | The QoS priority: Urgent, High, Normal, or Low. |
RX | The received tunnel speed in bits per second since the last time the statistics were cleared. |
RX (%) | The percentage of RX (bps) within each QoS class. In the Combined row, the percentage value of this field should be 100%. |
TX | The transmitted tunnel speed in bits per second since the last time the statistics were cleared. |
TX (%) | The percentage of TX (bps) within each QoS class. In the Combined row, the percentage value of this field should be 100%. |
Field | Description |
Path quality | The overall path quality (Excellent, Good, Fair, or Poor), derived from the threshold values used by the appliances to apply path selection. SteelHead SD appliances use the Common Applications Kept Enhanced (CAKE) scheduler, and these values aren’t configurable. For more details about CAKE, see How does QoS for gateways work?. |
Last Updated | The last time the path quality statistics were updated. |
QoS class | The QoS priority: Urgent, High, Normal, or Low. |
Latency Round Trip (ms) | The amount of delay for a packet traveling from one site to another and back again. |
Jitter (ms) | The amount of change in one-way packet delay. When the exact amount of delay occurs from one site to another, there is zero jitter. When the delay is inconsistent, jitter is the amount of delay that varied from previous measurements. Jitter is most likely to occur on either slow or heavily congested links. |
Packet Loss (%) | Shows any one-way packet loss. Any number indicates a possible problem. |
Field | Description |
Destination networks reachability | Displays the number of destinations that are not reachable. |
Last Updated | The last time the destination network statistics were updated. |
IP Address | The IP address of the destination network. |
Status | The reachability status of the destination networks. Up - At least one tunnel to this destination network is up.Down - All tunnels are down. |
Field | Description |
Tunnel Status | Indicates the health state.  Online - The tunnel is online. Online - The tunnel is online. Offline - The tunnel is offline. Offline - The tunnel is offline. |
Gateway Status | Shows the gateway status. Online - The gateway is online.  Offline - The gateway is offline. Offline - The gateway is offline.  Disabled - The uplink did not yet report reachability, or it belongs to the backup high availability (HA) partner in dedicated uplink mode, or it hasn’t been associated with any appliance. Disabled - The uplink did not yet report reachability, or it belongs to the backup high availability (HA) partner in dedicated uplink mode, or it hasn’t been associated with any appliance. |
Field | Description |
Appliance | The appliance’s name. |
Model | The model of the appliance. |
Site | The site where the appliance is deployed. |
Local AS | The local autonomous system (AS) number. |
Peer | The name of the peer. |
Peer IP | The IP address of the peer. |
Remote AS | The remote AS number. |
Status | The appliance’s status (Online, Offline, or Recovery). |
Peer State | The peer state (Idle, Connect, Active, OpenSent, OpenConfirm, or Established). |
Field | Description |
Destination | The BGP destination and subnet. |
Next-Hop | The IP address of the next hop. |
AS Path | The AS path. |
Metric | The BGP metric. |
Weight | The BGP weight. |
Field | Description |
Network | The BGP network. |
Mask | The BGP mask. |
Field | Description |
Appliance | The appliance’s MAC address. All appliances in the organization are listed in this table. |
Model | The model of the appliance. |
Site | The site where the appliance is deployed. |
Neighbors | The total number of neighbors that have been configured by the appliance. |
Routes learnt | The number of routes that have been learned by the appliance. |
Status | The appliance’s status (Online, Offline, or Recovery). |
Field | Description |
Appliance | The appliance serial number. |
Model | The appliance model. |
Site | The site where the appliance is deployed. |
OSPF Neighbors table | |
Neighbor ID | The neighbor’s ID. |
Neighbor IP | The neighbor’s IP address. |
Area | The OSPF area ID. |
Local Interface | The interface on the appliance that is running the OSPF protocol. |
State | The current state of OSPF while it is forming an adjacency with its neighbor: •Down - Appliances that intend to establish full OSPF neighbor adjacency prepare to become neighbors by exchanging OSPF Hello packets. •Init - The neighbor building process is beginning because an appliance has received a Hello from a potential neighbor but has not yet seen its own router ID in the neighbor Hello packet. •2-Way - An appliance sees its own router ID in the Hello packet received from the neighbor. If essential configuration values match, appliance 2 will add appliance 1 to its neighbor table and reply with its Hello packet. Appliance 1 will in turn take action on appliance 2’s reply. Bidirectional communication with the neighbor has been established. •ExStart - A master, a backup, and the initial sequence number are elected. •Exchange - The appliances decide how much information needs to be exchanged. •Loading - Routing information is exchanged. •Full/DR - The appliances have exchanged and synchronized routing information and formed an adjacency. OSPF is fully functional. The OSPF neigbor is the designated router (DR).` •Full/Backup - The appliances have exchanged and synchronized routing information and formed an adjacency. OSPF is fully functional. The OSPF neigbor is the backup designated router (BDR). |
Field | Description |
OSPF Learned Routes table | |
Destination | The routing destination. |
Next-Hop | The next-hop router’s IP address. |
Cost | The routing metric used in the link-state calculation to determine ideal routes. |
Type | The routing type. •NA - A directly connected OSPF route. •External E1 - An OSPF External Type 1 route. •External E2 - An OSPF External Type 2 route. •NSSA N1 - An OSPF not-so-stubby area (NSSA) Type 1 route. •NSSA N2 - An OSPF NSSA Type 2 route. |
Field | Description |
Appliance | The MAC address of the appliance. All appliances in the organization are listed in this table. |
Model | The model of the appliance. |
Site | The site where the appliance is deployed. |
Number of entries | The number of FIB table entries per appliance. |
Status | The appliance’s status (online or offline). |
Field | Description |
Destination | The FIB destination and subnet. |
Next-Hop | The IP address of the next hop. |
Metric | The routing metric for the route. |
Route Type | How the route was learned by the appliance. •CONNECTED - A directly connected route. •BGP - This route was learned by BGP. •OSPF - This route was learned by OSPF. |
Route Subtype | Additional information about the route. •NA - A directly connected OSPF route. •E1 - An OSPF External Type 1 route. •E2 - An OSPF External Type 2 route. •N1 - An OSPF not-so-stubby area (NSSA) Type 1 route. •N2 - An OSPF NSSA Type 2 route. |
Field | Description |
WAN | The type of WAN (Internet or MPLS). |
Type | The type of uplink (static IP, DHCP client, Point-to-Point Protocol over Ethernet [PPPoE], or Point-to-Point Tunneling Protocol [PPTP]). |
Uplinks | The total number of uplinks. |
Operation | Indicates the health state. Ready - The WAN is healthy.  Degraded - The WAN needs attention. Degraded - The WAN needs attention.  Faulty - The WAN is critical. Faulty - The WAN is critical. |
Reachability | Shows the WAN reachability status. Ready - The uplink is functional.  Faulty - The uplink cannot contact the next-hop router. Faulty - The uplink cannot contact the next-hop router.  Disabled - The uplink did not yet report reachability, or it belongs to the backup high availability (HA) partner in dedicated uplink mode, or it hasn’t been associated with any appliance. Disabled - The uplink did not yet report reachability, or it belongs to the backup high availability (HA) partner in dedicated uplink mode, or it hasn’t been associated with any appliance. |
QoS | Shows QoS status. Enabled - QoS is enabled. Disabled - QoS is not enabled or has not yet initialized in the WAN. Disabled - QoS is not enabled or has not yet initialized in the WAN. QoS support is not shown for SDI-5030 or SteelHead SD appliances. |
Routing | Shows OSPF or BGP routing status. Enabled - OSPF or BGP routing is enabled and the uplinks can peer with the OSPF/BGP router on the next hop.  Disabled - Uplink is not configured to peer with an OSPF or BGP router. Disabled - Uplink is not configured to peer with an OSPF or BGP router.  Disabled Stale - Uplink was not configured to peer with an OSPF or BGP router when the appliance went offline. Disabled Stale - Uplink was not configured to peer with an OSPF or BGP router when the appliance went offline. |
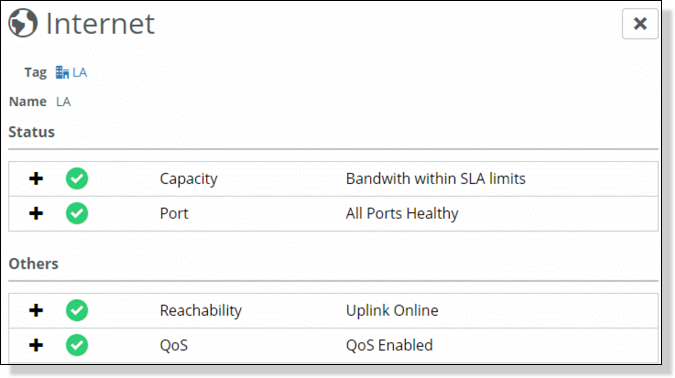
Field | Description |
Capacity | The total amount of traffic on the uplink if the bandwidth is within SLA limits, or the percentage of total bandwidth being used. If QoS is enabled on the uplink, these status levels are shown: Bandwidth within SLA limits - Bandwidth is within SLA limits. This icon is also shown if QoS is disabled; in this case, QoS will always be shown as within SLA limits because there is no SLA bandwidth to compare it against.  Degraded - The bandwidth has crossed the low threshold. Degraded - The bandwidth has crossed the low threshold. Faulty - The bandwidth has crossed the high threshold. Faulty - The bandwidth has crossed the high threshold. The user-configurable thresholds determine if the thresholds match the SLA limits. To view or edit these threshold levels, choose Organization and select the Appliance Threshold tab.  Disabled - The uplink belongs to an HA backup node, or the node belongs to a shadow appliance. Disabled - The uplink belongs to an HA backup node, or the node belongs to a shadow appliance. |
Current Status | The total amount of traffic on the uplink if the bandwidth is within SLA limits, or the percentage of total bandwidth being used. |
Last Update | The last time the status was updated. Mouse over the description to see the exact time and date. |
Upload Usage | Data being uploaded in kilobits per second (kbps) and total bandwidth available for uploading. |
Download Usage | Data being downloaded in kbps and total bandwidth available for downloading. |
Field | Description |
Port | The health status of the ports. All Ports Healthy - All ports serving this uplink are configured and functional.  Degraded - A minor spike in bandwidth usage has occurred on one or more ports. Degraded - A minor spike in bandwidth usage has occurred on one or more ports. A minor spike is defined as bandwidth exceeding the low threshold.  Faulty - One or more ports are configured but down, or a major spike in bandwidth usage has occurred on one or more ports. Faulty - One or more ports are configured but down, or a major spike in bandwidth usage has occurred on one or more ports. A major spike is defined as bandwidth exceeding the high threshold.  Disabled - No ports are configured to service this uplink. Disabled - No ports are configured to service this uplink. |
Current Status | Additional information about the status of the ports. |
Last Update | The last time the status was updated. Mouse over the status icon to see the exact time and date. |
TX Low Threshold | The lowest level of TX port utilization. To view or edit these threshold levels, choose Organization and select the Appliance Threshold tab. |
TX High Threshold | The highest level of TX port utilization. |
RX Low Threshold | The lowest level of RX port utilization. |
RX High Threshold | The highest level of RX port utilization. |
Fields in the Ports status table | |
Name | The port’s name. |
Operational Status | The port’s status. |
MAC Address | The port’s MAC address. |
Port Mode | The port’s operational configuration: Disabled, Single for single zone, Multi for multizone, Uplink, or Mirrored uplink. |
Zone | The zone or uplink associated with the port. It the ports is associated with an uplink, the uplink is shown; if the port doesn’t belong to an uplink or zone, this value is None. |
RX Bytes/min | Amount of RX data transferred in bytes. |
TX Bytes/min | Amount of TX data transferred in bytes. |
TX Errors/min | The number of TX errors in bytes. |
RX Errors/min | The number of RX errors in bytes. |
Port Health | A value based on the TX high and low, RX high and low, and TX Error and RX Error high and low thresholds. Healthy - All the appliance’s ports are in a Healthy state.  Degraded - One of more ports are in Degraded state. Degraded - One of more ports are in Degraded state. Faulty - One or more ports are configured as operational but are Down. Faulty - One or more ports are configured as operational but are Down. |
Field | Description |
Reachability | Shows whether the uplink is reachable from the next-hop router. Uplink Online - The uplink is reachable from the next-hop router.  Faulty - The uplink is not reachable from the next-hop router. Faulty - The uplink is not reachable from the next-hop router. |
Current Status | Provides more reachability information. |
Last Update | The time since the last update. |
Gateway IP Address | The gateway IP address. |
Field | Description |
QoS | The current QoS status from the traffic shaper on the uplink’s appliance. Ready - QoS is enabled on the appliance. Inactive or QoS Disabled - Either QoS has not been enabled on the appliance, or it was enabled and then disabled. Inactive or QoS Disabled - Either QoS has not been enabled on the appliance, or it was enabled and then disabled. |
Current Status | Additional information about QoS status. |
Last Update | The time since the last update. |
Field | Description |
IP Address | The IP address used by the zone. |
Zones | The number of zones associated with the IP address and subnet. |
Sites | The number of sites associated with the IP address and subnet. |
Type | The OSPF or BGP type (either Learned or Configured). For OSPF: •No data (empty field) - intra-area •IA - inter-area •E1 - external area 1 •E2 - external area 2 •N1 - Not-So-Stubby Area (NSSA) 1 •N2 - NSSA 2 |
DHCP Clients | The DHCP client’s status. Mouse over the status icon to see more status information. Ready - The SteelConnect appliance is being used as the DHCP server, and is allocating the IP addresses to clients in this subnet and refreshing the IP addresses after they expire.  Faulty - The SteelConnect appliance is being used as the DHCP server and is not correctly allocating the IP addresses. One possible reason for this failure is that the appliance is not refreshing the IP addresses after they expire. Faulty - The SteelConnect appliance is being used as the DHCP server and is not correctly allocating the IP addresses. One possible reason for this failure is that the appliance is not refreshing the IP addresses after they expire.  Disabled - The SteelConnect appliance is not configured to give DHCP IP addresses for this subnet. Disabled - The SteelConnect appliance is not configured to give DHCP IP addresses for this subnet.  Inactive - The subnet’s DHCP server is a SteelConnect appliance and there are no active DHCP clients in this subnet. Inactive - The subnet’s DHCP server is a SteelConnect appliance and there are no active DHCP clients in this subnet. Ready Stale - All the SteelConnect appliances serving the subnet are offline, and the DHCP state before they went offline was Ready. Ready Stale - All the SteelConnect appliances serving the subnet are offline, and the DHCP state before they went offline was Ready. Faulty Stale - All the SteelConnect appliances serving the subnet are offline, and the DHCP state before they went offline was Faulty. Faulty Stale - All the SteelConnect appliances serving the subnet are offline, and the DHCP state before they went offline was Faulty. Disabled Stale - All the SteelConnect appliances serving the subnet are offline, and no SteelConnect appliance is configured to assign DHCP addresses for this subnet. Disabled Stale - All the SteelConnect appliances serving the subnet are offline, and no SteelConnect appliance is configured to assign DHCP addresses for this subnet. Inactive stale - All the SteelConnect appliances serving the subnet are offline, and the DHCP state before they went offline was Inactive. Inactive stale - All the SteelConnect appliances serving the subnet are offline, and the DHCP state before they went offline was Inactive. |
Routing | The routing status. Enabled - The subnet can properly peer with an OSPF or BGP router on the next hop or has been configured to reach a third-party route.  Faulty - The subnet cannot properly peer with an OSPF or BGP router on the next hop or has not been configured to reach a third-party route. Faulty - The subnet cannot properly peer with an OSPF or BGP router on the next hop or has not been configured to reach a third-party route. Disabled - The subnet is not configured to peer with an OSPF or BGP router, or has not been configured to reach a third-party route. Disabled - The subnet is not configured to peer with an OSPF or BGP router, or has not been configured to reach a third-party route. |
Conflicts | The conflicting net status. Either None, or the number of conflicting networks is displayed. Ready - There are no duplicate network addresses for this subnet in this organization, including network addresses of the learned OSPF or BGP networks. Degraded - This subnet partially conflicts with one or more subnets in this organization, including network addresses of the learned OSPF or BGP networks. Degraded - This subnet partially conflicts with one or more subnets in this organization, including network addresses of the learned OSPF or BGP networks. Faulty - This subnet has one or more duplicate network addresses among the subnets in this organization, including network addresses of the learned OSPF or BGP networks. Faulty - This subnet has one or more duplicate network addresses among the subnets in this organization, including network addresses of the learned OSPF or BGP networks. Ready Stale - All the appliances serving the subnet are offline, and the conflict before they went offline was Ready. Ready Stale - All the appliances serving the subnet are offline, and the conflict before they went offline was Ready. Degraded Stale - All the appliances serving the subnet are offline, and the conflict before they went offline was Degraded. Degraded Stale - All the appliances serving the subnet are offline, and the conflict before they went offline was Degraded. Faulty Stale - All the appliances serving the subnet are offline, and the conflict before they went offline was Faulty. Faulty Stale - All the appliances serving the subnet are offline, and the conflict before they went offline was Faulty. |
Physical Port | The state of all ports associated with this subnet. Ready - All assigned ports are healthy. Degraded - Some assigned ports are unhealthy. Degraded - Some assigned ports are unhealthy.  Faulty - All assigned ports are unhealthy. Faulty - All assigned ports are unhealthy. Ready Stale - All the ports offline, and the state before they went offline was Ready. Ready Stale - All the ports offline, and the state before they went offline was Ready.  Degraded Stale - All the ports offline, and the state before they went offline was Degraded. Degraded Stale - All the ports offline, and the state before they went offline was Degraded. Faulty Stale - All the ports offline, and the state before they went offline was Faulty. Faulty Stale - All the ports offline, and the state before they went offline was Faulty. |
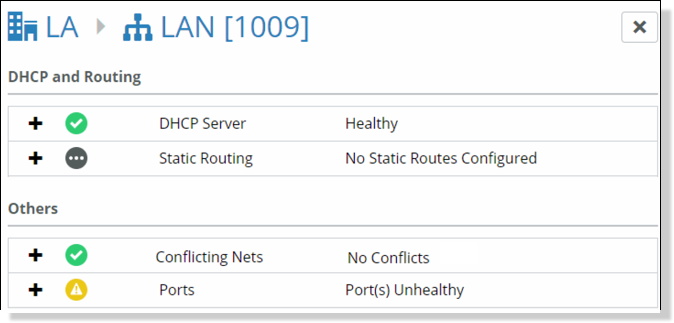
Field | Description |
DHCP Server | The status of the DHCP server. Ready - The clients in this subnet are receiving DHCP addresses from the DHCP server and the leases are being renewed on time.  Faulty - The DHCP address allocation and renewal is not working for the clients in this subnet. Faulty - The DHCP address allocation and renewal is not working for the clients in this subnet.  Inactive - This subnet has a DHCP server configured, but there are no active clients. Inactive - This subnet has a DHCP server configured, but there are no active clients. |
Current Status | A description of the subnet’s current status. |
Last Update | The last time the status was updated. Mouse over the status icon to see the exact time and date. |
Server address | The DHCP server address. |
Client IP Range | The starting and ending range of the client’s IP addresses. |
Lease Time | The duration of each lease. |
DHCP Client List table | |
Client Host Name | The client’s host name. |
IP Address | The client’s IP address. |
MAC Address | The client’s MAC address. |
Expires | When the DHCP lease expires. |
Field | Description |
Current Status | A description of the static routes that are configured for this subnet. Ready - This subnet has one or more static routes configured, and those networks are configured to be reachable from this subnet.  Disabled - This subnet does not have any static routes configured. Disabled - This subnet does not have any static routes configured. |
Last Update | The last time static route information was updated. |
Next Hop Router IP | The IP address of the static route. |
Static Route List table | |
Subnet | The subnet associated with the static route. |
Zone | The zone associated with the static route. |
Via | The IP address being used to communicate with the zone. |
Via Zone | The management zone name. |
Field | Description |
Conflicting Nets | Indicates whether the subnet associated with this zone is conflicting a subnet for any other zone in this organization. Both static and dynamic learned subnets are checked. Healthy - This subnet does not conflict with any other subnets in any other zone in this organization.  Degraded - This zone is partially conflicting with another subnet in another zone in this organization. The subnet and zone is noted in the status message. Degraded - This zone is partially conflicting with another subnet in another zone in this organization. The subnet and zone is noted in the status message.  Faulty - The subnet for this zone is a duplicate of another subnet for another zone in this organization. All conflicting zones are marked as Faulty. Faulty - The subnet for this zone is a duplicate of another subnet for another zone in this organization. All conflicting zones are marked as Faulty. Current Conflicts - The number of complete or partial subnet conflicts. Last Update - The time since the last update. |
Ports | Provides the status for the ports that are associated with this zone or subnet. Ready - All ports serving this subnet are healthy. Degraded - One or more ports servicing this subnet are unhealthy or degraded. Degraded - One or more ports servicing this subnet are unhealthy or degraded. Faulty - All ports servicing this subnet are unhealthy. Faulty - All ports servicing this subnet are unhealthy.Current Status - Provides additional information about the port’s status. Last Update - The time since the last update. TX Low Threshold - The lowest level of TX port utilization. TX High Threshold - The highest level of TX port utilization. RX Low Threshold - The lowest level of RX port utilization. RX High Threshold - The highest level of RX port utilization. There are predefined thresholds for the RX High threshold. To view or edit this threshold, choose Organization and select the Appliance Threshold tab. |
Ports status table | |
Name | The port’s name. |
Operational Status | The port’s status. |
MAC Address | The port’s MAC address. |
Port Mode | The port’s operational configuration: Disabled, Single for single zone, Multi for multizone, Uplink, or Mirrored uplink. |
Zone | The zone or uplink associated with the port. If the port is associated with an uplink, the uplink is shown; if the port doesn’t belong to an uplink or zone, this value is None. |
RX Bytes | Amount of RX data transferred in bytes. |
TX Bytes | Amount of TX data transferred in bytes. |
TX Errors | The number of TX errors in bytes. |
RX Errors | The number of RX errors in bytes. |
Port Health | A value based on the TX high and low, RX high and low, and TX Error and RX Error high and low thresholds. Ready - All the appliance’s ports are functioning properly.  Degraded - One of more ports are not functioning properly. Degraded - One of more ports are not functioning properly. Faulty - One or more ports are configured as operational but are down. Faulty - One or more ports are configured as operational but are down. |
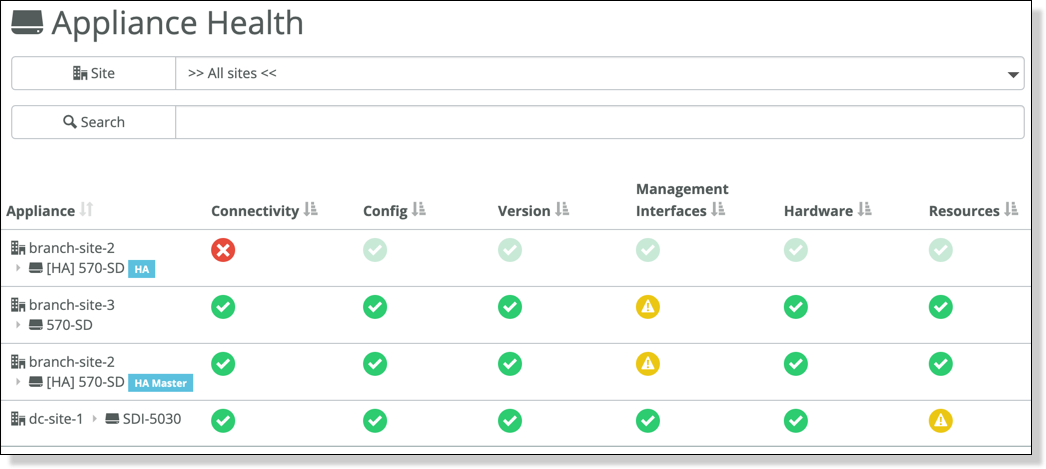
Field | Description |
Appliance | The appliance type. |
Connectivity | The connectivity status. Mouse over the status icon to see the following status descriptions: Ready - Appliance is online. Faulty - Appliance is offline. Faulty - Appliance is offline.  Disabled - Appliance is configured as a shadow appliance. Disabled - Appliance is configured as a shadow appliance. |
Config | The current appliance configuration status. Ready - The appliance downloaded and applied the latest configuration from SCM. Degraded - The appliance downloaded the latest configuration from SCM, but has not yet applied it. Degraded - The appliance downloaded the latest configuration from SCM, but has not yet applied it. Faulty - The appliance did not get the latest configuration from SCM. Faulty - The appliance did not get the latest configuration from SCM. Disabled - The appliance did not yet contact SCM for configuration information. Disabled - The appliance did not yet contact SCM for configuration information. Ready Stale - The appliance is currently offline, but it downloaded and applied the latest configuration before it went offline. Ready Stale - The appliance is currently offline, but it downloaded and applied the latest configuration before it went offline. Degraded Stale - The appliance is currently offline. At the time it went offline, it downloaded the latest configuration but did not yet apply it. Degraded Stale - The appliance is currently offline. At the time it went offline, it downloaded the latest configuration but did not yet apply it. Faulty Stale - The appliance is currently offline. At the time it went offline, it did not download the latest configuration from SCM. Faulty Stale - The appliance is currently offline. At the time it went offline, it did not download the latest configuration from SCM. Disabled Stale - The appliance is currently offline, but it downloaded and applied the latest configuration before it went offline. Disabled Stale - The appliance is currently offline, but it downloaded and applied the latest configuration before it went offline. |
Version | The current appliance configuration. Ready - The appliance downloaded and applied the latest firmware from SCM. Degraded - The appliance downloaded the latest firmware from SCM, but has not yet applied it. Degraded - The appliance downloaded the latest firmware from SCM, but has not yet applied it. Faulty - The appliance did not get the latest firmware from SCM. Faulty - The appliance did not get the latest firmware from SCM. Disabled - The appliance did not yet contact SCM to download firmware. Disabled - The appliance did not yet contact SCM to download firmware. Ready Stale - The appliance is currently offline, but it downloaded and applied the latest firmware before it went offline. Ready Stale - The appliance is currently offline, but it downloaded and applied the latest firmware before it went offline. Degraded Stale - The appliance is currently offline. At the time it went offline, it downloaded the latest firmware but did not yet apply it. Degraded Stale - The appliance is currently offline. At the time it went offline, it downloaded the latest firmware but did not yet apply it. Faulty Stale - The appliance is currently offline. At the time it went offline it did not download the latest firmware from SCM. Faulty Stale - The appliance is currently offline. At the time it went offline it did not download the latest firmware from SCM. Disabled Stale - The appliance is currently offline, but it downloaded and applied the latest firmware at the time it went offline. Disabled Stale - The appliance is currently offline, but it downloaded and applied the latest firmware at the time it went offline. |
Management Interfaces | The connectivity of the appliance to management interfaces. Ready - The appliance can connect to essential management URLs. Faulty - The appliance cannot reach essential management URLs. Faulty - The appliance cannot reach essential management URLs.  Disabled - This is a shadow appliance and port or HA status is not available. Disabled - This is a shadow appliance and port or HA status is not available. Ready Stale - The appliance is offline but the appliance could connect to essential management URLs before it went offline. Ready Stale - The appliance is offline but the appliance could connect to essential management URLs before it went offline. Faulty Stale - The appliance is offline but the appliance could not connect to essential management URLs before it went offline. Faulty Stale - The appliance is offline but the appliance could not connect to essential management URLs before it went offline.  Disabled Stale - This is a shadow appliance that is offline, and port or HA status was not available when it went offline. Disabled Stale - This is a shadow appliance that is offline, and port or HA status was not available when it went offline. |
Hardware | The hardware status. Ready - The appliance ports are configured and working properly. Degraded - Some ports are over the acceptable limits of capacity or errors. Degraded - Some ports are over the acceptable limits of capacity or errors.  Faulty - All ports are over the acceptable limits of capacity or errors. Faulty - All ports are over the acceptable limits of capacity or errors.  Ready Stale - The appliance is offline, and the appliance ports were configured and working properly before it went offline. Ready Stale - The appliance is offline, and the appliance ports were configured and working properly before it went offline. Degraded Stale - The appliance is offline, and some ports were over the acceptable limits of capacity or errors before it went offline. Degraded Stale - The appliance is offline, and some ports were over the acceptable limits of capacity or errors before it went offline. Faulty Stale - The appliance is offline, and all ports were over the acceptable limits of capacity or errors before it went offline. Faulty Stale - The appliance is offline, and all ports were over the acceptable limits of capacity or errors before it went offline. |
Resources | The appliance CPU use, memory use, and temperature. By default, SteelConnect monitors the appliance resources every 5 minutes. To change the CPU or memory thresholds, choose Organization, select the Appliance Threshold tab, and change the Threshold time value. The appliance temperature threshold varies by appliance model and is not configurable. Temperature is not reported for SDI-130, SDI-330, and SDI-1030 gateways and SDI-VGW virtual gateways. For temperature details, see Monitoring the appliance CPU temperature and the SteelHead SD Installation Guide. Ready - The appliance CPU use, memory use, or temperature over the last 5 minutes is below the low threshold.  Degraded - The appliance CPU use, memory use, or temperature over the last 5 minutes is above the low threshold but below the high threshold. Degraded - The appliance CPU use, memory use, or temperature over the last 5 minutes is above the low threshold but below the high threshold. Faulty - The appliance CPU use, memory use, or temperature over the last 5 minutes is above the high threshold. Faulty - The appliance CPU use, memory use, or temperature over the last 5 minutes is above the high threshold. Disabled - The appliance did not report any CPU, memory, or appliance temperature data over the last 5 minutes. Disabled - The appliance did not report any CPU, memory, or appliance temperature data over the last 5 minutes. Ready Stale - The appliance is currently offline. Its CPU use, memory use, or temperature over the last 5 minutes before going offline was below the low threshold. Ready Stale - The appliance is currently offline. Its CPU use, memory use, or temperature over the last 5 minutes before going offline was below the low threshold. Degraded Stale - The appliance is currently offline. Its CPU use, memory use, or temperature over the last 5 minutes before going offline was above the low threshold but below the high threshold. Degraded Stale - The appliance is currently offline. Its CPU use, memory use, or temperature over the last 5 minutes before going offline was above the low threshold but below the high threshold. Faulty Stale - The appliance is currently offline. Its CPU use, memory use, or temperature over the last 5 minutes before going offline was above the set high threshold. Faulty Stale - The appliance is currently offline. Its CPU use, memory use, or temperature over the last 5 minutes before going offline was above the set high threshold. Disabled Stale - The appliance is currently offline. Before going offline, it did not report any data. Disabled Stale - The appliance is currently offline. Before going offline, it did not report any data. |
Field | Description |
Connectivity | Current Status - The current appliance connectivity status. Ready - The appliance can connect to the management URLs that are required for SteelConnect to function.  Faulty - The appliance cannot connect to the management URLs that are required for SteelConnect to function. Faulty - The appliance cannot connect to the management URLs that are required for SteelConnect to function.  Disabled - The appliance did not yet report any management URL connectivity to SCM. Disabled - The appliance did not yet report any management URL connectivity to SCM. Ready Stale - The appliance is currently offline, but before it went offline the appliance could connect to the management URLs that are required for SteelConnect to function. Ready Stale - The appliance is currently offline, but before it went offline the appliance could connect to the management URLs that are required for SteelConnect to function.  Faulty Stale - The appliance is currently offline, but before it went offline the appliance could not connect to the management URLs that are required for SteelConnect to function. Faulty Stale - The appliance is currently offline, but before it went offline the appliance could not connect to the management URLs that are required for SteelConnect to function. Last Connected - The last time the appliance established or re-established a connection to SCM. IP Address - The IP address used for the last connection. |
Configuration | Current Status - The current appliance configuration status. If the icon is not green, additional configuration information is provided here. Ready - The appliance downloaded and applied the latest configuration from SCM.  Degraded - The appliance downloaded the latest configuration from SCM but has not yet applied it. Degraded - The appliance downloaded the latest configuration from SCM but has not yet applied it.  Faulty - The appliance has not yet downloaded the latest configuration from SCM. Faulty - The appliance has not yet downloaded the latest configuration from SCM. Last Updated - The last time the appliance reported its configuration state. |
Firmware | Current Status - The firmware status. Ready - The appliance has downloaded the latest firmware from SCM and has switched over to that version. Degraded - The appliance has either not yet downloaded the latest firmware from SCM, or it has not yet applied it. Degraded - The appliance has either not yet downloaded the latest firmware from SCM, or it has not yet applied it.  Faulty - The appliance is taking too long to download the latest firmware version from SCM, or the appliance has downloaded the firmware but is taking too long to apply it. Faulty - The appliance is taking too long to download the latest firmware version from SCM, or the appliance has downloaded the firmware but is taking too long to apply it. Current Firmware Version - The appliance’s firmware version. Last Firmware Switch - The last time that SCM requested the appliance to update the firmware. |
Management Interfaces | The connectivity of the appliance to Management URLs such as core server, SCM management server, DNS servers, and IP reflectors. If connectivity to any of these URLs are down, the status is shown in a Faulty state. Note: The SCM SSH and SCM Event channels are shown for reporting purposes only. If these URLs are unreachable, this information is not reported. Ready - The appliance can connect to essential management URLs. Faulty - The appliance cannot reach essential management URLs. Faulty - The appliance cannot reach essential management URLs.  Disabled - This is a shadow appliance and port or HA status is not available. Disabled - This is a shadow appliance and port or HA status is not available. Ready Stale - The appliance is offline but the appliance could connect to essential management URLs before it went offline. Ready Stale - The appliance is offline but the appliance could connect to essential management URLs before it went offline. Faulty Stale - The appliance is offline but the appliance could not connect to essential management URLs before it went offline. Faulty Stale - The appliance is offline but the appliance could not connect to essential management URLs before it went offline.  Disabled Stale - This is a shadow appliance that is offline, and port or HA status was not available when it went offline. Disabled Stale - This is a shadow appliance that is offline, and port or HA status was not available when it went offline. |
Connectivity to Management URLs table | |
Service | The service name. |
Protocol/Port | The protocols and port used by the management URL. |
Destination | The URL or IP address used by the management URL. |
Status | The reachability status of the field. |
Field | Description |
CPU Utilization | The CPU usage percentage. To view or edit these threshold levels, choose Organization and select the Appliance Threshold tab. The default time is 5 minutes. Ready - CPU utilization is below the Low threshold.  Degraded - CPU utilization is above the Low threshold but below the High threshold. Degraded - CPU utilization is above the Low threshold but below the High threshold.  Faulty - CPU utilization is above the High threshold. Faulty - CPU utilization is above the High threshold. This section contains the following additional fields: Additional Information - More information about the appliance’s current CPU status. Last updated - The last time an appliance sent an update. Threshold levels - The CPU’s safe and critical levels. |
Memory Utilization | The memory usage percentage. To view or edit these threshold levels, choose Organization and select the Appliance Threshold tab. The default time is 5 minutes. Ready - Average memory usage is below the Low threshold.  Degraded - Average memory usage is above the Low threshold but below the High threshold. Degraded - Average memory usage is above the Low threshold but below the High threshold.  Faulty - Average memory usage is above High threshold. Faulty - Average memory usage is above High threshold. This section contains the following additional fields: Additional information - The appliance’s current memory status. Last updated - The last time an appliance sent an update. Threshold levels - Memory safe and critical levels. |
Field | Description |
Physical Ports | The health status of the ports. All Ports Healthy - All ports serving this appliance are configured and functional.  Some Port(s) Faulty/Degraded- Some of the configured ports are offline or are above the configured thresholds. Some Port(s) Faulty/Degraded- Some of the configured ports are offline or are above the configured thresholds. All Port(s) Faulty/Degraded- All of the configured ports are offline or are above the configured thresholds All Port(s) Faulty/Degraded- All of the configured ports are offline or are above the configured thresholds  Shadow Appliance- This appliance has been configured as a shadow appliance. Shadow Appliance- This appliance has been configured as a shadow appliance. Appliance Offline - This appliance is offline. Appliance Offline - This appliance is offline. |
Current Status | More information about the status of the ports. |
TX Low Threshold | The lowest level of TX port utilization. The threshold levels are shown as a percentage. |
TX High Threshold | The highest level of TX port utilization. |
RX Low Threshold | RX Low Threshold - The lowest level of RX port utilization. |
RX High Threshold | The highest level of RX port utilization. There are predefined thresholds for the TX and RX Low and High thresholds. To view or edit these thresholds, choose Organization and select the Appliance Threshold tab. |
Last Update | The last time an appliance sent an update. |
Fields in the Ports Status table | |
Name | The port’s name. |
Operational Status | The port’s status. Up - The port is configured and operational.  Down - The port is configured, but is not operational. Down - The port is configured, but is not operational.  Disabled - The port has not been configured to be associated with an uplink or a zone. Disabled - The port has not been configured to be associated with an uplink or a zone. |
MAC Address | The port’s MAC address. |
Port Mode | The port’s operational configuration: Disabled, Single for single zone, Multi for multizone, Uplink, or Mirrored uplink. |
Zone | The zone or uplink associated with the port. It the ports is associated with an uplink, the uplink is shown; if the port doesn’t belong to an uplink or zone, this value is None. |
RX Bytes/min | The amount of RX data transferred in bytes per minute. |
TX Bytes/min | The amount of TX data transferred in bytes per minute. |
TX Errors/min | The number of TX errors per minute. |
RX Errors/min | The number of RX errors per minute. |
Port Health | A value based on the TX high and low, RX high and low, and TX Error and RX Error high and low thresholds. Ready - All the appliance’s ports are in Ready state.  Degraded - One of more ports are in Degraded state. Degraded - One of more ports are in Degraded state. Faulty - One or more ports are configured as operational but are Down. Faulty - One or more ports are configured as operational but are Down. |
High Availability | The appliance’s HA status. Ready - All SteelConnect HA appliances are operational. Single Appliance - This appliance is not configured for High Availability. Single Appliance - This appliance is not configured for High Availability. Degraded- One or more SteelConnect HA appliances are not operational. Degraded- One or more SteelConnect HA appliances are not operational.  Faulty - All SteelConnect HA appliances are not operational. Faulty - All SteelConnect HA appliances are not operational.  Disabled - One or more SteelConnect appliances cannot be configured as an HA appliance. Disabled - One or more SteelConnect appliances cannot be configured as an HA appliance.Current Status - The appliance’s HA status (Master, Backup, or Single Appliance). Partner Status - The partner appliance’s HA status (Master or Backup). Partner Connectivity - The connectivity status of the partner appliance (reachable or unreachable). Last Failover - The time of the last failover. Alive uplink count - The number of uplinks that are active between the master and backup appliance. |
Fields in the Tracked Ports table | |
Interface - The interface’s name. Status - The appliance’s status (up or down). | |
Field | Description |
Underlay FIB | The FIB table provides interface-specific information needed for packet routing. The status of the FIB table used in the underlay network for the selected appliance. FIB table functional  FIB table partially degraded FIB table partially degraded  FIB table degraded FIB table degraded |
Underlay FIB table | |
Appliance | The name of the appliance. |
Model | The model of the appliance. |
Site | The site where the appliance is deployed. |
Number of entries | The number of FIB table entries for the appliance. |
Field | Description |
Underlay ARP | The status of the ARP table used in the underlay network for the selected appliance. ARP table functional  ARP table partially degraded ARP table partially degraded  ARP table degraded ARP table degraded |
Underlay ARP table | |
Destination MAC | The MAC address of the ARP destination. |
Destination Port | The destination’s port. |
Gateway | The gateway’s IP address. |
VLAN | The VLAN number. |
MTU | The maximum transmission unit (MTU) for that interface. |