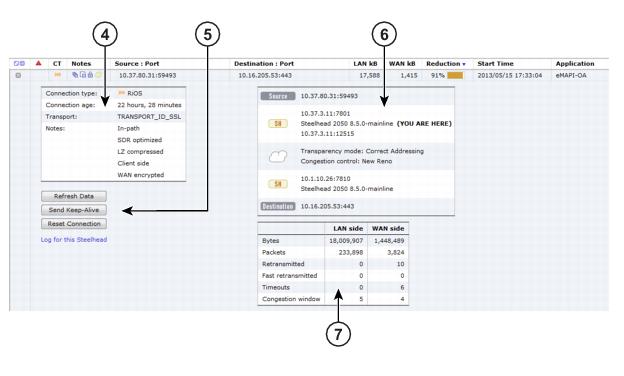
Figure: Current Connections Report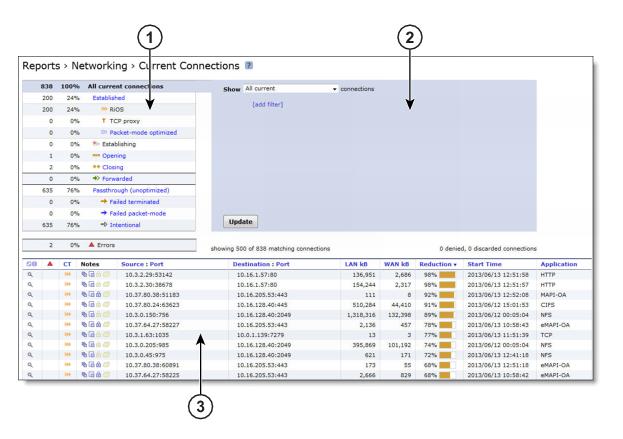
 Connections Summary
Connection Type | Icon | Description |
All current connections | Displays the total number of connections the SteelHead detects at the time you access the report, refresh the page, or click the Update button. It includes the connections that the SteelHead is passing through unoptimized, and connections that don’t appear in the connections table. | |
Established | Displays the total optimized, active connections. | |
 | RiOS - Displays the double-ended, non-SCPS connections. | |
 | RiOS + SCPS - Displays the total RiOS and SCPS connections established between two SteelHeads running RiOS 7.0 or later. Because both SteelHeads are SCPS compatible, this is a double-ended connection that benefits from traditional RiOS optimization (SDR and LZ). | |
 | SCPS - Displays all current single-ended SCPS-optimized connections as a portion of the total. | |
 | TCP proxy - Displays the total non-SCPS single-ended interception connections. An SEI connection is established between a single SteelHead running RiOS 7.0 or later paired with a third-party device running TCP-PEP (Performance Enhancing Proxy). | |
 | Packet-mode optimized - Displays the total flows that were optimized packet-by-packet with SDR bandwidth optimization. These include TCP and UDP flows over IPv4 or IPv6. Packet-mode flows are considered to be neither single-ended nor double-ended. In RiOS 8.5, you must enable packet-mode optimization to view optimized UDP flows. To enable packet-mode optimization, choose Optimization > Network Services: General Service Settings. In RiOS 8.5.x and later, you must enable path selection and packet-mode optimization to view optimized UDP flows. To enable path selection, choose Networking > Network Services: Path Selection. | |
Establishing |  | Displays the total newly forming, initiating connections. The connection is being established but doesn’t yet have an inner channel. Establishing connections count toward the connection count limit on the SteelHead because, at any time, they might become a fully opened connection. |
Opening |  | Displays the total half-open active connections. A half-open connection is a TCP connection in which the connection has not been fully established. Half-open connections count toward the connection count limit on the SteelHead because, at any time, they might become a fully opened connection. If you are experiencing a large number of half-open connections, consider a more appropriately sized SteelHead. |
Closing |  | Displays the total half-closed active connections. Half-closed connections are connections that the SteelHead has intercepted and optimized but are in the process of becoming disconnected. These connections count toward the connection count limit on the SteelHead. (Half-closed connections might remain if the client or server doesn’t close its connections cleanly.) If you are experiencing a large number of half-closed connections, consider a more appropriately sized SteelHead. |
Forwarded |  | Displays the total number of connections that were forwarded when you have configured a connection-forwarding neighbor to manage the connection. For details about connection forwarding, see Configuring Connection Forwarding Features. |
Passthrough (unoptimized) | Displays the total number of connections that were passed through unoptimized. You can view and sort these connections by intentional and unintentional pass-through in the connections table that follows this summary. | |
 | Failed terminated - Displays the total number of terminated connections that were passed through unoptimized, because of reasons other than in-path rules. | |
 | Failed packet-mode - Displays the total number of packet-mode flows that were passed through unoptimized, because of reasons other than in-path rules. In RiOS 8.5, you must enable packet-mode optimization to view UDP flows. To enable packet-mode optimization, choose Optimization > Network Services: General Service Settings. In RiOS 8.5.x and later, you must enable path selection or packet-mode optimization or both to view pass-through UDP flows. To enable path selection, choose Networking > Network Services: Path Selection. | |
 | Intentional - Displays the total number of connections that were intentionally passed through unoptimized by in-path rules. | |
Errors |  | Displays all connections that have application or transport protocol errors as a portion of the total connections. |
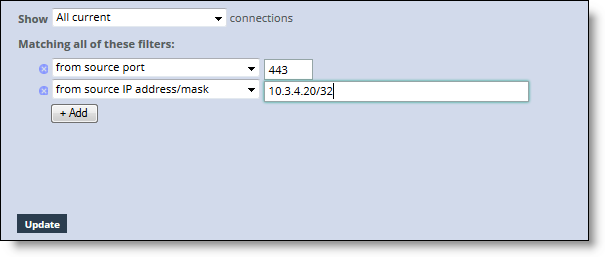
 Query Area
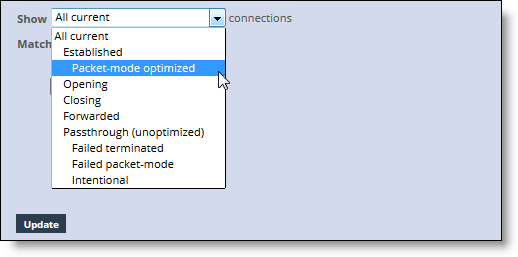
Connection Type | Description |
All current | Displays the total number of connections the SteelHead detects, including the connections that are passed through unoptimized. This selection removes any previous selections or filters. |
Established | Displays the total optimized, active connections. |
Packet-mode optimized | Displays the total connections that were optimized packet-by-packet with SDR bandwidth optimization. These connections include TCP IPv4, TCP IPv6, UDP IPv4, and UDP IPv6 connections. In RiOS 8.5, you must enable packet-mode optimization to view UDP flows. To enable packet-mode optimization, choose Optimization > Network Services: General Service Settings. In RiOS 8.5.x and later, you must enable path selection and packet-mode optimization to view optimized UDP flows. To enable path selection, choose Networking > Network Services: Path Selection. |
Opening | Displays the total half-open active connections. A half-open connection is a TCP connection in which the connection has not been fully established. Half-open connections count toward the connection count limit on the SteelHead because, at any time, they might become a fully opened connection. If you are experiencing a large number of half-open connections, consider a more appropriately sized SteelHead. |
Closing | Displays the total half-closed active connections. Half-closed connections are connections that the SteelHead has intercepted and optimized but are in the process of becoming disconnected. These connections are counted toward the connection count limit on the SteelHead. (Half-closed connections might remain if the client or server doesn’t close its connections cleanly.) If you are experiencing a large number of half-closed connections, consider a more appropriately sized SteelHead. |
Forwarded | Displays the total number of connections forwarded by the connection-forwarding neighbor managing the connection. |
Passthrough (unoptimized) | Displays the total number of connections that were passed through unoptimized. You can view and sort these connections by intentional and unintentional pass-through in the individual connections table that follows the connections summary. |
Failed terminated | Displays the total number of terminated connections that were passed through unoptimized. |
Failed packet-mode | Displays the total number of packet-mode flows that were passed through unoptimized. |
Intentional | Displays the total number of connections that were intentionally passed through unoptimized. |
 Connections Table
Column | Icon | Description |
Click the connection to display the current connections details. See Viewing the Current Connection Details. Because the details are a snapshot in time, by the time you click the connection, it could be gone or in a different state. If the connection is no longer available, a message tells you that the connection is closed. To refresh the display, click Update. | ||
| Protocol Error - Displays a protocol error for both transport and application conditions. This list contains some of the conditions that trigger errors; it is a small subset of possible error conditions: • When the Optimize Connections with Security Signatures feature is enabled (which prevents SMB signing). This is an expected response. For details about preventing SMB signing, see Configuring CIFS Optimization. • If a problem occurs while optimizing encrypted MAPI traffic. For details about enabling optimization of encrypted MAPI traffic, see Configuring MAPI Optimization. • If a problem occurs with SSL optimization or the secure inner channel. • If a SRDF protocol error occurs when attempting to optimize traffic originating from the LAN side of the SteelHead. Check the LAN-side Symmetrix array for compatibility. Click the connection for more details about the error. | |
CT (Connection Type) | | Established - Indicates that the connection is established and active. |
| Intentional Passthrough - Indicates that the connection was intentionally passed through unoptimized because of in-path rules. | |
| Failed terminated - Indicates that the connection was passed through unoptimized. | |
| Failed packet-mode - Indicates that the packet-mode flow was passed through unoptimized. | |
| Establishing - Indicates that the connection is initiating and isn’t yet fully established. The source and destination ports appear as n/a. | |
| Opening (Optimized) - Indicates that the connection is half-open and active. A half-open connection is a TCP connection that has not been fully established. | |
| Closing (Optimized) - Indicates that the connection is half-closed and active. A half-closed connection has been intercepted and optimized by the SteelHead but is in the process of becoming disconnected. | |
| Forwarded - Indicates that the connection is forwarded by the connection-forwarding neighbor managing the connection. For details about connection forwarding, see Configuring Connection Forwarding Features. | |
Notes | Displays connection icons that indicate the current state of the connection. The connection states can be one of these: | |
 | Compression Enabled - Indicates that LZ compression is enabled. | |
 | SDR Enabled - Indicates that SDR optimization is enabled. | |
 | WAN Encryption Enabled - Indicates that encryption is enabled on the secure inner channel (WAN). For details, see Configuring Secure Peers. | |
 | Cloud Acceleration ON - Indicates that the cloud acceleration service for SaaS applications is enabled. | |
Source:Port | Displays the connection source IP address and port. | |
Destination:Port | Displays the connection destination IP address and port. | |
LAN/kB WAN/kB | Displays the amount of LAN or WAN throughput, in kilobytes. | |
Reduction | Displays the degree of WAN traffic optimization as a percentage of LAN traffic sent. Higher percentages mean that fewer bytes were sent over the WAN. Red squares indicate that an optimizing connection is currently showing 0 percent data reduction, which might be caused by multiple scenarios. Typically, 0 percent data reduction occurs when the system is optimizing a session containing encrypted payload. You can set up an in-path pass-through rule to prevent the system from interception the connection for optimization. | |
Start Time | Displays the time that the connection was started. This column doesn’t apply to preexisting connections. Select the column heading to sort data start time in ascending or descending order. | |
Application | Displays the application associated with the connection: for example: TCP, CIFS, MAPI, eMAPI-OA (encrypted MAPI Outlook Anywhere), SMB31-ENCRYPED, SMB21-SIGNED, or HTTP. When Application Visibility is enabled (the default), the table displays the hierarchical, DPI-based application name (for example, HTTP > Facebook), instead of just the port-based name (for example, HTTP). When you expand a connection, a new Application row displays the hierarchical name, when available, or the port-based name if not. (For newly formed connections, the application name might have changed from what was reported in the table). Application visibility gives you a better sense of what applications are running instead of just seeing traffic through port numbers or web traffic classified as generic HTTP. |

 Connection Details
Data | Description (varies by connection type) |
Connection Information | Connection type - Displays the connection type icon and whether the connection is established, opening, or closing. Connection age - Displays the time since the connection was created. Transport - Displays the transport protocol name: for example, SSL inner. Application - Displays the application corresponding to the connection (for example, NFS). When Application Visibility is enabled, more detailed protocol information is shown for some applications. For example, HTTP-SharePoint appears as the WebDAV or FPSE protocols and Office 365 appears as MS-Office-365 instead of HTTP. Client side - Displays whether this appliance is on the client side. In-path - Indicates whether the connection is in-path. Protocol - Displays the low-level protocol that RiOS is using inside the packet-mode channel. The protocol can be UDP, TCP, or variants. Application error - Displays the application protocol error, if one exists. Transport error- Displays the transport protocol error, if one exists. SaaS application- Displays the SaaS application name, if one exists. Cloud acceleration state - Displays the SaaS connection state, if an SaaS application is running. GeoDNS IP result - Displays the GeoDNS IP address that the SteelHead is using to optimize Office 365. The connection summary displays the original destination IP address. SkipWare compression in - Indicates that the single-ended optimized connection is applying Skipware105 compression on incoming data. SkipWare compression out - Indicates that the single-ended optimized connection is applying Skipware105 compression on outgoing data. Pre-existing asymmetric - Indicates that the connection is traveling an asymmetric route and existed before the last restart of the optimization service. Pre-existing - Indicates that the connection existed before the last restart of the optimization service. Inbound QoS class - Indicates the QoS inbound class the connection is associated with when shaping is enabled. When the connection carries multiple classes, the report displays Variable. Outbound QoS class - Indicates the QoS outbound class the connection is associated with when shaping is enabled. When the connection carries multiple classes, the report displays Variable. Outbound QoS DSCP - Indicates the DSCP marking value for the connection when marking is enabled, even if it is zero. The report displays the value from the inner ToS. When the connection carries multiple values, the report displays Variable. When relevant, the Notes section displays several details that are binary in nature. |
All optimized connections might show any of these items: Client side - Indicates that the SteelHead is on the client side of the connection. SDR optimized - Indicates that SDR optimization is enabled. LZ compressed - Indicates that LZ compression is enabled. | |
Packet-mode optimized connections might show: Incomplete parse - Indicates that the inner channel exists but the connection through the channel isn’t fully formed. | |
Optimized, nonpacket mode connections might show any of these items: In-path - Indicates an in-path connection. Single-ended - Indicates that the connection involves only one SteelHead. WAN encrypted - Indicates that encryption is enabled on the secure inner channel (WAN). Cloud accelerated - Indicates that the Cloud acceleration service for SaaS applications is enabled. | |
At least one of these items appear for SCPS connections: SCPS initiate WAN - Indicates that the SteelHead has initiated the SCPS connection on the WAN. SCPS initiate LAN - Indicates that the SteelHead has initiated the SCPS connection on the LAN. SCPS terminate WAN - Indicates that the SteelHead has terminated the SCPS connection on the WAN. SCPS terminate LAN - Indicates that the SteelHead has terminated the SCPS connection on the LAN. | |
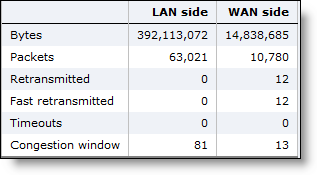
WAN and LAN-Side Statistics | LAN Bytes - Displays the total LAN bytes transmitted. WAN Bytes - Displays the total WAN bytes transmitted. Retransmitted - Displays the total packets retransmitted. Fast Retransmitted - Displays the total packets fast retransmitted. Fast retransmit reduces the time a sender waits before retransmitting a lost segment. If an acknowledgment isn’t received for a particular segment with a specified time (a function of the estimated round-trip delay time), the sender assumes the segment was lost in the network, and retransmits the segment. Timeouts - Displays the number of packet transmissions that timed out because no ACK was received. Congestion Window - Displays number of unACKed packets permitted, adjusted automatically by the SteelHead, depending on WAN congestion. |
Data | Description (Varies by Connection) |
Relayed | Displays the number of bytes relayed if all uplinks are down. |
Dropped | Displays the number of bytes dropped if all uplinks are down. |
Bypassed | Displays the number of bytes bypassed if all uplinks are down. |
Reflected | Displays the number of bytes reflected. |
Local uplink | Displays the uplink name. |
Remote uplink | Displays the remote uplink name. |
Status | Displays whether the uplink is reachable (Up) or unreachable (Down). |
Last started | Displays the time the connection started using the uplink. |
Bytes | Displays the total number of bytes transferred through the uplink. Note: The LAN kB value and this number don’t match. This value displays only the bytes using path selection on the WAN. |
DSCP | Displays the DSCP marking set for the uplink. |
Data | Description (Varies by Connection) |
Connection Information | Connection Type - Displays a connection type icon and whether the pass-through was intentional or unintentional. Displays the forwarded reduction percentage bar for forwarded connections. Connection Age - Displays the time since the connection was created. Transport - Displays the transport protocol name: for example, SSL inner. Application - Displays the application corresponding to the connection: for example, NFS. Client-Side - Displays whether the connection is on the client side. Pre-Existing - Displays whether the connection existed before the last restart of the optimization service. Passthrough Reason - Displays the reason for passing through or forwarding the connection. |
Value | Pass-through Reason (Varies by Connection) | Description | Action |
0 | None | None | None |
1 | Preexisting connection | Connection existed before SteelHead started. | Create a connection. |
2 | Connection paused | SteelHead isn’t intercepting connections. | Check that the service is enabled, in-path is enabled, the neighbor configuration, and whether the SteelHead is in admission control. |
3 | SYN on WAN side | Client is on the SteelHead WAN side. | Either this is the server-side SteelHead and there’s no client-side SteelHead, or the client-side SteelHead did not probe. Check the cabling if it is really the client-side SteelHead. Because VSP is enabled by default on a SteelHead EX, and the default subnet side rule assumes that all traffic is coming from the WAN, client-side connections are not being optimized. Configure a subnet side rule to identify traffic that should be treated as LAN-side traffic. Place the rule at the start of the subnet side rules list, before the default subnet side rule. |
4 | In-path rule | In-path rule matched on the client-side SteelHead is pass-through. | Check the in-path rules. |
5 | Peering rule | Peering rule matched on the server-side SteelHead is pass-through. | Check the peering rules. |
6 | Inner failed to establish | Inner connection between SteelHeads failed. | Check the connectivity between the client-side SteelHead and the server-side SteelHead. |
7 | Peer in fixed-target rule down | The target of a fixed-target rule is destined to a failed peer. | Check the connectivity between the client-side SteelHead and the server-side SteelHead. |
8 | No SteelHead on path to server | No server-side SteelHead. | Check that the server-side SteelHead is up and check that the connection goes through the server-side SteelHead. |
9 | No route for probe response | No route to send back probe response. | Check in-path gateway on the server-side SteelHead. |
10 | Out of memory | Memory problem while copying packet. | Check if the SteelHead is out of memory. |
11 | No room for more TCP options | Not enough space in TCP header to add probe. | This condition occurs when another device added TCP options before the SteelHead. Take a TCP dump to check which TCP options are in the SYN packet. Search for those options to learn what device uses them. |
12 | No proxy port for probe response | There is no service port configured on server-side SteelHead. | Configure a service port. |
13 | RX probe from failover buddy | The connection is intercepted by failover buddy. | No action is necessary. |
14 | Asymmetric routing | The connection is asymmetric. | Check the asymmetric routing table for reason. |
15 | Middle SteelHead | The SteelHead isn’t the first or last SteelHead. | Only happens when the Enhanced Auto-Discovery Protocol is enabled. |
16 | Error connecting to server | The server-side SteelHead couldn’t connect to the server. | Only happens when the Enhanced Auto-Discovery Protocol is enabled. |
17 | Half open connections above limit | The client has too many half-opened connections. | Check if many connections open quickly from the same client. |
18 | Connection count above QOS limit | There are too many connections for that QoS class. | Check the QoS class. |
19 | Reached maximum TTL | The probe has an incorrect TTL. | Take a trace to check the probe. |
20 | Incompatible probe version | The probe has an incompatible version number. | Check if the new probe format is enabled, it is disabled by default. |
21 | Too many retransmitted SYNs | The client SYN has been retransmitted too many times. | Check if there’s a firewall that doesn’t like the probe TCP option. |
22 | Connection initiated by neighbor | The connection is intercepted by a neighbor. | No action is necessary. |
23 | Connection for local host | The connection is to the in-path interface. | No action is necessary. |
24 | Unknown reason | The pass-through reason doesn’t match any other description. | No action is necessary. |
25 | Connection from proxy target | Because the connection originates from an IP address that is also the IP address of a fixed-target rule, it isn’t intercepted. | No action is necessary. |
26 | SYN before SFE outer completes | The client connection was passed through at the client-side SteelHead and the client's pure SYN was seen at the server-side SteelHead. | Check if there’s a firewall that doesn’t like the probe TCP option. |
27 | Transparent inner on wrong VLAN | The inner connection seen on VLAN is different than the in-path VLAN. | No action is necessary. |
28 | Transparent inner not for this host | No action is necessary. | |
29 | Error on neighbor side | The neighbor SteelHead returned an error to a connection-forwarding request. | Check the health of the configured neighbors. |
30 | SYN/ACK, but no SYN | There is asymmetric routing - received SYN/ACK but no SYN. | Check your routing. |
31 | Transparency packet from self | For Riverbed internal use only. | No action is necessary. |
32 | System is heavily loaded | The SteelHead is experiencing a heavy traffic load. | Contact Riverbed Support. You might require a larger model SteelHead. |
33 | SYN/ACK at MFE not SFE | There is asymmetric routing around the server-side SteelHead. | Check your routing. |
34 | Windows branch mode detected | The client-side is a SteelHead Mobile. Optimization is occurring between the SteelHead Mobile and the server-side SteelHead, so the connection is passed through on the client-side SteelHead. | No action is necessary. |
35 | Transparent RST to reset firewall state | The optimization service has sent a RST to clear the probe connection created by the SteelHead and to allow for the full transparent inner connection to traverse the firewall. | No action is necessary. |
36 | Error on SSL inner channel | An inner channel handshake has failed with peer. | Check the SSL configuration on both SteelHeads. |
37 | Netflow only: Ricochet packet of optimized connection | This pass-through reason is attributed to a flow reported to a NetFlow v9 collector. A probe and packet have been sent by the SteelHead back through itself. For example, in an in-path setup, if a client-side SteelHead gateway is on its WAN side, all packets sent to the client will first go to the gateway and be sent back through the SteelHead on the way to the client. | Packet ricochet can be avoided in many environments by enabling simplified routing. |
38 | Passthrough due to MAPI admission control | New MAPI connections will be passed through due to high connection count. | New MAPI connections are optimized automatically when the MAPI traffic has decreased. |
39 | A SYN or RST packet contains data | ||
40 | Failed to discover SCPS device | RiOS can’t find a SCPS device. | |
41 | No matching client/server IPv6 scope | RiOS can’t set up the outer channel connection. | RiOS passes all packets through until it creates the outer channel. |
42 | Failed to create sport outer channel | RiOS can’t set up the outer channel connection. | RiOS passes all packets through until it creates the outer channel. |
43 | Flows not matching in-path rule | RiOS can’t match this traffic flow to any packet-mode optimization in-path rule. A packet-mode optimization rule defines the inner channel characteristics. | RiOS passes all packets through while the flow is in this state. Go to Optimization > In-Path rules to add a fixed-target packet-mode optimization in-path rule. |
44 | Packet mode channel setup pending | RiOS is attempting to set up the inner IPv4 or IPv6 channel connection. | RiOS passes all packets through until it creates the inner IPv4 or IPv6 channel. |
45 | Peer does not support packet-mode optimization | The peer SteelHead to which RiOS needs to establish the inner IPv4 or IPv6 channel connection doesn’t support packet-mode optimization or packet-mode optimization isn’t enabled. | RiOS stops trying to optimize connections using packet-mode optimization with the peer. |
46 | Generic Flow error | A packet-mode optimization traffic flow transitions to this state when RiOS encounters one of these unrecoverable errors: • There isn’t enough memory to set up the inner channel. • The system has requested that RiOS kill the traffic flow. When RiOS receives this error, the SteelHead abandons all attempts to optimize the flow. | RiOS passes the flow through for its lifetime. |
47 | Failed to cache sock pointer | While configured for packet-mode optimization, RiOS can’t locate the socket pointer used to exchange packets through the inner channel. The system is attempting to write packets to the ring, but the socket is closed. This condition can occur when the optimization service shuts down unexpectedly. | Go to Administration > Maintenance: Services and restart the optimization service. |
48 | Packet mode optimization disabled | The connection is being passed through because packet-mode optimization is disabled. | Go to Optimization > In-path Rules and enable packet-mode optimization. |
49 | Optimizing local connections only | On a SteelHead EX, the connection is being passed through because it did not originate locally. | |
50 | Netflow only: probe packet of optimized connection | ||
51 | IPv6 connection forwarding requires multi-interface support | RiOS is passing the connection through because the client-side SteelHead is configured without multi-interface connection forwarding. This configuration doesn’t support IPv6. | Go to Networking > Connection Forwarding and enable multiple interface support. |
52 | Neighbor does not support IPv6 | RiOS is passing the connection through because a connection-forwarding neighbor doesn’t support IPv6. | Upgrade the connection-forwarding neighbor to RiOS 8.0 or later. |
53 | Reached the hard limit for the number of entries | RiOS is passing the connection through because it hit the maximum allowed limit for nonreusable connection entries. | |
54 | Connection or flow from GRE IPv4 tunnel |
Value | Reason | Description | Action |
0 | None | None | None |
1 | Optimized connection | Connection is redirected through the SteelHead SaaS to a SaaS service. | No action is necessary. |
Value | Pass-through Reason (Varies by Connection) | Description | Action |
2 | Inner Connection through Cloud Accelerator | An inner connection to a remote SteelHead is running in the cloud. | No action is necessary. |
3 | Not a supported SaaS destination | Connection is through a SaaS service that isn’t supported, subscribed to, or enabled. | No action is necessary; however, if you want to optimize this destination IP address, contact Riverbed Support. |
4 | Due to configured In-path rule | Connection isn’t redirected through the SteelHead SaaS due to an in-path rule to disable cloud acceleration. | Check that the Cloud Acceleration field in the relevant in-path rule is set to Auto. |
5 | Due to configured Peering rule | Connection isn’t redirected through the SteelHead SaaS due to a peering rule to disable cloud acceleration. | Check that the Cloud Acceleration field in the relevant peering rule is set to Auto. |
6 | Cloud acceleration disabled | Connection isn’t redirected through the SteelHead SaaS because it is disabled. | Check the cloud accelerator configuration. Go to Optimization > Cloud Accelerator and select the Enable Cloud Acceleration check box in the Cloud Accelerator page. |
7 | Redirection disabled globally | Connection isn’t redirected through the SteelHead SaaS because cloud acceleration redirection is disabled. | Go to Optimization > Cloud Accelerator and select the Enable Cloud Acceleration Redirection check box in the Cloud Accelerator page. |
8 | Redirection disabled for relay | Connection isn’t redirected through SteelHead SaaS because cloud acceleration redirection for this in-path interface is disabled. | Check the Cloud Accelerator redirection configuration for the relevant in-path interface on the command-line interface. Enter this command on the command-line interface: show service cloud-accel For details, see the Riverbed Command-Line Interface Reference Manual. |
9 | Cloud proxy is down | Connection isn’t redirected through SteelHead SaaS because the redirection service encountered an error. | Contact Riverbed Support. |
10 | No PQID added by first SteelHead | Connection isn’t redirected through SteelHead SaaS because the SteelHead closest to the client has SteelHead SaaS disabled or misconfigured. | Check the Cloud Accelerator configuration on the client-side SteelHead. |
11 | Failed to append CP code | Connection isn’t redirected through SteelHead SaaS because of a packet processing error. | Contact Riverbed Support. |
12 | SYN retransmit (backhauled) | Connection isn’t redirected through SteelHead SaaS because too many SYN retransmits were received from the client. | Check if there’s a firewall that doesn’t allow inbound or outbound UDP packets for the SteelHead. |
13 | SYN retransmit (direct) | Connection isn’t redirected through SteelHead SaaS because too many SYN retransmits were received from the client. | Check if there’s a firewall that doesn’t allow inbound or outbound UDP packets for the SteelHead. |
14 | Passing to downstream SteelHead | Connection isn’t redirected through SteelHead SaaS because admission control is reached and there’s a SteelHead downstream that might optimize the connection. | No action is necessary. |
15 | Passthrough SYN retransmit | Connection isn’t redirected through SteelHead SaaS because too many SYN retransmits were received from the client. | Check if there’s a firewall that doesn’t allow inbound or outbound UDP packets for the SteelHead. |
16 | Rejected by cloud proxy | Connection isn’t redirected through SteelHead SaaS because the SteelHead SaaS network rejected the connection. | Contact Riverbed Support. |
17 | Invalid Entitlement code | Connection isn’t redirected through SteelHead SaaS because of an invalid SteelHead SaaS configuration. | Contact Riverbed Support. |
18 | Invalid timestamp | Connection isn’t redirected through SteelHead SaaS because the clock on the SteelHead isn’t synchronized. | Check the date and time settings on the SteelHead. |
19 | Invalid customer ID | Connection isn’t redirected through SteelHead SaaS because of an invalid SteelHead SaaS configuration. | Contact Riverbed Support. |
20 | Invalid ESH ID | Connection isn’t redirected through SteelHead SaaS because of an invalid SCA configuration. | Contact Riverbed Support. |
21 | Invalid SaaS ID | Connection isn’t redirected through SteelHead SaaS because of an invalid SCA configuration. | Contact Riverbed Support. |
22 | Connection limit reached | Connection isn’t redirected through SteelHead SaaS because the subscription limit for the number of connections is reached. | Contact Riverbed Support. You might require a higher SteelHead SaaS license. |
23 | Bandwidth limit reached | Connection isn’t redirected through SteelHead SaaS because the subscription limit for bandwidth used is reached. | Contact Riverbed Support. You might require a higher SteelHead SaaS license. |
 Tools
Tools
Control | Description |
Send Keep-Alive | For an optimized connection, click to send a keep-alive message to the outer remote machine (the machine that is connected to this appliance). This operation isn’t available for a pass-through connection. This button is dimmed for users logged in as a monitor user. |
Refresh Data | Click to retrieve the most recent data for the connection. |
Reset Connection | Click to send a RST packet to both the client and server to close the connection. You can reset both optimized and pass-through connections. You can’t reset a forwarded connection. Note: If no data is being transferred between the client and server when you click Reset Connection, the connection isn’t reset immediately. It resets the next time the client or server tries to send a message. Therefore, when the application is idle, it might take a while for the connection to disappear. This button is dimmed for users logged in as a monitor user. |
Log for this SteelHead | Click to go to the System Logs page. |
 Network Topology
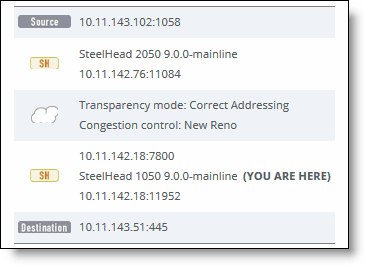
 LAN/WAN Table