A time-series report 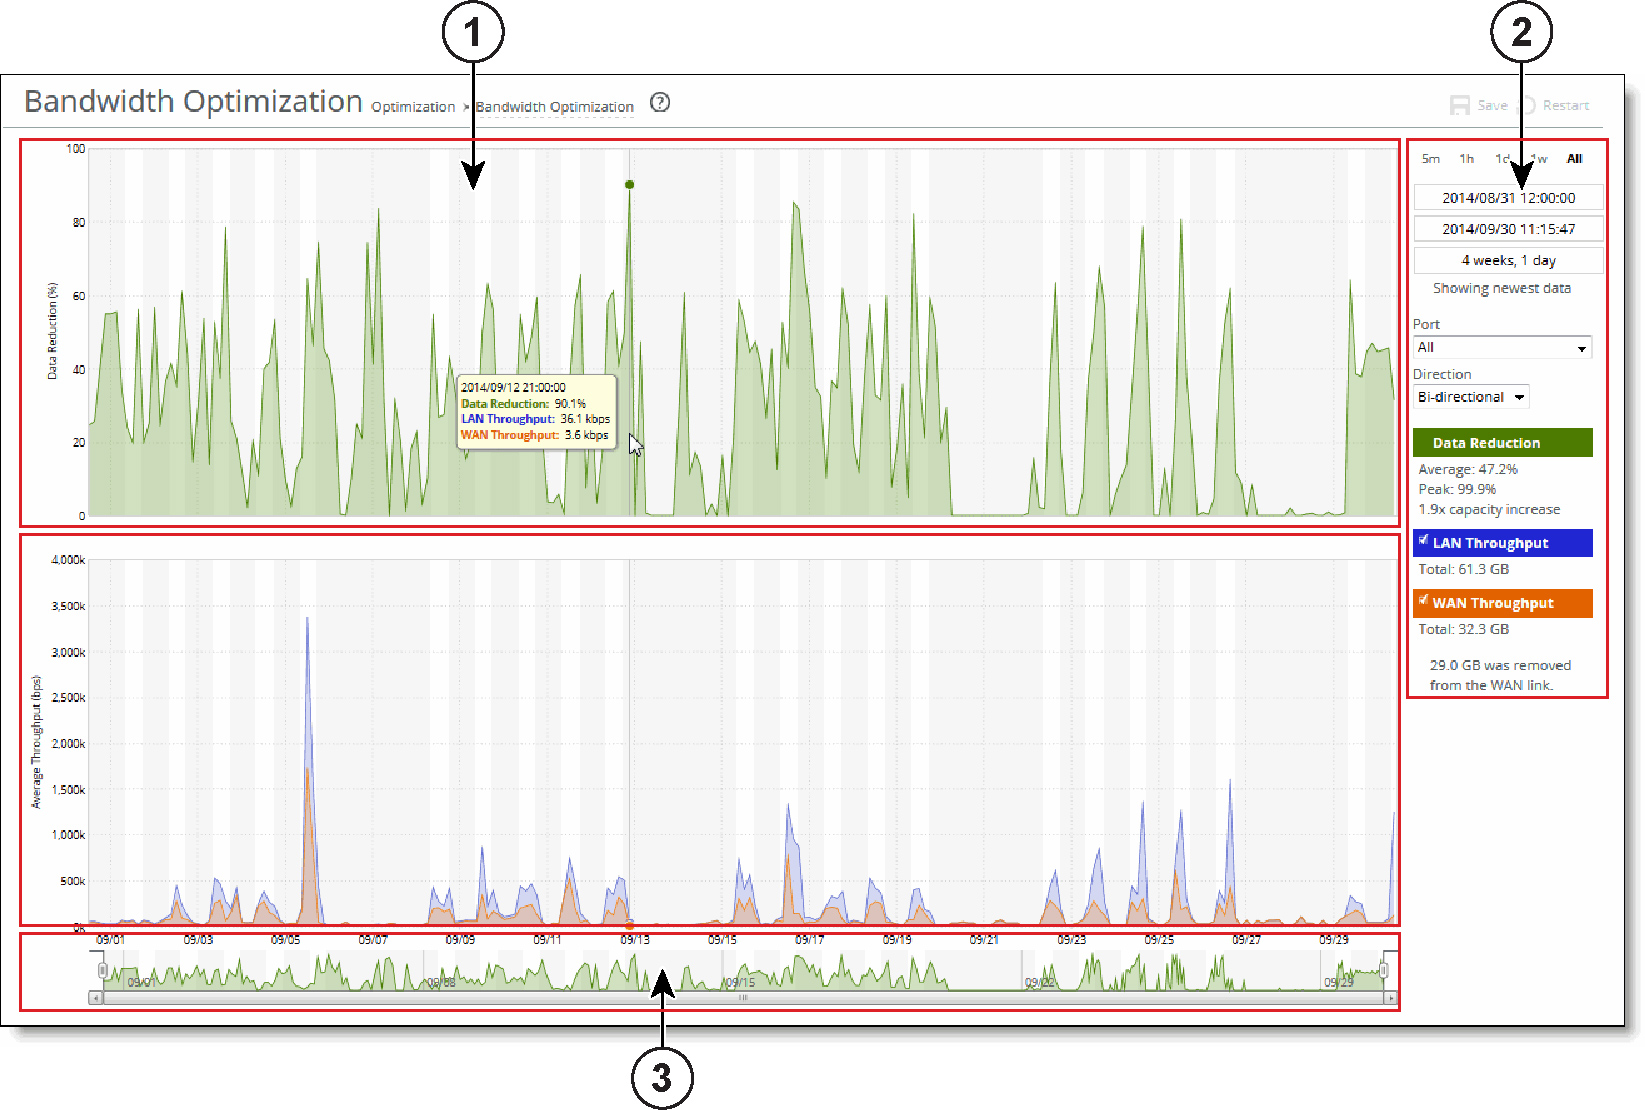
 Plot area
  Control panel
 Navigator
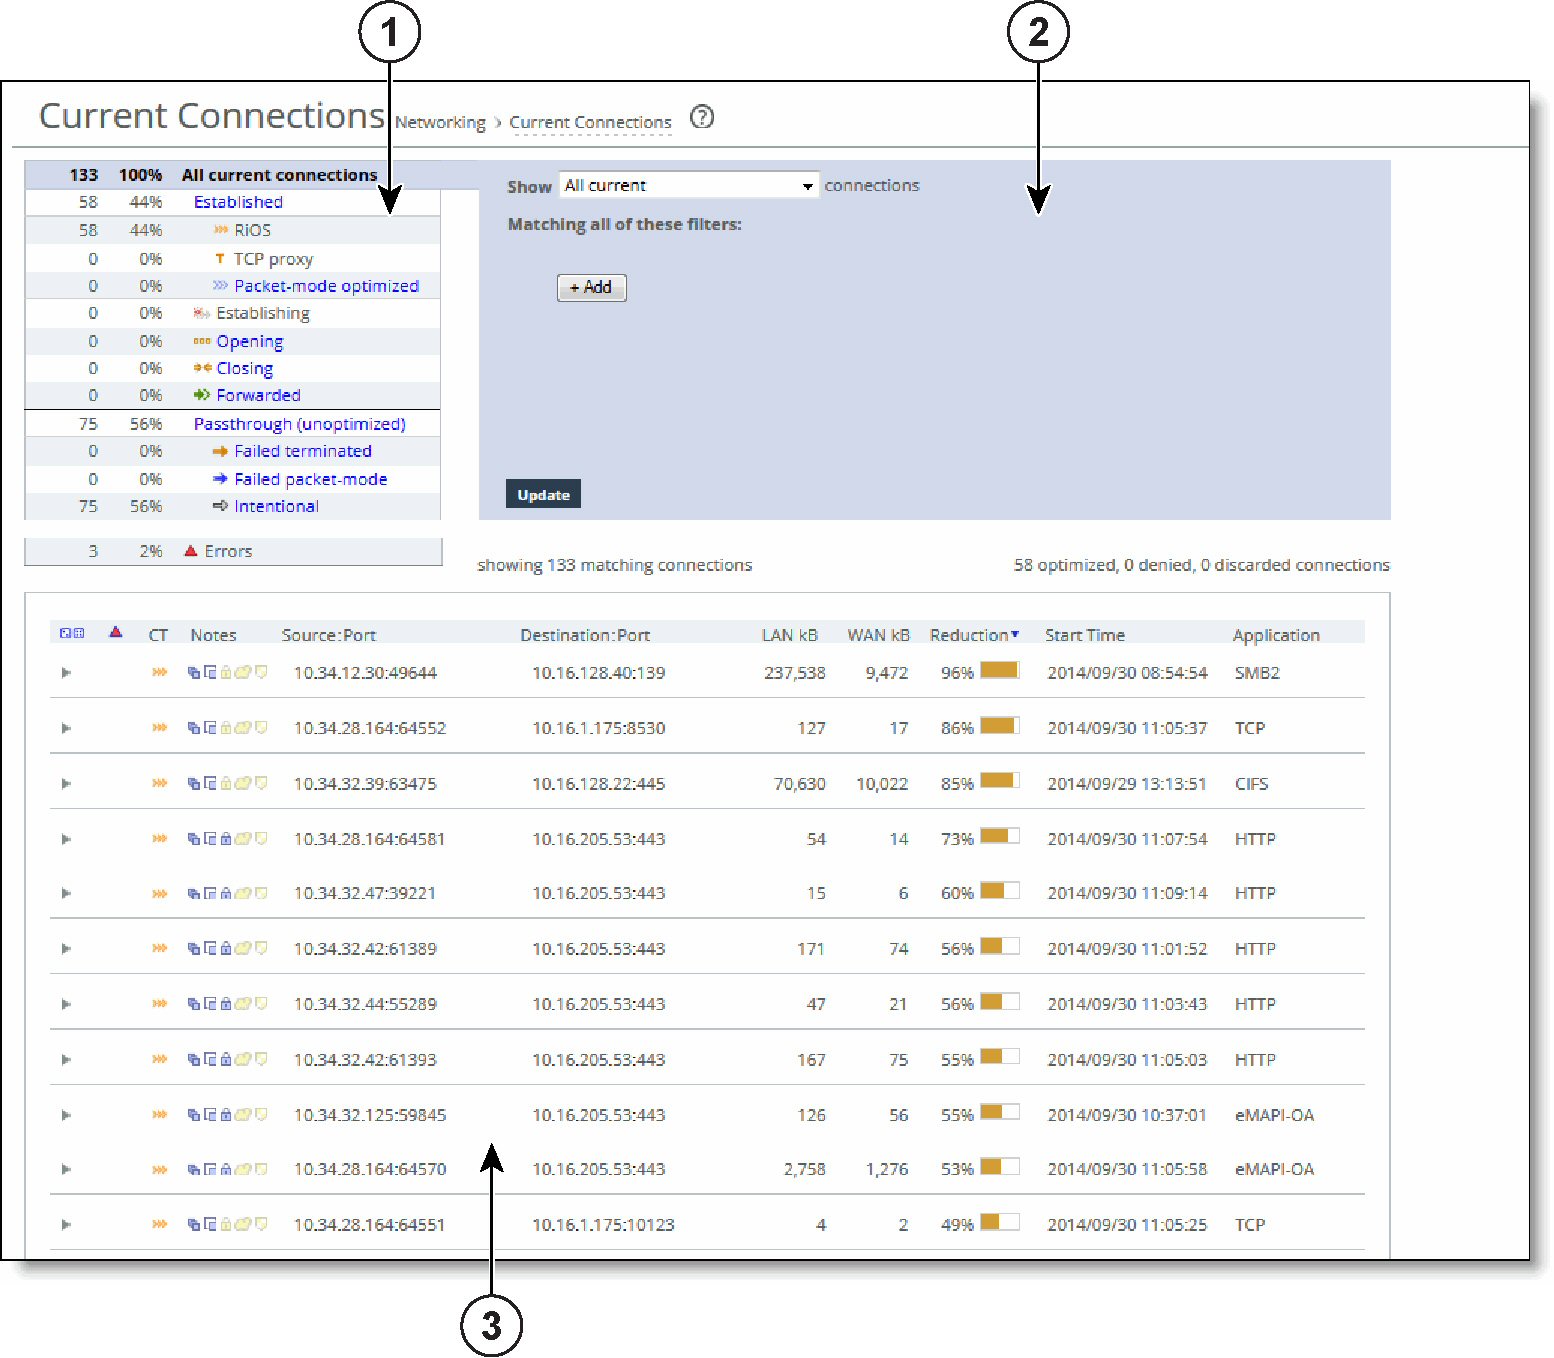
 Connections summary
Connection type | Icon | Description |
All current connections | Displays the total number of connections the appliance detects at the time you access the report, refresh the page, or click the Update button. It includes the connections that the appliance is passing through unoptimized, and connections that do not appear in the connections table. | |
Established | Displays the total optimized, active connections. | |
 | RiOS - Displays the double-ended, non-SCPS connections. | |
 | RiOS + SCPS - Displays the total RiOS and SCPS connections established between two appliances. Because both appliances are SCPS compatible, this is a double-ended connection that benefits from traditional RiOS optimization (SDR and LZ). | |
 | SCPS - Displays all current single-ended SCPS-optimized connections as a portion of the total. | |
 | TCP proxy - Displays the total non-SCPS single-ended interception connections. An SEI connection is established between a single appliance paired with a third-party device running TCP-PEP (Performance Enhancing Proxy). | |
 | Packet-mode optimized - Displays the total flows that were optimized packet-by-packet with SDR bandwidth optimization. These include TCP and UDP flows over IPv4 or IPv6. Packet-mode flows are considered to be neither single-ended nor double-ended. You must enable path selection and packet-mode optimization to view optimized UDP flows. To enable path selection, choose Networking > Network Services: Path Selection. | |
Establishing |  | Displays the total newly forming, initiating connections. The connection is being established but does not yet have an inner channel. Establishing connections count toward the connection count limit on the appliance because, at any time, they might become a fully opened connection. |
Opening |  | Displays the total half-open active connections. A half-open connection is a TCP connection in which the connection has not been fully established. Half-open connections count toward the connection count limit on the appliance because, at any time, they might become a fully opened connection. If you are experiencing a large number of half-open connections, consider a more appropriately sized appliance. |
Closing |  | Displays the total half-closed active connections. Half-closed connections are connections that the appliance has intercepted and optimized but are in the process of becoming disconnected. These connections count toward the connection count limit on the appliance. (Half-closed connections might remain if the client or server does not close its connections cleanly.) If you are experiencing a large number of half-closed connections, consider a more appropriately sized appliance. |
Forwarded |  | Displays the total number of connections that were forwarded when you have configured a connection-forwarding neighbor to manage the connection. For details about connection forwarding, see Configuring connection forwarding features. |
Passthrough (unoptimized) | Displays the total number of connections that were passed through unoptimized. You can view and sort these connections by intentional and unintentional pass-through in the connections table that follows this summary. | |
 | Failed terminated - Displays the total number of terminated connections that were passed through unoptimized, because of reasons other than in-path rules. | |
 | Failed packet-mode - Displays the total number of packet-mode flows that were passed through unoptimized, because of reasons other than in-path rules. You must enable path selection or packet-mode optimization or both to view pass-through UDP flows. To enable path selection, choose Networking > Network Services: Path Selection. | |
 | Intentional - Displays the total number of connections that were intentionally passed through unoptimized by in-path rules. | |
Errors |  | Displays all connections that have application or transport protocol errors as a portion of the total connections. |
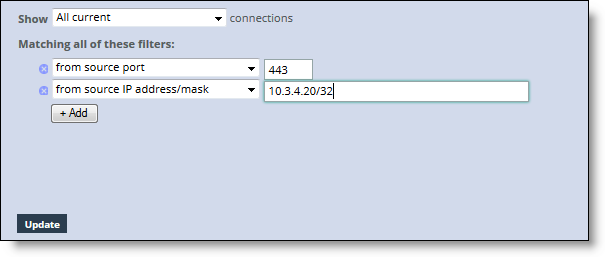
 Query area
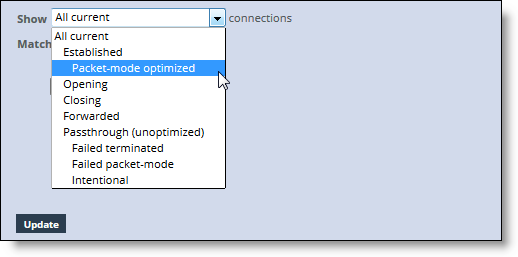
Connection type | Description |
All current | Displays the total number of connections the appliance detects, including the connections that are passed through unoptimized. This selection removes any previous selections or filters. |
Established | Displays the total optimized, active connections. |
Packet-mode optimized | Displays the total connections that were optimized packet-by-packet with SDR bandwidth optimization. These connections include TCP IPv4, TCP IPv6, UDP IPv4, and UDP IPv6 connections. You must enable path selection and packet-mode optimization to view optimized UDP flows. To enable path selection, choose Networking > Network Services: Path Selection. |
Opening | Displays the total half-open active connections. A half-open connection is a TCP connection in which the connection has not been fully established. Half-open connections count toward the connection count limit on the appliance because, at any time, they might become a fully opened connection. If you are experiencing a large number of half-open connections, consider a more appropriately sized appliance. |
Closing | Displays the total half-closed active connections. Half-closed connections are connections that the appliance has intercepted and optimized but are in the process of becoming disconnected. These connections are counted toward the connection count limit on the appliance. (Half-closed connections might remain if the client or server does not close its connections cleanly.) If you are experiencing a large number of half-closed connections, consider a more appropriately sized appliance. |
Forwarded | Displays the total number of connections forwarded by the connection-forwarding neighbor managing the connection. |
Passthrough (unoptimized) | Displays the total number of connections that were passed through unoptimized. You can view and sort these connections by intentional and unintentional pass-through in the individual connections table that follows the connections summary. |
Failed terminated | Displays the total number of terminated connections that were passed through unoptimized. |
Failed packet-mode | Displays the total number of packet-mode flows that were passed through unoptimized. |
Intentional | Displays the total number of connections that were intentionally passed through unoptimized. |
 Connections table
Column | Icon | Description |
Connection Details | Click the connection to display the current connections details. See Viewing the Current Connections report details. Because the details are a snapshot in time, by the time you click the connection, it could be gone or in a different state. If the connection is no longer available, a message tells you that the connection is closed. To refresh the display, click Update. | |
| Protocol Error - Displays a protocol error for both transport and application conditions. This list contains some of the conditions that trigger errors; it is a small subset of possible error conditions: •When the Optimize Connections with Security Signatures feature is enabled (which prevents SMB signing). This is an expected response. For details about preventing SMB signing, see Configuring CIFS optimization. •If a problem occurs while optimizing encrypted MAPI traffic. For details about enabling optimization of encrypted MAPI traffic, see Configuring MAPI optimization. •If a problem occurs with SSL optimization or the secure inner channel. •If a SRDF protocol error occurs when attempting to optimize traffic originating from the LAN side of the appliance. Check the LAN-side Symmetrix array for compatibility. Click the connection for more details about the error. | |
CT (Connection Type) | | Established - Indicates that the connection is established and active. |
| Intentional Passthrough - Indicates that the connection was intentionally passed through unoptimized because of in-path rules. | |
| Failed terminated - Indicates that the connection was passed through unoptimized. | |
| Failed packet-mode - Indicates that the packet-mode flow was passed through unoptimized. | |
| Establishing - Indicates that the connection is initiating and is not yet fully established. The source and destination ports appear as n/a. | |
| Opening (Optimized) - Indicates that the connection is half-open and active. A half-open connection is a TCP connection that has not been fully established. | |
| Closing (Optimized) - Indicates that the connection is half-closed and active. A half-closed connection has been intercepted and optimized by the appliance but is in the process of becoming disconnected. | |
| Forwarded - Indicates that the connection is forwarded by the connection-forwarding neighbor managing the connection. For details about connection forwarding, see Configuring connection forwarding features. | |
Notes | Displays connection icons that indicate the current state of the connection. The connection states can be one of these: | |
 | Compression Enabled - Indicates that LZ compression is enabled. | |
 | SDR Enabled - Indicates that SDR optimization is enabled. | |
 | WAN Encryption Enabled - Indicates that encryption is enabled on the secure inner channel (WAN). For details, see Configuring secure peers. | |
 | Cloud Acceleration ON - Indicates that the Cloud acceleration service for SaaS applications is enabled. | |
Source:Port | Displays the connection source IP address and port. | |
Destination:Port | Displays the connection destination IP address and port. | |
LAN/kB WAN/kB | Displays the amount of LAN or WAN throughput, in kilobytes. | |
Reduction | Displays the degree of WAN traffic optimization as a percentage of LAN traffic sent. Higher percentages mean that fewer bytes were sent over the WAN. Red squares indicate that an optimizing connection is currently showing 0 percent data reduction, which might be caused by multiple scenarios. Typically, 0 percent data reduction occurs when the system is optimizing a session containing encrypted payload. You can set up an in-path pass-through rule to prevent the system from interception the connection for optimization. | |
Start Time | Displays the time that the connection was started. This column does not apply to preexisting connections. Select the column heading to sort data start time in ascending or descending order. | |
Application | Displays the application associated with the connection: for example: TCP, CIFS, MAPI, eMAPI-OA (encrypted MAPI Outlook Anywhere), or HTTP. When Application Visibility is enabled (the default), the table displays the hierarchical, DPI-based application name (for example, HTTP > Facebook), instead of just the port-based name (for example, HTTP). When you expand a connection, a new Application row displays the hierarchical name, when available, or the port-based name if not. (For newly formed connections, the application name might have changed from what was reported in the table). Application visibility gives you a better sense of what applications are running instead of just seeing traffic through port numbers or web traffic classified as generic HTTP. |
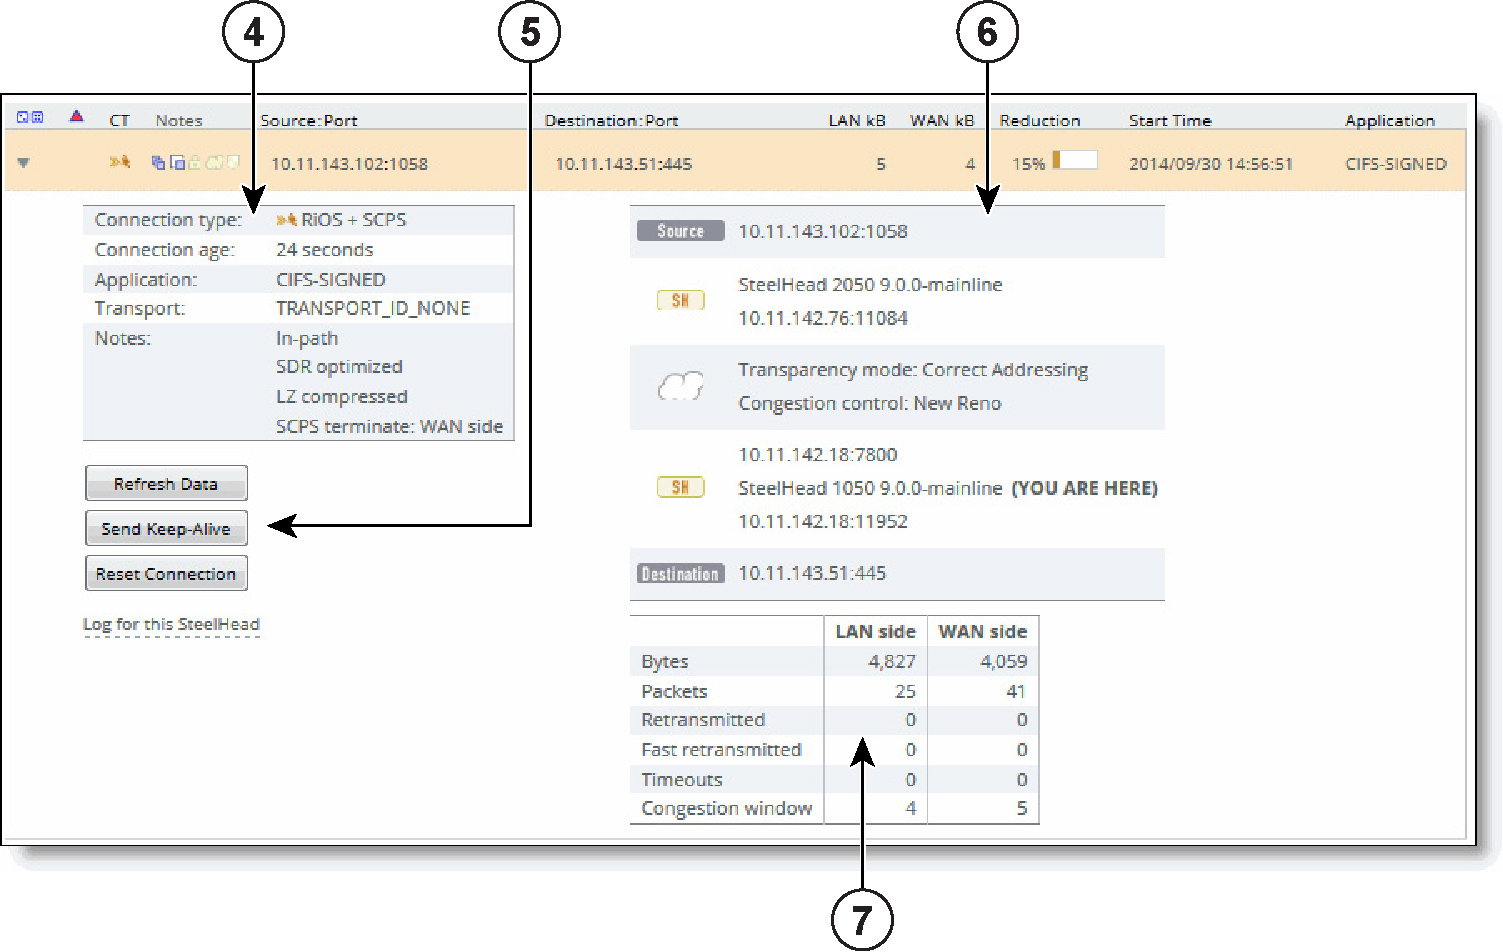

 Connection details
Data | Description (varies by connection type) |
Connection Information | Connection type - Displays the connection type icon and whether the connection is established, opening, or closing. Connection age - Displays the time since the connection was created. Transport - Displays the transport protocol name: for example, SSL inner. Application - Displays the application corresponding to the connection (for example, NFS). When Application Visibility is enabled, more detailed protocol information is shown for some applications. For example, HTTP-SharePoint is displayed as the WebDAV or FPSE protocols. Client side - Displays whether this appliance is on the client side. In-path - Indicates whether the connection is in-path. Protocol - Displays the low-level protocol that RiOS is using inside the packet-mode channel. The protocol can be UDP, TCP, or variants. Application error - Displays the application protocol error, if one exists. Transport error - Displays the transport protocol error, if one exists. SaaS application - Displays the SaaS application name, if one exists. Cloud acceleration state - Displays the SaaS connection state, if an SaaS application is running. GeoDNS IP result - Displays the GeoDNS IP address that the appliance is using to optimize Office 365. The connection summary displays the original destination IP address. SkipWare compression in - Indicates that the single-ended optimized connection is applying Skipware105 compression on incoming data. SkipWare compression out - Indicates that the single-ended optimized connection is applying Skipware105 compression on outgoing data. Pre-existing asymmetric - Indicates that the connection is traveling an asymmetric route and existed before the last restart of the optimization service. Pre-existing - Indicates that the connection existed before the last restart of the optimization service. Inbound QoS class - Indicates the QoS inbound class the connection is associated with when shaping is enabled. When the connection carries multiple classes, the report displays Variable. Outbound QoS class - Indicates the QoS outbound class the connection is associated with when shaping is enabled. When the connection carries multiple classes, the report displays Variable. Outbound QoS DSCP - Indicates the DSCP marking value for the connection when marking is enabled, even if it is zero. The report displays the value from the inner ToS. When the connection carries multiple values, the report displays Variable. When relevant, the Notes section displays several details that are binary in nature. |
All optimized connections might show any of these states: Client side - Indicates that the appliance is on the client side of the connection. SDR optimized - Indicates that SDR optimization is enabled. LZ compressed - Indicates that LZ compression is enabled. | |
Packet-mode optimized connections might show: Incomplete parse - Indicates that the inner channel exists but the connection through the channel is not fully formed. | |
Optimized, nonpacket mode connections might show any of these states: In-path - Indicates an in-path connection. Single-ended - Indicates that the connection involves only one appliance. WAN encrypted - Indicates that encryption is enabled on the secure inner channel (WAN). Cloud accelerated - Indicates that the Cloud acceleration service for SaaS applications is enabled. | |
At least one of these items appear for SCPS connections: SCPS initiate WAN - Indicates that the appliance has initiated the SCPS connection on the WAN. SCPS initiate LAN - Indicates that the appliance has initiated the SCPS connection on the LAN. SCPS terminate WAN - Indicates that the appliance has terminated the SCPS connection on the WAN. SCPS terminate LAN - Indicates that the appliance has terminated the SCPS connection on the LAN. | |
WAN and LAN-Side Statistics | LAN Bytes - Displays the total LAN bytes transmitted. WAN Bytes - Displays the total WAN bytes transmitted. Retransmitted - Displays the total packets retransmitted. Fast Retransmitted - Displays the total packets fast retransmitted. Fast retransmit reduces the time a sender waits before retransmitting a lost segment. If an acknowledgment is not received for a particular segment with a specified time (a function of the estimated round-trip delay time), the sender assumes the segment was lost in the network, and retransmits the segment. Timeouts - Displays the number of packet transmissions that timed out because no ACK was received. Congestion Window - Displays number of unACKed packets permitted, adjusted automatically by the SteelHead, depending on WAN congestion. |
Data | Description (varies by connection) |
Relayed | Displays the number of bytes relayed if all uplinks are down. |
Dropped | Displays the number of bytes dropped if all uplinks are down. |
Bypassed | Displays the number of bytes bypassed if all uplinks are down. |
Reflected | Displays the number of bytes reflected. |
Local uplink | Displays the uplink name. |
Remote uplink | Displays the remote uplink name. |
Status | Displays whether the uplink is reachable (Up) or unreachable (Down). |
Last started | Displays the time the connection started using the uplink. |
Bytes | Displays the total number of bytes transferred through the uplink. Note: The LAN kB value and this number do not match. This value displays only the bytes using path selection on the WAN. |
DSCP | Displays the DSCP marking set for the uplink. |
Data | Description (varies by connection) |
Connection Information | Connection Type - Displays a connection type icon and whether the pass-through was intentional or unintentional. Displays the forwarded reduction percentage bar for forwarded connections. Connection Age - Displays the time since the connection was created. Transport - Displays the transport protocol name: for example, SSL inner. Application - Displays the application corresponding to the connection: for example, NFS. Client-Side - Displays whether the connection is on the client side. Pre-Existing - Displays whether the connection existed before the last restart of the optimization service. Passthrough Reason - Displays the reason for passing through or forwarding the connection. |
Value | Pass-through reason (varies by connection) | Description | Action |
0 | None | None | None |
1 | Preexisting connection | Connection existed before SteelHead started. | Create a connection. |
2 | Connection paused | SteelHead is not intercepting connections. | Check that the service is enabled, in-path is enabled, the neighbor configuration, and whether the appliance is in admission control. |
3 | SYN on WAN side | Client is on the SteelHead WAN side. | Either this is the server-side SteelHead and there is no client-side appliance, or the client-side appliance did not probe. Check the cabling if it is really the client-side SteelHead. Because VSP is enabled by default on an Edge, and the default subnet side rule assumes that all traffic is coming from the WAN, client-side connections are not being optimized. Configure a subnet side rule to identify traffic that should be treated as LAN-side traffic. Place the rule at the start of the subnet side rules list, before the default subnet side rule. |
4 | In-path rule | In-path rule matched on the client-side SteelHead is pass-through. | Check the in-path rules. |
5 | Peering rule | Peering rule matched on the server-side SteelHead is pass-through. | Check the peering rules. |
6 | Inner failed to establish | Inner connection between SteelHeads failed. | Check the connectivity between the client-side appliance and the server-side SteelHead. |
7 | Peer in fixed-target rule down | The target of a fixed-target rule is destined to a failed peer. | Check the connectivity between the client-side appliance and the server-side SteelHead. |
8 | No SteelHead on path to server | No server-side SteelHead. | Check that the server-side appliance is up and check that the connection goes through the server-side SteelHead. |
9 | No route for probe response | No route to send back probe response. | Check in-path gateway on the server-side SteelHead. |
10 | Out of memory | Memory problem while copying packet. | Check if the appliance is out of memory. |
11 | No room for more TCP options | Not enough space in TCP header to add probe. | This condition occurs when another device added TCP options before the appliance. Take a TCP dump to check which TCP options are in the SYN packet. Search for those options to learn what device uses them. |
12 | No proxy port for probe response | There is no service port configured on server-side SteelHead. | Configure a service port. |
13 | RX probe from failover buddy | The connection is intercepted by failover buddy. | No action is necessary. |
14 | Asymmetric routing | The connection is asymmetric. | Check the asymmetric routing table for reason. |
15 | Middle SteelHead | The SteelHead is not the first or last SteelHead. | Only happens when the Enhanced Auto-Discovery Protocol is enabled. |
16 | Error connecting to server | The server-side SteelHead could not connect to the server. | Only happens when the Enhanced Auto-Discovery Protocol is enabled. |
17 | Half open connections above limit | The client has too many half-opened connections. | Check if many connections open quickly from the same client. |
18 | Connection count above QOS limit | There are too many connections for that QoS class. | Check the QoS class. |
19 | Reached maximum TTL | The probe has an incorrect TTL. | Take a trace to check the probe. |
20 | Incompatible probe version | The probe has an incompatible version number. | Check if the new probe format is enabled, it is disabled by default. |
21 | Too many retransmitted SYNs | The client SYN has been retransmitted too many times. | Check if there is a firewall that does not like the probe TCP option. |
22 | Connection initiated by neighbor | The connection is intercepted by a neighbor. | No action is necessary. |
23 | Connection for local host | The connection is to the in-path interface. | No action is necessary. |
24 | Unknown reason | The pass-through reason does not match any other description. | No action is necessary. |
25 | Connection from proxy target | Because the connection originates from an IP address that is also the IP address of a fixed target rule, it is not intercepted. | No action is necessary. |
26 | SYN before SFE outer completes | The client connection was passed through at the client-side SteelHead and the client's pure SYN was seen at the server-side SteelHead. | Check if there is a firewall that does not like the probe TCP option. |
27 | Transparent inner on wrong VLAN | The inner connection seen on VLAN is different than the in-path VLAN. | No action is necessary. |
28 | Transparent inner not for this host | No action is necessary. | |
29 | Error on neighbor side | The neighbor SteelHead returned an error to a connection-forwarding request. | Check the health of the configured neighbors. |
30 | SYN/ACK, but no SYN | There is asymmetric routing - received SYN/ACK but no SYN. | Check your routing. |
31 | Transparency packet from self | For Riverbed internal use only. | No action is necessary. |
32 | System is heavily loaded | The SteelHead is experiencing a heavy traffic load. | Contact Riverbed Support. You might require a larger model appliance. |
33 | SYN/ACK at MFE not SFE | There is asymmetric routing around the server-side SteelHead. | Check your routing. |
34 | Windows branch mode detected | The client-side is a SteelHead Mobile. Optimization is occurring between the SteelHead Mobile and the server-side SteelHead, so the connection is passed through on the client-side SteelHead. | No action is necessary. |
35 | Transparent RST to reset firewall state | The optimization service has sent a RST to clear the probe connection created by the SteelHead and to allow for the full transparent inner connection to traverse the firewall. | No action is necessary. |
36 | Error on SSL inner channel | An inner channel handshake has failed with peer. | Check the SSL configuration on both appliances. |
37 | Netflow only: Ricochet packet of optimized connection | This pass-through reason is attributed to a flow reported to a v9 NetFlow collector. A probe and packet have been sent by the SteelHead back through itself. For example, in an in-path setup, if a client-side SteelHead gateway is on its WAN side, all packets sent to the client will first go to the gateway and be sent back through the SteelHead on the way to the client. | Packet ricochet can be avoided in many environments by enabling simplified routing. |
38 | Passthrough due to MAPI admission control | New MAPI connections will be passed through due to high connection count. | New MAPI connections are optimized automatically when the MAPI traffic has decreased. |
39 | A SYN or RST packet contains data | ||
40 | Failed to discover SCPS device | RiOS cannot find an SCPS device. | |
41 | No matching client/server IPv6 scope | RiOS cannot set up the outer channel connection. | RiOS passes all packets through until it creates the outer channel. |
42 | Failed to create sport outer channel | RiOS cannot set up the outer channel connection. | RiOS passes all packets through until it creates the outer channel. |
43 | Flows not matching in-path rule | RiOS cannot match this traffic flow to any packet-mode optimization in-path rule. A packet-mode optimization rule defines the inner channel characteristics. | RiOS passes all packets through while the flow is in this state. Go to Optimization > In-Path rules to add a fixed-target packet-mode optimization in-path rule. |
44 | Packet mode channel setup pending | RiOS is attempting to set up the inner IPv4 or IPv6 channel connection. | RiOS passes all packets through until it creates the inner IPv4 or IPv6 channel. |
45 | Peer does not support packet-mode optimization | The peer SteelHead to which RiOS needs to establish the inner IPv4 or IPv6 channel connection does not support packet-mode optimization or packet-mode optimization is not enabled. | RiOS stops trying to optimize connections using packet-mode optimization with the peer. |
46 | Generic Flow error | A packet-mode optimization traffic flow transitions to this state when RiOS encounters one of these unrecoverable errors: •There is not enough memory to set up the inner channel. •The system has requested that RiOS kill the traffic flow. When RiOS receives this error, the SteelHead abandons all attempts to optimize the flow. | RiOS passes the flow through for its lifetime. |
47 | Failed to cache sock pointer | While configured for packet-mode optimization, RiOS cannot locate the socket pointer used to exchange packets through the inner channel. The system is attempting to write packets to the ring, but the socket is closed. This condition can occur when the optimization service shuts down unexpectedly. | Go to Administration > Maintenance: Services and restart the optimization service. |
48 | Packet mode optimization disabled | The connection is being passed through because packet-mode optimization is disabled. | Go to Optimization: Network Services > In-path Rules and enable packet-mode optimization. |
49 | Optimizing local connections only | On an Edge, the connection is being passed through because it did not originate locally. | |
50 | Netflow only: probe packet of optimized connection | ||
51 | IPv6 connection forwarding requires multi-interface support | RiOS is passing the connection through because the client-side SteelHead is configured without multi-interface connection forwarding. This configuration does not support IPv6. | Go to Networking Network Integration > Connection Forwarding and enable multiple interface support. |
52 | Neighbor does not support IPv6 | RiOS is passing the connection through because a connection-forwarding neighbor does not support IPv6. | Upgrade the connection-forwarding neighbor to RiOS 8.0 or later. |
53 | Reached the hard limit for the number of entries | RiOS is passing the connection through because it hit the maximum allowed limit for nonreusable connection entries. | |
54 | Connection or flow from GRE IPv4 tunnel |
Value | Reason | Description | Action |
0 | None | None | None |
1 | Optimized connection | Connection is redirected through the SteelHead SaaS to a SaaS service. | No action is necessary. |
Value | Pass-through reason (varies by connection) | Description | Action |
2 | Inner Connection through Cloud Accelerator | An inner connection to a remote SteelHead is running in the cloud. | No action is necessary. |
3 | Not a supported SaaS destination | Connection is through a SaaS service that is not supported, subscribed to, or enabled. | No action is necessary; however, if you want to optimize this destination IP address, contact Riverbed Support. |
4 | Due to configured In-path rule | Connection is not redirected through the SteelHead SaaS due to an in-path rule to disable cloud acceleration. | Check that the Cloud Acceleration field in the relevant in-path rule is set to Auto. |
5 | Due to configured Peering rule | Connection is not redirected through the SteelHead SaaS due to a peering rule to disable cloud acceleration. | Check that the Cloud Acceleration field in the relevant peering rule is set to Auto. |
6 | Cloud acceleration disabled | Connection is not redirected through the SteelHead SaaS because it is disabled. | Check the cloud accelerator configuration. Go to Optimization: SAAS > Cloud Accelerator and select the Enable Cloud Acceleration check box in the Cloud Accelerator page. |
7 | Redirection disabled globally | Connection is not redirected through the SteelHead SaaS because cloud acceleration redirection is disabled. | Go to Optimization: SAAS > Cloud Accelerator and select the Enable Cloud Acceleration Redirection check box in the Cloud Accelerator page. |
8 | Redirection disabled for relay | Connection is not redirected through SteelHead SaaS because cloud acceleration redirection for this in-path interface is disabled. | Check the Cloud Accelerator redirection configuration for the relevant in-path interface on the command-line interface. Enter this command on the command-line interface: show service cloud-accel For details, see the Riverbed Command-Line Interface Reference Manual. |
9 | Cloud proxy is down | Connection is not redirected through SteelHead SaaS because the redirection service encountered an error. | Contact Riverbed Support. |
10 | No PQID added by first SteelHead | Connection is not redirected through SteelHead SaaS because the SteelHead appliance closest to the client has SteelHead SaaS disabled or misconfigured. | Check the Cloud Accelerator configuration on the client-side appliance. |
11 | Failed to append CP code | Connection is not redirected through SteelHead SaaS because of a packet processing error. | Contact Riverbed Support. |
12 | SYN retransmit (backhauled) | Connection is not redirected through SteelHead SaaS because too many SYN retransmits were received from the client. | Check if there is a firewall that does not allow inbound or outbound UDP packets for the appliance. |
13 | SYN retransmit (direct) | Connection is not redirected through SteelHead SaaS because too many SYN retransmits were received from the client. | Check if there is a firewall that does not allow inbound or outbound UDP packets for the appliance. |
14 | Passing to downstream SteelHead | Connection is not redirected through SteelHead SaaS because admission control is reached and there is a SteelHead downstream that might optimize the connection. | No action is necessary. |
15 | Passthrough SYN retransmit | Connection is not redirected through SteelHead SaaS because too many SYN retransmits were received from the client. | Check if there is a firewall that does not allow inbound or outbound UDP packets for the appliance. |
16 | Rejected by cloud proxy | Connection is not redirected through SteelHead SaaS because the SteelHead SaaS network rejected the connection. | Contact Riverbed Support. |
17 | Invalid Entitlement code | Connection is not redirected through SteelHead SaaS because of an invalid SteelHead SaaS configuration. | Contact Riverbed Support. |
18 | Invalid timestamp | Connection is not redirected through SteelHead SaaS because the clock on the SteelHead is not synchronized. | Check the date and time settings on the appliance. |
19 | Invalid customer ID | Connection is not redirected through SteelHead SaaS because of an invalid SteelHead SaaS configuration. | Contact Riverbed Support. |
20 | Invalid ESH ID | Connection is not redirected through SteelHead SaaS because of an invalid SCA configuration. | Contact Riverbed Support. |
21 | Invalid SaaS ID | Connection is not redirected through SteelHead SaaS because of an invalid SCA configuration. | Contact Riverbed Support. |
22 | Connection limit reached | Connection is not redirected through SteelHead SaaS because the subscription limit for the number of connections is reached. | Contact Riverbed Support. You might require a higher SteelHead SaaS license. |
23 | Bandwidth limit reached | Connection is not redirected through SteelHead SaaS because the subscription limit for bandwidth used is reached. | Contact Riverbed Support. You might require a higher SteelHead SaaS license. |
 Tools
Tools
Control | Description |
Send Keep-Alive | For an optimized connection, click to send a keepalive message to the outer remote machine (the machine that is connected to this appliance). This operation is not available for a pass-through connection. This button is dimmed for users logged in as a monitor user. |
Refresh Data | Click to retrieve the most recent data for the connection. |
Reset Connection | Click to send a RST packet to both the client and server to close the connection. You can reset both optimized and pass-through connections. You cannot reset a forwarded connection. Note: If no data is being transferred between the client and server when you click Reset Connection, the connection is not reset immediately. It resets the next time the client or server tries to send a message. Therefore, when the application is idle, it might take a while for the connection to disappear. This button is dimmed for users logged in as a monitor user. |
Log for this SteelHead | Click to display the System Logs page. |
 Network topology
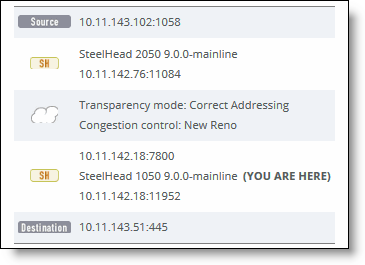
 LAN/WAN table
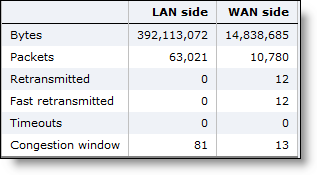
Connection type | Description |
Optimized | Displays the total connections established and optimized, plus the half-open and half-closed connections (where half-open and half-closed are TCP connection states). |
Optimized (Active) | Displays the total active connections established, optimized, and flowing. |
Passthrough | Displays the total connections passed through unoptimized. |
Forwarded | Displays the total number of connections forwarded by the connection-forwarding neighbor managing the connection. |
Optimized (Half Open) | Displays the percentage of half-opened connections represented in the optimized connection total. A half-open connection is a TCP connection that has not been fully established. Half-open connections count toward the connection count limit on the appliance because, at any time, they might become a fully open connection. If you are experiencing a large number of half-opened connections, consider a more appropriately sized appliance. |
Optimized (Half Closed) | Displays the percentage of half-closed active connections represented in the optimized connection total. Half-closed connections are connections that the appliance has intercepted and optimized but are in the process of being disconnected. These connections are counted toward the connection count limit on the appliance. (Half-closed connections might remain if the client or server does not close its connections cleanly.) If you are experiencing a large number of half-closed connections, consider a more appropriately sized appliance. |
Control | Description |
Time interval | Select a report time interval of 5 minutes (5m), 1 hour (1h), 1 day (1d), 1 week (1w), All, or type a custom date. All includes statistics for the last 30 days. Time intervals that don’t apply to a particular report are dimmed. For a custom time interval, enter the start time and end time using the format yyyy/mm/dd hh:mm:ss. You can view the newest data and see data points as they’re added to the chart dynamically. To display the newest data, click Show newest data. |
Data series | Description |
Throughput | Displays the throughput in bits per second. |
Control | Description |
Time interval | Select a report time interval of 5 minutes (5m), 1 hour (1h), 1 day (1d), 1 week (1w), All, or type a custom date. All includes statistics for the last 30 days. Time intervals that don’t apply to a particular report are dimmed. For a custom time interval, enter the start time and end time using the format yyyy/mm/dd hh:mm:ss. You can view the newest data and see data points as they’re added to the chart dynamically. To display the newest data, click Show newest data. |
Neighbor | Select a neighbor from the drop-down list or All to display all neighbors. |
Control | Description |
Time interval | Select a report time interval of 5 minutes (5m), 1 hour (1h), 1 day (1d), 1 week (1w), All, or type a custom date. All includes statistics for the last 30 days. Time intervals that don’t apply to a particular report are dimmed. For a custom time interval, enter the start time and end time using the format yyyy/mm/dd hh:mm:ss. Because the system aggregates data on the hour, request hourly time intervals. For example, setting a time interval to 08:30:00 to 09:30:00 from two days ago doesn’t create a data display, whereas setting a time interval to 08:00:00 to 09:00:00 from two days ago will display data. When you request a custom time interval to view data beyond the aggregated granularity, the data is not visible because the system is no longer storing the data. For example, the following custom time intervals don’t return data because the system automatically aggregates data older than seven days into two-hour data points: •Setting a one-hour time period that occurred two weeks ago. •Setting a 75-minute time period that occurred more than 1 week ago. You can view the newest data and see data points as they’re added to the chart dynamically. To display the newest data, click Show newest data. |
Units | Select either packets/sec or bps from the drop-down list. |
Classes | Select Total or Selected classes from the drop-down list. Selected classes lets you narrow the report by choosing from drop-down lists of classes and remote sites (up to seven). You can’t select a class or a class @ site more than once. Click Update to change the QoS class selection without updating the chart. When the report display includes the total classes, the data series appear as translucent; selected classes appear as opaque. When the report display includes the total classes, the navigator shadows the total sent series. When the report display includes selected classes and remote sites, the navigator shadows the first nonempty sent series. A data series can be empty if you create a QoS class but it has not seen any traffic yet. Selecting a parent class displays its child classes. For example, the report for an HTTP class with two child classes named WebApp1 and WebApp2 displays statistics for HTTP, WebApp1, and WebApp2. When a selected class has descendant classes, the report aggregates the statistics for the entire tree of classes. It displays the aggregated tree statistics as belonging to the selected class. |
Control | Description |
Time interval | Select a report time interval of 5 minutes (5m), 1 hour (1h), 1 day (1d), 1 week (1w), All, or type a custom date. All includes statistics for the last 30 days. Time intervals that don’t apply to a particular report are dimmed. For a custom time interval, enter the start time and end time using the format yyyy/mm/dd hh:mm:ss. Because the system aggregates data on the hour, request hourly time intervals. For example, setting a time interval to 08:30:00 to 09:30:00 from two days ago doesn’t create a data display, whereas setting a time interval to 08:00:00 to 09:00:00 from two days ago will display data. When you request a custom time interval to view data beyond the aggregated granularity, the data is not visible because the system is no longer storing the data. For example, these custom time intervals don’t return data because the system automatically aggregates data older than seven days into two-hour data points: •Setting a one-hour time period that occurred two weeks ago. •Setting a 75-minute time period that occurred more than one week ago. You can view the newest data and see data points as they’re added to the chart dynamically. To display the newest data, click Show newest data. |
Units | Select either packets/sec or bps from the drop-down list. |
Classes | Select Total or Selected classes from the drop-down list. Selected classes lets you narrow the report by choosing from drop-down lists of classes and remote sites (up to seven). You can’t select a class or a class @ site more than once. Click Update to change the QoS class selection without updating the chart. When the report display includes the total classes, the data series appear as translucent; selected classes appear as opaque. When the report display includes the total classes, the navigator shadows the total received series. When the report display includes selected classes, the navigator shadows the first nonempty received series. A data series can be empty if you create a QoS class but it has not seen any traffic yet. Selecting a parent class displays its child classes. For example, the report for an HTTP class with two child classes named WebApp1 and WebApp2 displays statistics for HTTP, WebApp1, and WebApp2. When a selected class has descendant classes, the report aggregates the statistics for the entire tree of classes. It displays the aggregated tree statistics as belonging to the selected class. |
Controller properties | Description |
Private Address | Displays the private IP address of the secure transport controller to which the SteelHead has registered. |
Public Address | Displays the public IP address of the secure transport controller to which the SteelHead has registered. |
Status | Displays the current status of the connectivity to the secure transport controller. |
Last Keep-Alive | Displays the last time a keepalive message was sent from the SteelHead to the secure transport controller. |
Group Name | Displays the name of the secure transport group. |
Number of Peers | Displays how many peers are in the secure transport group. |
Peer Name | Displays the peer names within the secure transport group. |
Column | Description |
Rank | Displays the relative position of the traffic flow WAN bandwidth use. |
<Sender> IP Address 1:Port | Displays the first IP address and port for the connection. |
<Receiver> IP Address 2:Port | Displays the second IP address and port for the connection. |
Byte Count | Displays the total number of bytes sent and received by the first IP address. |
Control | Description |
Chart | Select the report display from the drop-down list: By Conversation, By Sender, By Receiver, By Host, or By Application Port. The default setting is By Conversation. |
Period | You can view the traffic statistics for the past hour, the past 24 hours, or all available hours. All is the default setting, which displays statistics for the entire duration the Edge has gathered statistics. This duration can be up to two days, depending on how long the service has been up and the traffic volume. Select All, Last Hour, or Last Day from the drop-down list. The default setting is All. Note: Top Talker statistics aren’t persistent between service restarts. |
Count | Specify how many top pairs of IP addresses and ports with the highest total traffic (sent and received) appear in the report. Each pair shows the number of bytes and packets sent and received at IP address 1. The default value is 50. Note: You can export the complete list of top talkers to a file in CSV format using the Export report. |
Protocol | Select Both, TCP, or UDP from the drop-down list. The default value is Both. |
Traffic Type | Select Both, Optimized, or Passthrough from the drop-down list. The default value is Both. |
Go | Displays the report. |
Column | Description |
Port | Displays the TCP/IP port number and application for each row of statistics. |
Reduction | Displays the amount of application data reduction. |
LAN Data | Displays the amount of application data on the LAN. |
WAN Data | Displays the amount of application data on the WAN. |
Traffic % | Calculates LAN-side data to indicate the percentage of the total traffic each port represents. |
Control | Description |
Period | Select a period of Last Minute, Last 5 Minutes, Last Hour, Last Day, Last Week, Last Month, or Custom from the drop-down list. For Custom, enter the Start Time and End Time and click Go. Use this format: yyyy/mm/dd hh:mm:ss |
Type | Select a traffic type of Optimized, Pass Through, or Both from the drop-down list. |
Traffic | Select a traffic direction from the drop-down list: • Bi-Directional - Traffic flowing in both directions. • WAN-to-LAN - Inbound traffic flowing from the WAN to the LAN. • LAN-to-WAN - Outbound traffic flowing from the LAN to the WAN. |
Refresh | Select a refresh rate from the drop-down list: •To refresh the report every 10 seconds, select 10 seconds. •To refresh the report every 30 seconds, select 30 seconds. •To refresh the report every 60 seconds, select 60 seconds. •To turn refresh off, click Off. |
Go | Displays the report. |
Data series | Description |
Peak Throughput | Displays the peak data activity. |
Average Throughput | Displays the average and total throughput. RiOS calculates the WAN average at each data point by taking the number of bytes transferred, converting that to bits, and then dividing by the granularity. For instance, if the system reports 100 bytes for a data point with a 10-second granularity, RiOS calculates: 100 bytes * 8 bits/byte / 10 seconds = 80 bps This calculation means that 80 bps was the average throughput over that 10-second period. The total throughput shows the data amount transferred during the displayed time interval. The average that appears below the Average Throughput is an average of all displayed averages. |
Control | Description |
Time interval | Select a report time interval of 5 minutes (5m), 1 hour (1h), 1 day (1d), 1 week (1w), All, or type a custom date. All includes statistics for the last 30 days. Time intervals that don’t apply to a particular report are dimmed. For a custom time interval, enter the start time and end time using the format yyyy/mm/dd hh:mm:ss Because the system aggregates data on the hour, request hourly time intervals. For example, setting a time interval to 08:30:00 to 09:30:00 from two days ago doesn’t create a data display, whereas setting a time interval to 08:00:00 to 09:00:00 from two days ago will display data. When you request a custom time interval to view data beyond the aggregated granularity, the data is not visible because the system is no longer storing the data. For example, these custom time intervals don’t return data because the system automatically aggregates data older than seven days into two-hour data points: •Setting a one-hour time period that occurred two weeks ago. •Setting a 75-minute time period that occurred more than one week ago. You can view the newest data and see data points as they’re added to the chart dynamically. To display the newest data, click Show newest data. |
Data series | Description |
Average bps | Displays the average data activity in all flows of an application in bits per second. The minimum sample granularity is 5 minutes. |
Per Flow Average bps | Displays the average trended throughput in all traffic flows of an application in bits per second. This data series indicates how bandwidth intensive an application is per user or flow. RiOS calculates the WAN average at each data point by taking the number of bytes transferred, converting that to bits, and then dividing by the granularity. For instance, if the system reports 100 bytes for a data point with a 10-second granularity, RiOS calculates: 100 bytes * 8 bits/byte / 10 seconds = 80 bps This calculation means that 80 bps was the average throughput over that 10-second period. |
Peak bps | Displays the peak data activity in bits per second. For larger granularity data points, this represents the largest 5 minute average within. For 5 minutes, this is the same as the average. |
Per flow Peak bps | Displays the peak trended data activity per traffic flow in bits per second. This peak is the largest per flow 5-minute bps within a larger sample. |
Control | Description |
Period | Select a period of Last 5 Minutes, Last Hour, Last Day, Last Week, Last Month, or Custom from the drop-down list. For Custom, enter the Start Time and End Time and click Go. Use the format yyyy/mm/dd hh:mm:ss. |
App Name Filter | Click a protocol or application name (for example, TCP, LDAP, SharePoint) to show only the selection. You can select only one filter at a time. For example, if the report is filtering on UDP and you click TCP, the report displays all TCP entries and clears the UDP filter. |
Direction | Select the traffic direction from the drop-down list. The default is outbound LAN > WAN traffic. |
Interface | Select an interface from the drop-down list. The default is all WAN and primary interfaces. |
Update | Click to update the chart without updating the application selection. |
Data series | Description |
App Throughput | Displays the throughput for all traffic flows in bits per second. The minimum sample granularity is 5 minutes. Throughput Peak - Mouse over the data series to display the peak data activity in bits per second. For larger granularity data points, this represents the largest 5 minute average within. For 5 minutes, this is the same as the average. Throughput Average - Mouse over the data series to display the average trended throughput for all traffic flows in kbps. |
Per-Flow Throughput | Displays the throughput per traffic flow in bits per second. Per-Flow Peak - Mouse over the data series to display the peak trended data activity per traffic flow in bits per second. This peak is the largest per flow 5-minute bps within a larger sample. Per-Flow Average - Mouse over the data series to display the average trended throughput in all traffic flows of an application in bits per second. This data series indicates how bandwidth-intensive an application is per user or flow. RiOS calculates the WAN average at each data point by taking the number of bytes transferred, converting that to bits, and then dividing by the granularity. For instance, if the system reports 100 bytes for a data point with a 10-second granularity, RiOS calculates: 100 bytes * 8 bits/byte / 10 seconds = 80 bps This calculation means that 80 bps was the average throughput over that 10-second period. |
Control | Description |
Time interval | Select a report time interval of 5 minutes (5m), 1 hour (1h), 1 day (1d), 1 week (1w), All, or type a custom date. All includes statistics for the last 30 days. Time intervals that don’t apply to a particular report are dimmed. For a custom time interval, enter the start time and end time using the format yyyy/mm/dd hh:mm:ss. You can view the newest data and see data points as they’re added to the chart dynamically. To display the newest data, click Show newest data. |
Interface | Select an interface from the drop-down list. The default is all interfaces. |
Direction | Select the traffic direction from the drop-down list. The default is outbound LAN > WAN traffic. |
Application Name | Type the first characters in the application name. When the application name and definition appears, select it from the list. You can select up to seven applications. Click Update Chart to update the chart without changing the application selection. |
Column | Description |
Interface | LAN - Displays statistics for the LAN interface. WAN - Displays statistics for the WAN interface. Primary - Displays statistics for the primary interface. Aux - Displays statistics for the auxiliary interface. Inpath - Displays statistics for the in-path interface. All virtual machines hook into the VMprimary, VMlocal and/or the VMaux interfaces to communicate with the outside world, SteelFusion, and RiOS. Statistics for virtual networking focus on gathering counters for these interfaces. VMprimary - Displays statistics for the virtual machine primary interface. VMlocal - Displays statistics for the virtual machine local interface, used to communicate with Edge and Core. VMaux - Displays statistics for the virtual machine auxiliary interface. Hpn (not available in Virtual Edge) - Displays statistics for the host private network interface. Eth - Displays statistics for the Ethernet interface. |
IP | Displays the IP address (if application) for the interface. |
Ethernet | Displays the MAC address, speed, and duplex setting for interface. Use this information to troubleshoot speed and duplex problems. Make sure the speed for the Edge matches the WAN or LAN interfaces. We recommend setting the speed to 100 and duplex to full. |
Link | Displays up or down to indicate the link status. |
Receive Packets | Displays the total number of packets, packets discarded, errors encountered, packets overrun, frames sent, and multicast packets sent. |
Transmit Packets | Displays the total number of packets, packets discarded, errors encountered, packets overrun, carriers used, and collisions encountered. |
Packet type | Description |
Packets Received | Displays the total packets received. |
Packets Sent | Displays the total TCP packets sent. |
Packets Retransmitted | Displays the total TCP packets retransmitted. |
Packets Fast Retransmitted | Displays the total TCP packets fast retransmitted. Fast retransmit is an enhancement to TCP that reduces the time a sender waits before retransmitting a lost segment. If an acknowledgment is not received for a particular segment with a specified time (a function of the estimated round-trip delay time), the sender assumes the segment was lost in the network, and retransmits the segment. |
Time-outs | Displays the number of time-outs. |
Loss Events | Displays the total number of loss events. |
Data series | Description |
LAN Peak | Displays the peak data activity. |
LAN P95 | Displays the 95th percentile for data activity. The 95th percentile is calculated by taking the peak of the lower 95 percent of inbound and outbound throughput samples. |
LAN Average | Displays the average throughput. RiOS calculates the LAN average at each data point by taking the number of bytes transferred, converting that to bits, and then dividing by the granularity. For instance, if the system reports 100 bytes for a data point with a 10-second granularity, RiOS calculates: 100 bytes * 8 bits/byte / 10 seconds = 80 bps This calculation means that 80 bps was the average throughput over that 10-second period. The average that appears below the LAN Average is an average of all displayed averages. |
WAN Peak | Displays the peak data activity. |
WAN P95 | Displays the 95th percentile for data activity. The 95th percentile is calculated by taking the peak of the lower 95 percent of inbound and outbound throughput samples. |
WAN Average | Displays the average throughput. RiOS calculates the WAN average at each data point by taking the number of bytes transferred, converting that to bits, and then dividing by the granularity. For instance, if the system reports 100 bytes for a data point with a 10-second granularity, RiOS calculates: 100 bytes * 8 bits/byte / 10 seconds = 80 bps This calculation means that 80 bps was the average throughput over that 10-second period. The average that appears below the WAN Average is an average of all displayed averages. |
Control | Description |
Time interval | Select a report time interval of 5 minutes (5m), 1 hour (1h), 1 day (1d), 1 week (1w), All, or type a custom date. All includes statistics for the last 30 days. Time intervals that don’t apply to a particular report are dimmed. For a custom time interval, enter the start time and end time using the format yyyy/mm/dd hh:mm:ss. Because the system aggregates data on the hour, request hourly time intervals. For example, setting a time interval to 08:30:00 to 09:30:00 from two days ago doesn’t create a data display, whereas setting a time interval to 08:00:00 to 09:00:00 from two days ago will display data. When you request a custom time interval to view data beyond the aggregated granularity, the data is not visible because the system is no longer storing the data. For example, these custom time intervals don’t return data because the system automatically aggregates data older than seven days into two-hour data points: •Setting a one-hour time period that occurred two weeks ago. •Setting a 75-minute time period that occurred more than one week ago. You can view the newest data and see data points as they’re added to the chart dynamically. To display the newest data, click Show newest data. |
Direction | Select a traffic direction from the drop-down list: • Bi-Directional - Traffic flowing in both directions. • WAN to LAN - Inbound traffic flowing from the WAN to the LAN. • LAN to WAN - Outbound traffic flowing from the LAN to the WAN. |
Port | Select a port or All to display all of the TCP ports on which the SteelHead has seen traffic. The list appends the port name to the number where available. If your SteelHead appliance is SaaS-enabled, select the SaaS application from the drop-down list. To see the definition of the SaaS application (for example, SFDC in the drop-down list refers to Salesforce.com), log in to the Riverbed Cloud Portal and click Cloud Accelerator. The application names and acronyms are listed in the SaaS Services Summary pane. |
Data series | Description |
Data Reduction % | Displays the peak and total decrease of data transmitted over the WAN, according to this calculation: (Data In – Data Out)/(Data In) Displays the capacity increase x-factor below the peak and total data reduction percentages. |
WAN and LAN Throughput | Depending on which direction you select, specifies one of these traffic settings: •Bi-Directional - Indicates traffic is flowing in both directions. •WAN-to-LAN - Indicates inbound traffic is flowing from the WAN to the LAN. •LAN-to-WAN - Indicates outbound traffic is flowing from the LAN to the WAN. |
Control | Description |
Time interval | Select a report time interval of 5 minutes (5m), 1 hour (1h), 1 week (1w), All, or type a custom date. All includes statistics for the past 30 days. Time intervals that don’t apply to a particular report are dimmed. For a custom time interval, enter the start time and end time using the format yyyy/mm/dd hh:mm:ss. Because the system aggregates data on the hour, request hourly time intervals. For example, setting a time interval to 08:30:00 to 09:30:00 from two days ago doesn’t create a data display, whereas setting a time interval to 08:00:00 to 09:00:00 from two days ago will display data. When you request a custom time interval to view data beyond the aggregated granularity, the data is not visible because the system is no longer storing the data. For example, these custom time intervals don’t return data because the system automatically aggregates data older than seven days into two-hour data points: •Setting a one-hour time period that occurred two weeks ago. •Setting a 75-minute time period that occurred more than one week ago. You can view the newest data and see data points as they’re added to the chart dynamically. To display the newest data, click Show newest data. |
Port | Select a port or All to select all ports from the drop-down list. If your SteelHead appliance is SaaS-enabled, select the SaaS application from the drop-down list. To see the definition of the SaaS application (for example, SFDC in the drop-down list refers to Salesforce.com), log in to the Riverbed Cloud Portal and click Cloud Accelerator. The application names and acronyms are listed in the SaaS Services Summary pane. |
Direction | Select a traffic direction (Bi-Directional, WAN to LAN, or LAN to WAN) from the drop-down list. |
Column | Description |
Name | Specifies the name of the peer appliance. |
IP Address | Specifies the IP address of the peer appliance. |
Model | Specifies the appliance model. |
Version | Specifies the appliance version. |
Licenses | Specifies the current appliance licenses. |
Log file | Description |
Recent syncs | Contains logs for the last few share synchronizations. The log includes how many directories, files, and bytes were received and how long it took to receive them. The log also lists any errors or deletions. |
Initial sync | Includes how many directories, files, and bytes were received initially and how long it took to receive them. The log also lists any errors or deletions. |
Last dry run | Includes a log of what would have been synchronized with the current share configuration, without actually synchronizing anything. |
Data series | Description |
Request Rate | Select to display the rate of HTTP objects, URLs, and object prefetch requests. |
Object Prefetch Table Hit Rate | Select to display the hit rate of stored object prefetches per second. The appliance stores object prefetches from HTTP GET requests for cascading style sheets, static images, and Java scripts in the Object Prefetch Table. |
URL Learning Hit Rate | Select to display the hit rate of found base requests and follow-on requests per second. The appliance learns associations between a base request and a follow-on request. Instead of saving each object transaction, the appliance saves only the request URL of object transactions in a Knowledge Base and then generates related transactions from the list. |
Parse and Prefetch Hit Rate | Select to display the hit rate of found and prefetched embedded objects per second. The appliance determines which objects are going to be requested for a given web page and prefetches them so that they are readily available when the client makes its requests. |
Control panel | Description |
Time interval | Select a report time interval of 5 minutes (5m), 1 hour (1h), 1 day (1d), 1 week (1w), All, or type a custom date. All includes statistics for the last 30 days. Time intervals that do not apply to a particular report are dimmed. For a custom time interval, enter the start time and end time using the format yyyy/mm/dd hh:mm:ss. You can view the newest data and see data points as they are added to the chart dynamically. To display the newest data, click Show newest data. |
Data series | Description |
Data From Cache | Displays the cumulative bps of video traffic served from the cache. Cache hits indicate that content is being served locally and avoiding round-trip bandwidth. |
Data From Server | Displays the cumulative bps of video traffic going to and coming from the server over the WAN. |
Video Sessions | Displays how many users are watching the video sessions. A video session is an open connection that has passed a video fragment. |
Control | Description |
Time interval | Select a report time interval of 5 minutes (5m), 1 hour (1h), 1 day (1d), 1 week (1w), All, or type a custom date. All includes statistics for the last 30 days. Time intervals that do not apply to a particular report are dimmed. For a custom time interval, enter the start time and end time using the format yyyy/mm/dd hh:mm:ss. You can view the newest data and see data points as they are added to the chart dynamically. To display the newest data, click Show newest data. |
Data series | Description |
Local Response Rate | Displays the number of NFS calls that were responded to locally. |
Remote Response Rate | Displays the number of NFS calls that were responded to remotely (that is, calls that traversed the WAN to the NFS server). |
Delayed Response Rate | Displays the delayed calls that were responded to locally but not immediately (for example, reads that were delayed while a read ahead was occurring and that were responded to from the data in the read ahead). |
Control | Description |
Time interval | Select a report time interval of 5 minutes (5m), 1 hour (1h), 1 day (1d), 1 week (1w), All, or type a custom date. All includes statistics for the last 30 days. Time intervals that don’t apply to a particular report are dimmed. For a custom time interval, enter the start time and end time using the format yyyy/mm/dd hh:mm:ss. You can view the newest data and see data points as they’re added to the chart dynamically. To display the newest data, click Show newest data. |
Data series | Description |
Data Reduction | Specifies the percentage of total decrease in overall data transmitted (when viewing all Symmetrix RDF groups). |
WAN/LAN Throughput | Specifies the total throughput transmitted over the WAN and LAN. |
Control | Description |
Time interval | Select a report time interval of 5 minutes (5m), 1 hour (1h), 1 day (1d), 1 week (1w), All, or type a custom date. All includes statistics for the last 30 days. Time intervals that don’t apply to a particular report are dimmed. For a custom time interval, enter the start time and end time using the format yyyy/mm/dd hh:mm:ss. You can view the newest data and see data points as they’re added to the chart dynamically. To display the newest data, click Show newest data. |
Symmetrix (RDF Group) | Select a Symmetrix server ID from the drop-down list to view detailed statistics per Symmetrix ID. Use the protocol srdf CLI command to map a logical Symmetrix ID to its set of network IP addresses. For example, the following commands create a Symmetrix ID, Sym1, and associate it with traffic originating from IP addresses 10.12.61.42 and 10.12.61.43: protocol srdf symm id Sym1 address 10.12.61.42 protocol srdf symm id Sym1 address 10.12.61.43 RiOS maps SRDF traffic originating from IP addresses that have not been mapped to a Symmetrix ID to the default Symmetrix ID, represented by DefaultSymm for this field. Select an RDF group number from the drop-down list to view data reduction information for individual RDF groups. You can use data reduction information to fine-tune the optimization settings for those RDF groups. The SteelHead automatically identifies and summarizes information by RDF group based on the SRDF traffic seen by the SteelHead. Peak lines appear after one hour for RDF group detail reports. |
Traffic Type | Select either LAN or WAN to display the amount of data transmitted over the LAN/WAN during the selected time period. |
Data series | Description |
Peak LAN/WAN Throughput | Displays the peak LAN/WAN data activity. The system stores peak statistics as bytes transferred over the LAN, but calculates the normal throughput using a granularity of 10 seconds. |
Average LAN/WAN Throughput | Displays the average LAN/WAN data activity. The system stores non-peak statistics as the number of bytes transferred over the LAN/WAN, and calculates the throughput by converting bytes to bits and then dividing the result by the granularity. For instance, if the system reports 100 bytes for a data point with a 10-second granularity, RiOS calculates: 100 bytes * 8 bits/byte / 10 seconds = 80 bps This calculation means that 80 bps was the average throughput over that 10-second period. The total throughput shows the data amount transferred during the displayed time interval. |
Data Reduction | Specifies the percentage of total decrease in overall data transmitted (when viewing all SnapMirror filers). The system calculates data reduction as (total LAN data - total WAN data) / total LAN data. You can use data reduction information to fine-tune the optimization settings for a filer, a filer and a volume, or a filer, volume, and qtree. |
Control | Description |
Time interval | Select a report time interval of 5 minutes (5m), 1 hour (1h), 1 day (1d), 1 week (1w), All, or type a custom date. All includes statistics for the last 30 days. Time intervals that don’t apply to a particular report are dimmed. For a custom time interval, enter the start time and end time using the format yyyy/mm/dd hh:mm:ss You can view the newest data and see data points as they’re added to the chart dynamically. To display the newest data, click Show newest data. |
Filer (Volume) | Select a filer, a filer and a volume, or a filer, volume, and qtree to view detailed statistics on that filer, along with volume and qtree information when applicable. Select all to view statistics on all filers. The Edge automatically identifies and summarizes information by filer, volume, and qtrees based on the SnapMirror traffic seen by the Edge. Peak lines appear after one hour for filer detail reports. |
Traffic Type | Select either LAN or WAN to display the amount of data transmitted over the LAN/WAN during the selected time period. |
Data series | Description |
Requested Connection Rate | Displays the rate of requested SSL connections. |
Established Connection Rate | Displays the rate established SSL connections. |
Control | Description |
Time interval | Select a report time interval of 5 minutes (5m), 1 hour (1h), 1 day (1d), 1 week (1w), All, or type a custom date. All includes statistics for the last 30 days. Time intervals that don’t apply to a particular report are dimmed. For a custom time interval, enter the start time and end time using the format yyyy/mm/dd hh:mm:ss You can view the newest data and see data points as they’re added to the chart dynamically. To display the newest data, click Show newest data. |
Data series | Description |
Request Rate | Select to display the total number of FPSE and WebDAV requests per second. |
FPSE Metadata Cache Hits | Select to display the Microsoft Front Page Server Extensions (FPSE) metadata cache hits per second. Shows how many FPSE requests were served locally, resulting in performance improvements. SSL connections and files smaller than 5 MB can experience significant performance improvements. Microsoft Office 2007/2010/2013 clients use FPSE when communicating with SharePoint 2007/2010 servers. |
WebDAV Metadata Cache Hits | Select to display the Microsoft Web Distributed Authoring and Versioning (WebDAV) metadata cache hits per second. RiOS predicts and prefetches WebDAV responses, which saves multiple round-trips and makes browsing the SharePoint file repository more responsive. |
Control | Description |
Time interval | Select a report time interval of 5 minutes (5m), 1 hour (1h), 1 day (1d), 1 week (1w), All, or type a custom date. All includes statistics for the last 30 days. Time intervals that don’t apply to a particular report are dimmed. For a custom time interval, enter the start time and end time using the format yyyy/mm/dd hh:mm:ss You can view the newest data and see data points as they’re added to the chart dynamically. To display the newest data, click Show newest data. |
Data | Description |
Synchronization Connection | Indicates the status of the connection between the synchronized appliances. |
Synchronization Catch-Up | Indicates the status of transferring data between the synchronized appliances. Catch-Up is used for synchronizing data that was not synchronized during the Keep-Up phase. |
Synchronization Keep-Up | Indicates the status of transferring new incoming data between the synchronized appliances. |
Data Store Percentage Used (Since Last Clear) | Displays the percentage of the RiOS data store that is used. |
Control | Description |
Refresh | Select a refresh rate from the drop-down list: •To refresh the report every 10 seconds, select 10 seconds. •To refresh the report every 30 seconds, select 30 seconds. •To refresh the report every 60 seconds, select 60 seconds. •To disable refresh, click Off. |
Go | Displays the report. |
Data series | Description |
Compression-Only Due To Disk/CPU Pressure | Displays the adaptive compression occurring due to disk/CPU pressure. |
Compression-Only Due To In-Path Rule | Displays the adaptive compression occurring due to the in-path rule. |
In-Memory SDR Due To Disk/CPU Pressure | Displays the in-memory SDR due to disk/CPU pressure. |
In-Memory SDR Due To In-Path Rule | Displays the maximum in-memory SDR due to the in-path rule. |
Control | Description |
Time interval | Select a report time interval of 5 minutes (5m), 1 hour (1h), 1 day (1d), 1 week (1w), All, or type a custom date. All includes statistics for the last 30 days. Time intervals that don’t apply to a particular report are dimmed. For a custom time interval, enter the start time and end time using the format yyyy/mm/dd hh:mm:ss You can view the newest data and see data points as they’re added to the chart dynamically. To display the newest data, click Show newest data. |
Control | Description |
Time Interval | Select a report time interval of 5 minutes (5m), 1 hour (1h), 1 day (1d), 1 week (1w), All, or type a custom date. All includes statistics for the last 30 days. Time intervals that don’t apply to a particular report are dimmed. For a custom time interval, enter the start time and end time using the format yyyy/mm/dd hh:mm:ss You can quickly see the newest data and see data points as they’re added to the chart dynamically. To display the newest data, click Show newest data. |
Data series | Description |
Miss Rate | Displays the rate of cache misses. |
Hit Rate | Displays the rate of cache hits. |
Control | Description |
Time interval | Select a report time interval of 5 minutes (5m), 1 hour (1h), 1 day (1d), 1 week (1w), All, or type a custom date. All includes statistics for the last 30 days. Time intervals that don’t apply to a particular report are dimmed. For a custom time interval, enter the start time and end time using the format yyyy/mm/dd hh:mm:ss. You can quickly see the newest data and see data points as they’re added to the chart dynamically. To display the newest data, click Show newest data. |
Data series | Description |
Cache Entries | Displays the number of DNS entries in the cache. |
Memory Use | Displays the cache memory used, in bytes. |
Control | Description |
Time Interval | Select a report time interval of 5 minutes (5m), 1 hour (1h), 1 day (1d), 1 week (1w), All, or type a custom date. All includes statistics for the last 30 days. Time intervals that don’t apply to a particular report are dimmed. For a custom time interval, enter the start time and end time using the format yyyy/mm/dd hh:mm:ss You can quickly see the newest data and see data points as they’re added to the chart dynamically. To display the newest data, click Show newest data. |
Data series | Description |
Read Throughput | Displays the total data read latency from the Core-side NFS export(s). |
Write Throughput | Displays the total data write latency to the Core-side NFS export(s). |
Control | Description |
Time Interval | Select a report time interval of 5 minutes (5m), 1 hour (1h), 1 day (1d), 1 week (1w), All, or type a custom date. All includes statistics for the last 30 days. Time intervals that do not apply to a particular report are dimmed and unavailable. For a custom time interval, enter the start time and end time using the format yyyy/mm/dd hh:mm:ss. Because the system aggregates data on the hour, request hourly time intervals. For example, setting a time interval to 08:30:00 to 09:30:00 from two days ago does not create a data display, whereas setting a time interval to 08:00:00 to 09:00:00 from two days ago will display data. When you request a custom time interval to view data beyond the aggregated granularity, the data is not visible because the system is no longer storing the data. For example, the following custom time intervals do not return data because the system automatically aggregates data older than seven days into two-hour data points: •Setting a one-hour time period that occurred two weeks ago. •Setting a 75-minute time period that occurred more than one week ago. You can quickly see the newest data and see data points as they are added to the chart dynamically. To display the newest data, click Show newest data. |
Export | Select the export whose statistics you want to see from the drop-down list or select All to view all exports. |
Report | Select I/O, I/O Operations Per Second, or I/O latency from the drop-down list. |
Control | Description |
Time Interval | Select a report time interval of 5 minutes (5m), 1 hour (1h), 1 day (1d), 1 week (1w), All, or type a custom date. All includes statistics for the last 30 days. Time intervals that do not apply to a particular report are dimmed and unavailable. For a custom time interval, enter the start time and end time using the format yyyy/mm/dd hh:mm:ss. Because the system aggregates data on the hour, request hourly time intervals. For example, setting a time interval to 08:30:00 to 09:30:00 from two days ago does not create a data display, whereas setting a time interval to 08:00:00 to 09:00:00 from two days ago will display data. When you request a custom time interval to view data beyond the aggregated granularity, the data is not visible because the system is no longer storing the data. For example, the following custom time intervals do not return data because the system automatically aggregates data older than seven days into two-hour data points: •Setting a one-hour time period that occurred two weeks ago. •Setting a 75-minute time period that occurred more than one week ago. You can quickly see the newest data and see data points as they are added to the chart dynamically. To display the newest data, click Show newest data. |
Control | Description |
Time Interval | Select a report time interval of 5 minutes (5m), 1 hour (1h), 1 day (1d), 1 week (1w), All, or type a custom date. All includes statistics for the last 30 days. Time intervals that do not apply to a particular report are dimmed and unavailable. For a custom time interval, enter the start time and end time using the format yyyy/mm/dd hh:mm:ss. Because the system aggregates data on the hour, request hourly time intervals. For example, setting a time interval to 08:30:00 to 09:30:00 from two days ago does not create a data display, whereas setting a time interval to 08:00:00 to 09:00:00 from two days ago will display data. When you request a custom time interval to view data beyond the aggregated granularity, the data is not visible because the system is no longer storing the data. For example, the following custom time intervals do not return data because the system automatically aggregates data older than seven days into two-hour data points: •Setting a one-hour time period that occurred 2 weeks ago. •Setting a 75-minute time period that occurred more than one week ago. |
Export | Select the NFS exports whose statistics you want to see from the drop-down list or select All to view all NFS exports. |
Blockstore Report | Select one of these data series from the drop-down list: •Read Hit/Miss - Select to view the total data read hits and average miss rate between the blockstore and the Core-side NFS export(s). If no I/O occurs during a time period, the report does not include the idle time when calculating the hit rate. •Uncommitted Data - Select to view the amount of data committed, data written, and data uncommitted between the local Edge blockstore and the Core-side NFS export(s). Data committed is new data written to Edge and then written through Core to the back-end SAN array. The system commits all writes to Core in the order they were received. Data written is new data written to the Edge blockstore. Uncommitted data is new data written to Edge but not written through Core to the backend storage array. Because each Edge is linked to a dedicated NFS export at the data center, the blockstore is authoritative for both reads and writes, and can tolerate WAN outages without worrying about cache coherency. •Commit Throughput - Select to view the amount of data throughput between the blockstore and the Core-side NFS export(s). •Commit Delay - Select to view the average time delay between a request to commit data to the blockstore and the time the data is actually committed. For example, if the Commit Delay value is 1d 3h, and the Edge at the branch office is down, any data written at the Edge in the last 1d 3h will be lost. |
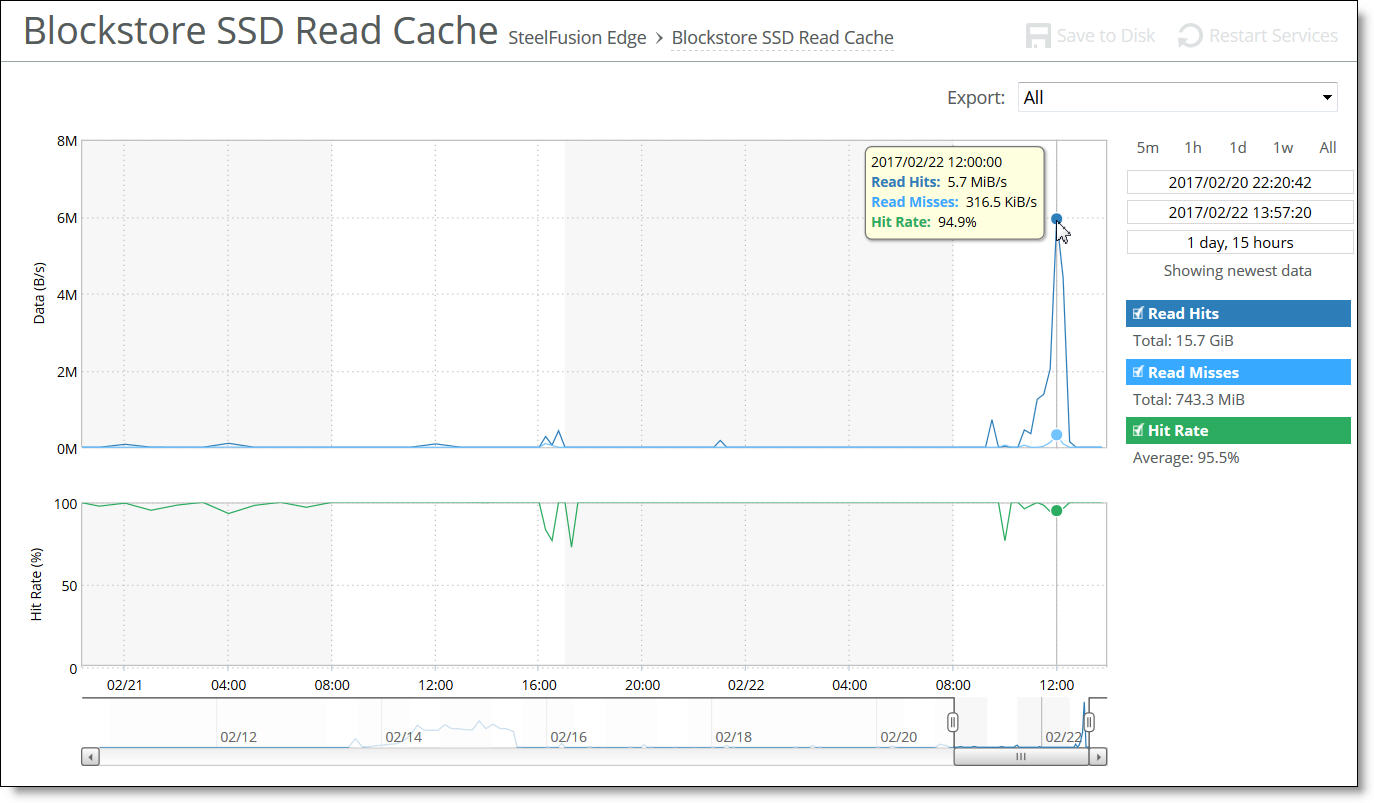
Control | Description |
Time Interval | Select a report time interval of 5 minutes (5m), 1 hour (1h), 1 day (1d), 1 week (1w), All, or type a custom date. All includes statistics for the last 30 days. Time intervals that do not apply to a particular report are dimmed and unavailable. For a custom time interval, enter the start time and end time using the format yyyy/mm/dd hh:mm:ss. Because the system aggregates data on the hour, request hourly time intervals. For example, setting a time interval to 08:30:00 to 09:30:00 from two days ago does not create a data display, whereas setting a time interval to 08:00:00 to 09:00:00 from two days ago will display data. When you request a custom time interval to view data beyond the aggregated granularity, the data is not visible because the system is no longer storing the data. For example, the following custom time intervals do not return data because the system automatically aggregates data older than seven days into two-hour data points: •Setting a one-hour time period that occurred two weeks ago. •Setting a 75-minute time period that occurred more than one week ago. |
Export | Select the NFS export whose statistics you want to see from the drop-down list or select All to view all NFS exports. |
Alarm | Appliance state | Reason |
Application Consistent Snapshot | Degraded | An application-consistent snapshot failed to be committed to the SAN, or a snapshot failed to complete. Application consistent snapshots are scheduled using the Core snapshot scheduler. A snapshot is application consistent if, in addition to being write-order consistent, it includes data from running applications that complete their operations and flush their buffers to disk. This error triggers when there are problems interacting with servers (ESXi or Windows). The first interaction is to prepare for a snapshot (where the server gets filesystems or a VM in a consistent state), and the second is to resume after the snapshot is taken (the server can clean up, stop logging changes, and so on). Errors can also occur due to misconfigurations on either side, local issues on the servers (high load, timeouts, reboots), networking problems, and so on. Check the Core logs for details. Retry the snapshot. |
Blockstore | Degraded or Critical | Indicates that the system has encountered any of the following issues with the blockstore: •Disk space Low - The blockstore is running out of space. Check your WAN connection as well as connectivity to the Core. This can also happen if clients write more data than can be sent over the WAN for a prolonged period of time. •Disk space Full - The blockstore is out of space. Check your WAN connection as well as connectivity to the Core. This can also happen if clients write more data than can be sent over the WAN for a prolonged period of time or when the Core HA time does not match the Edge HA time. It is critical that the Core HA time is synchronized with the Edge HA time. We recommend using NTP time synchronization to synchronize the Core HA and the Edge HA. You must also verify that the time zone is correct. •Memory Low - The blockstore is running out of memory. This indicates a temporary condition caused by too much IO. Limit the number of active prepopulation sessions. Check if IOPS is more than what is recommended for the appliance model. •Read Error - The blockstore could not read data that was already replicated to the data center. Clients will not see any error because the Edge will fetch the data from the Core. Check the system logs to determine the root cause. Replace any disks that have failed. The alarm clears when you restart the service. •Read Cache Error - An appliance with read cache SSDs cannot start the read cache. Replace any failed or missing SSDs, and restart the appliance. If no drives have failed or no drives are missing, check system logs for more detailed information, and contact Riverbed Support for assistance as needed. •Critical Read Error - The blockstore could not read data that is not yet replicated to the Core. Check the system logs to determine the root cause. Replace any disks that have failed. The alarm clears when you restart the service. •Startup Failed - The blockstore failed to start due to disk errors or an incorrect configuration. Check the system logs to determine the root cause. •Startup Wrong Version - The Edge software version is incompatible with the blockstore version on disk. The alarm indicates that the software has been upgraded or downgraded with an incompatible version. Revert to the previous software version. •Standby Wrong Version - The Edge software version running on the standby peer is incompatible with the version on the active peer appliance in a high-availability pair. The active peer has been upgraded or downgraded to an incompatible software version. This alarm typically triggers during the process of upgrading both Edges in a high-availability pair. When upgrading across versions with disk-format changes, this is a normal part of the upgrade process. To clear the alarm, update the software version running on the standby peer to match the software version running on the active peer. |
Write Error - The blockstore could not save data to disk due to a media error. Check the system logs to determine the root cause. Replace any disks that have failed. The alarm clears when you restart the service. | ||
Edge HA Service | Either Degraded or Critical | Indicates that only one of the appliances in a high-availability (HA) Edge pair is actively serving storage data (the active peer). As the system writes new data to the active peer, it is reflected to the standby peer, which stores a copy of the data in its local data store. The two appliances maintain a heartbeat protocol between them, so that if the active peer goes down, the standby peer can take over servicing the NFS exports. If the standby peer goes down, the active peer continues servicing the NFS exports after raising this alarm and sending an email that the appliance is degraded or critical. The email contains the IP address of the peer appliance. Degraded indicates that the edge HA is not functioning but the NFS exports are being serviced. After a failed peer resumes, it resynchronizes with the other peer in the HA pair to receive any data that was written since the time of the failure. After the peer receives all the written data, the normal HA mode resumes and any future writes are reflected to both peers. Critical indicates that the NFS exports are no longer available and are not being serviced. Contact Riverbed Support. |
Storage Volume Status | Critical or Degraded | Indicates that the connection to the volume has failed or there is an issue with any of the following: •Backend connectivity •No read/write permissions •Space threshold has been reached •Resize failure •Export filesystem is corrupted or invalid. •Export metadata is corrupted or invalid. •Edge Virtual IP is not configured. •Export filesystem resize has failed. •Export could not be mounted to the client •Connectivity issues between Edge and Core. If the status is Degraded, the export is available to be written on the Edge however there may be issues with writing the Edge’s data to the backend storage array. If the status is Critical, the export may not be available to be used by the clients at the branch. |
Riverbed Host Tools Version | Degraded | Indicates that the Riverbed host tools package (RHSP) is incompatible with the Windows server version. RHSP provides snapshot capabilities by exposing the Edge through iSCSI to the Windows Server as a snapshot provider. RHSP is compatible with 64-bit editions of Microsoft Windows Server 2008 R2 or later and can be downloaded from the Riverbed Support site at https://support.riverbed.com. |
Snapshot | Degraded | A snapshot failed to be committed to the Core, or a snapshot has failed to complete at the Edge because the blockstore is full, needs credentials, or there is a misconfiguration at the Core. Check the Core logs for details. Retry the Windows snapshot. |
SteelFusion Core | Degraded | Indicates that the system has encountered any of the following issues with the SteelFusion Core: •Unknown Edge - The Edge appliance has connected to a Core that does not recognize the appliance. Most likely the configuration present on the Core is missing an entry for the Edge. Check that the Edge is supplying the proper Edge ID. To find the Edge ID, choose Storage > Storage Edge Configuration on the Edge appliance. The edge identifier appears under SteelFusion Settings. •SteelFusion Core Connectivity - The Edge does not have an active connection with the Core. Check the network between the Edge and the Core; recheck the Edge configuration on the Core. •Inner Channel Down - The data channel between the Core and the Edge is down. The connection between the Core and the Edge has stalled. Check the network between the Edge and the Core. •Keep-Alive Timeout - The connection between the Core and the Edge has stalled. Check the network between the Edge and the Core. |
SteelFusion Edge Service | Needs Attention | Indicates that the Edge appliance connected to the Core is not servicing the Core. Check that Edge appliance is running. |
Uncommitted Edge Data | Degraded | Indicates that a large amount of data in the blockstore needs to be committed to SteelFusion Core. The difference between the contents of the blockstore and the SteelFusion Core-side export is significant. This alarm checks for how much uncommitted data is in the Edge cache as a percentage of the total cache size. This alarm triggers when the appliance writes a large amount of data very quickly, but the WAN pipe is not large enough to get the data back to the Core fast enough to keep the uncommitted data percentage below 5 percent. As long as data is being committed, the cache will flush eventually. The threshold is 5 percent, which for a 4 TiB (1260-4) system is 200 GiB. To change the threshold, use this command: [failover-peer] edge id <id> blockstore uncommitted [trigger-pct <percentage>] [repeat-pct <percentage>] [repeat-interval <minutes>] For example: Core3(config) # edge id Edge2 blockstore uncommitted trigger-pct 50 repeat-pct 25 repeat-interval 5 For details on the command, see the SteelFusion Command-Line Interface Reference Manual. To check that data is being committed, go to Storage > Reports: Blockstore Metrics on the Edge. |
Server Backup | Indicates that one of the following backup failures have occurred: •Failed connection to the server - The connection between the Edge and the ESXi server is down, the server is not running, or there are incorrect credentials for the ESXi or vCenter server login. To fix this issue, check if the server or vCenter is reachable from the Edge and vice-versa. Also ensure that the correct credentials are being used for the ESXi server or vCenter. This alarm is cleared when the connection is restored between the Edge and the ESXi server or vCenter. •Backup failure on the Edge - A backup has failed on the Edge. The alarm displays a message with the affected server. •NFS export is shared among multiple Windows servers - At least one export is shared among two or more Windows servers. To fix this issue, make sure that the export has access to only one host or IP address. The alarm is cleared when servers no longer share export(s) and the next protect operation succeeds. •Server with a backup policy does not have an NFS export - A server with an associated backup policy does not have any VMs or exports to protect. |
Alarm | Appliance state | Reason |
Hypervisor | Degraded or Critical | License - Indicates that the hypervisor license has expired. |
Operation - The hypervisor is in lockdown mode. | ||
Virtual Services Platform | Degraded | Indicates a communication issue between VSP and the hypervisor. |
Connection - The hypervisor is not communicating for any of these issues: •VSP is disconnected from the hypervisor. •The hypervisor password is invalid. •VSP was unable to gather some hardware information. •VSP is disconnected. | ||
Installation - VSP is not installed properly and is powered off for any of these issues: •A hypervisor upgrade has failed. •A configuration push from the Hypervisor Installer has failed. •VSP could not gather enough information to set up an interface. •The hypervisor is not installed. License - The VSP license has expired. |
Alarm | Appliance state | Reason |
Admission Control | Admission Control | •Connection Limit - Indicates that the system connection limit has been reached. Additional connections are passed through unoptimized. The alarm clears when the appliance moves out of this condition. •CPU - Indicates that the appliance has entered admission control due to high CPU use. During this event, the appliance continues to optimize existing connections, but passes through new connections without optimization. The alarm clears automatically when the CPU usage decreases. •MAPI - Indicates that the total number of MAPI optimized connections has exceeded the maximum admission control threshold. By default, the maximum admission control threshold is 85 percent of the total maximum optimized connection count for the client-side appliance. The appliance reserves the remaining 15 percent so the MAPI admission control does not affect the other protocols. The 85 percent threshold is applied only to MAPI connections. The alarm clears automatically when the MAPI traffic decreases; however, it can take one minute for the alarm to clear. The system preemptively closes MAPI sessions to reduce the connection count in an attempt to bring the appliance out of admission control. RiOS closes MAPI sessions in this order: •MAPI prepopulation connections •MAPI sessions with the largest number of connections •MAPI sessions with the most idle connections •Most recently optimized MAPI sessions or the oldest MAPI session •MAPI sessions exceeding the memory threshold •Memory - Indicates that the appliance has entered admission control due to memory consumption. The appliance is optimizing traffic beyond its rated capability and is unable to handle the amount of traffic passing through the WAN link. During this event, the appliance continues to optimize existing connections, but new connections are passed through without optimization. No other action is necessary as the alarm clears automatically when the traffic decreases. •TCP - Indicates that the appliance has entered admission control due to high TCP memory use. During this event, the appliance continues to optimize existing connections, but new connections are passed through without optimization. The alarm clears automatically when the TCP memory pressure decreases. |
Application Consistent Snapshot | Degraded | An application-consistent snapshot failed to be committed to the SAN, or a snapshot failed to complete. Application consistent snapshots are scheduled using the Core snapshot scheduler. A snapshot is application consistent if, in addition to being write-order consistent, it includes data from running applications that complete their operations and flush their buffers to disk. Application-consistent backups are recommended for database operating systems and applications such as SQL, Oracle, and Exchange. This error triggers when there are problems interacting with servers (ESXi or Windows). The first interaction is to prepare for a snapshot (where the server gets filesystems or a VM in a consistent state), and the second is to resume after the snapshot is taken (the server can clean up, stop logging changes, and so on). Errors can also occur due to misconfigurations on either side, local issues on the servers (high load, timeouts, reboots), networking problems, and so on. Check the Core logs for details. Retry the snapshot. |
Asymmetric Routing | Needs Attention | Indicates that the system is experiencing asymmetric traffic. Indicates OK if the system is not experiencing asymmetric traffic. In addition, any asymmetric traffic is passed through, and the route appears in the Asymmetric Routing table. For details about the Asymmetric Routing table, see Configuring asymmetric routing features. |
Blockstore | Degraded or Critical | Indicates that the system has encountered any of the following issues with the blockstore: •Disk space Low - The blockstore is running out of space. Check your WAN connection as well as connectivity to the Core. This can also happen if clients write more data than can be sent over the WAN for a prolonged period of time. •Disk space Critical - The blockstore on the Edge is falling and is critically low. Edge will deactivate NFS exports with high uncommitted data to improve availability on other exports. •Disk space Full - The blockstore is out of space. Check your WAN connection as well as connectivity to the Core. This can also happen if clients write more data than can be sent over the WAN for a prolonged period of time or when the Core HA time does not match the Edge HA time. It is critical that the Core HA time is synchronized with the Edge HA time. We recommend using NTP time synchronization to synchronize the Core HA and the Edge HA. You must also verify that the time zone is correct. •Memory Low - The blockstore is running out of RAM. This indicates a temporary condition caused by too much IO. Limit the number of active prepopulation sessions. Check if IOPS is more than what is recommended for the appliance model. •Read Error - The blockstore could not read data that was already replicated to the data center. Clients will not see any error because the Edge will fetch the data from the Core. Check the system logs to determine the root cause. Replace any disks that have failed. The alarm clears when you restart the service. •Read Cache Error - An appliance with read cache SSDs cannot start the read cache. Replace any failed or missing SSDs, and restart the appliance. If no drives have failed or no drives are missing, check system logs for more detailed information, and contact Riverbed Support for assistance as needed. •Critical Read Error - The blockstore could not read data that is not yet replicated to the Core. This might include data loss. The Edge deactivates all NFS exports. Check the system logs to determine the root cause. Replace any disks that have failed. The alarm clears when you restart the service. •Startup Failed - The blockstore failed to start due to disk errors or an incorrect configuration. Check the system logs to determine the root cause. •Startup Wrong Version - The Edge software version is incompatible with the blockstore version on disk. The alarm indicates that the software has been upgraded or downgraded with an incompatible version. Revert to the previous software version. |
Blockstore | Degraded or Critical | •Standby Wrong Version - The Edge software version running on the standby peer is incompatible with the version on the active peer appliance in a high-availability pair. The active peer has been upgraded or downgraded to an incompatible software version. This alarm typically triggers during the process of upgrading both Edges in a high-availability pair. When upgrading across versions with disk-format changes, this is a normal part of the upgrade process. To clear the alarm, update the software version running on the standby peer to match the software version running on the active peer. •Write Error - The blockstore could not save data to disk due to a media error. The Edge deactivates all NFS exports. Check the system logs to determine the root cause. Replace any disks that have failed. The alarm clears when you restart the service. |
Connection Forwarding | Degraded | Indicates that the system has detected a problem with a connection-forwarding neighbor. The connection-forwarding alarms are inclusive of all connection-forwarding neighbors. For example, if an appliance has three neighbors, the alarm triggers if any one of the neighbors is in error. In the same way, the alarm clears only when all three neighbors are no longer in error. •Cluster Neighbor Incompatible - Indicates that a connection-forwarding neighbor is running a RiOS version that is incompatible with IPv6. Neighbors must be running RiOS 8.5 or later. The appliance neighbors pass through IPv6 connections when this alarm triggers. •Multiple Interface - Indicates that the connection to an appliance in a connection forwarding cluster is lost. •Single Interface - Indicates that the connection to an appliance connection-forwarding neighbor is lost. These issues trigger the single connection-forwarding alarm: •The connection-forwarding neighbor has not sent a keepalive message within the time-out period to the neighbor appliance(s), indicating that the connection has been lost. •The connection cannot be established with a connection-forwarding neighbor. •The connection has been closed by the connection-forwarding neighbor. •The connection has been lost with the connection-forwarding neighbor due to an error. •The connection has been lost because requests have not been acknowledged by a connection-forwarding neighbor within the set threshold. •The appliance has timed out while waiting for an initialization message from a connection-forwarding neighbor. •The amount of latency between connection-forwarding appliances has exceeded the specified threshold. |
CPU Utilization | Degraded | Indicates that the system has reached the CPU threshold for any of the CPUs in the appliance. If the system has reached the CPU threshold, check your settings. For details, see Configuring alarm settings. If your alarm thresholds are correct, reboot the appliance. For details, see Rebooting and shutting down. |
Data Store | Critical | •Corruption - Indicates that the RiOS data store is corrupt or has become incompatible with the current configuration. •Data Store Clean Required - Indicates that you must clear the RiOS data store. To clear the data store, choose Administration > Maintenance: Services and select the Clear Data Store check box before restarting the appliance. Clearing the data store degrades performance until the system repopulates the data. •Encryption Level Mismatch - Indicates a RiOS data store error such as an encryption, header, or format error. •Synchronization Error - Indicates that the RiOS data store synchronization between two appliances has been disrupted and the RiOS data stores are no longer synchronized. For details, see Synchronizing peer RiOS data stores. Resetting the Data Store alarm If a data store alarm was caused by an unintended change to the configuration, you can change the configuration to match the previous RiOS data store settings, and then restart the service without clearing the data store to reset the alarm. Typical configuration changes that require a restart with a clear RiOS data store are enabling the extended peer table or changing the data store encryption type. For details, see Configuring peering and Encrypting the RiOS data store. To clear the RiOS data store of data, choose Administration > Maintenance: Services, select Clear Data Store and click Reboot to reboot the optimization service. For details, see Starting and stopping the optimization service. |
Disk Full | Indicates that the system partitions (not the RiOS data store) are full or almost full. For example, RiOS monitors the available space on /var, which is used to hold logs, statistics, system dumps, TCP dumps, and so on. Examine the directory to see if it is storing an excessive amount of snapshots, system dumps, or TCP dumps that you could delete. You could also delete any RiOS images that you no longer use. | |
Domain Authentication Alert | Needs Attention | Indicates that the system is unable to communicate with the Core, has detected an SMB signing error, or delegation has failed. CIFS-signed and Encrypted-MAPI traffic is passed through without optimization. For details, see Configuring CIFS optimization. |
Domain Join Error | Degraded | Indicates an attempt to join a Windows domain has failed. For details, see Troubleshooting a domain join failure. |
Edge HA Service | Either Degraded or Critical | Indicates that only one of the appliances in a high-availability (HA) Edge pair is actively serving storage data (the active peer). As the system writes new data to the active peer, it is reflected to the standby peer, which stores a copy of the data in its local data store. The two appliances maintain a heartbeat protocol between them, so that if the active peer goes down, the standby peer can take over servicing the NFS exports. If the standby peer goes down, the active peer continues servicing the NFS exports after raising this alarm and sending an email that the appliance is degraded or critical. The email contains the IP address of the peer appliance. Degraded indicates that the edge HA is not functioning but the NFS exports are being serviced. After a failed peer resumes, it resynchronizes with the other peer in the HA pair to receive any data that was written since the time of the failure. After the peer receives all the written data, the normal HA mode resumes and any future writes are reflected to both peers. Critical indicates that the NFS exports are no longer available and are not being serviced. Contact Riverbed Support. |
Hardware | Either Degraded or Critical | These alarms report issues with the SteelFusion Edge RiOS node hardware. •A VSP upgrade requires additional memory or a memory replacement. •Disk Error - Indicates that one or more disks is offline. To see which disk is offline, enter this command from the system prompt: show raid diagram This alarm applies only to the SteelHead RAID Series 3000, 5000, and 6000. •Fan Error - Indicates that a fan is failing or has failed and must be replaced. •Flash Error - Indicates an error with the flash drive hardware. At times, the USB flash drive that holds the system images might become unresponsive; the appliance continues to function normally. When this error triggers you cannot perform a software upgrade, as the appliance is unable to write a new upgrade image to the flash drive without first power cycling the system. To reboot the appliance, go to the Administration > Maintenance: Reboot/Shutdown page or enter the reload command to automatically power cycle the appliance and restore the flash drive to its proper function. •IPMI - Indicates an Intelligent Platform Management Interface (IPMI) event. This alarm triggers when there has been a physical security intrusion. These events trigger this alarm: •Chassis intrusion (physical opening and closing of the appliance case) •Memory errors (correctable or uncorrectable ECC memory errors) •Hard drive faults or predictive failures •Power supply status or predictive failure By default, this alarm is enabled. •Management Disk Size Error - Indicates that the size of the management disk is too small for the virtual appliance model. This condition can occur when upgrading a virtual appliance to a model VCX 5055 or VCX 7055 without first expanding the management disk to a size that supports the higher end models. To clear the alarm, increase the size of the management disk. •Memory Error - Indicates a memory error (for example, when a system memory stick fails). •Other Hardware Error - Indicates one of the following issues: •The appliance does not have enough disk, memory, CPU cores, or NIC cards to support the current configuration. •The appliance is using a memory Dual In-line Memory Module (DIMM), a hard disk, or a NIC that is not qualified by Riverbed. |
•DIMMs are plugged into the appliance but RiOS cannot recognize them because: –a DIMM is in the wrong slot. You must plug DIMMs into the black slots first and then use the blue slots when all of the black slots are in use. —or— –a DIMM is broken and you must replace it. •other hardware issues exist. •Safety Valve: disk access exceeds response times - Indicates that the appliance is experiencing increased disk access time and has started the safety valve disk bypass mechanism that switches connections into SDR-A. SDR-A performs data reduction in memory until the disk access latency falls below the safety valve activation threshold. Disk access time can exceed the safety valve activation threshold for several reasons: the appliance might be undersized for the amount of traffic it is required to optimize, a larger than usual amount of traffic is being optimized temporarily, or a disk is experiencing hardware issues such as sector errors, failing mechanicals, or RAID disk rebuilding. You configure the safety valve activation threshold and timeout using commands: datastore safety-valve threshold datastore safety-value timeout For details, see the Riverbed Command-Line Interface Reference Manual. To clear the alarm, restart the SteelHead. •Power Supply - Indicates an inserted power supply cord does not have power, as opposed to a power supply slot with no power supply cord inserted. •RAID - Indicates an error with the RAID array (for example, missing drives, pulled drives, drive failures, and drive rebuilds). An audible alarm might also sound. To see if a disk has failed, enter this command from the system prompt: show raid diagram For drive rebuilds, if a drive is removed and then reinserted, the alarm continues to be triggered until the rebuild is complete. Rebuilding a disk drive can take 4 to 6 hours. This alarm applies only to the SteelHead RAID Series 3000, 5000, and 6000. | ||
Hypervisor Hardware | Either Degraded or Critical | Indicates that a problem has occurred with the Edge Hypervisor node hardware. The hypervisor hardware affects virtualization on the appliance. These issues trigger the hypervisor hardware alarm: •Hardware Management Connection - Indicates that RiOS has lost IP connectivity or cannot authenticate the connection to the hypervisor motherboard controller. •Hardware Management Controller Unauthenticated User - Indicates that RiOS does not recognize the password used to access the hardware management controller. •Memory - Indicates that a memory error has occurred; for example, a system memory stick has failed. •Other Hardware - Indicates that a hardware error has been detected. These issues trigger the hardware error alarm: •The hypervisor hardware is using a memory Dual In-line Memory Module (DIMM), a hard disk, or a NIC that is not qualified. •The hypervisor hardware has detected a RiOS NIC. The hypervisor does not support RiOS NICs. •DIMMs are plugged into the hypervisor hardware but the hypervisor cannot recognize them because: –a DIMM is in the wrong slot. You must plug DIMMs into the black slots first and then use the blue slots when all of the black slots are in use. —or— –a DIMM is broken and you must replace it. •Power - Indicates that the hypervisor has lost power unexpectedly. •Temperature - Indicates that a hypervisor CPU, board, or platform controller hub (PCH) temperature has exceeded the rising threshold. When the CPU, board, or PCH returns to the reset threshold, the critical alarm clears (after polling for 30 seconds). If the appliance has more than one CPU, the alarm displays both CPUs. The default temperature thresholds are set by the motherboard. |
Inbound QoS WAN Bandwidth Configuration | Degraded (Needs Attention) | Indicates that the inbound QoS WAN bandwidth for one or more of the interfaces is set incorrectly. You must configure the WAN bandwidth to be less than or equal to the interface bandwidth link rate. This alarm triggers when the system encounters one of these conditions: •An interface is connected and the WAN bandwidth is set higher than its bandwidth link rate: for example, if the bandwidth link rate is 1536 kbps, and the WAN bandwidth is set to 2000 kbps. •A nonzero WAN bandwidth is set and QoS is enabled on an interface that is disconnected; that is, the bandwidth link rate is 0. •A previously disconnected interface is reconnected, and its previously configured WAN bandwidth was set higher than the bandwidth link rate. The Management Console refreshes the alarm message to inform you that the configured WAN bandwidth is set higher than the interface bandwidth link rate. While this alarm appears, the appliance puts existing connections into the default class. The alarm clears when you configure the WAN bandwidth to be less than or equal to the bandwidth link rate or reconnect an interface configured with the correct WAN bandwidth. |
Licensing | Needs Attention, Degraded, or Critical | Indicates whether your licenses are current. •Appliance Unlicensed - This alarm triggers if the appliance has no BASE or MSPEC license installed for its currently configured model. For details about updating licenses, see Managing licenses and model upgrades. •Autolicense Critical Event - This alarm triggers on a SteelHead (virtual edition) appliance when the Riverbed Licensing Portal cannot respond to a license request with valid licenses. The Licensing Portal cannot issue a valid license for one of these reasons: –A newer SteelHead (virtual edition) appliance is already using the token, so you cannot use it on the SteelHead (virtual edition) appliance displaying the critical alarm. Every time the SteelHead (virtual edition) appliance attempts to refetch a license token, the alarm retriggers. –The token has been redeemed too many times. Every time the SteelHead (virtual edition) appliance attempts to refetch a license token, the alarm retriggers. Discontinue use of the other SteelHead (virtual edition) appliance or contact Riverbed Support. •Autolicense Informational Event - This alarm triggers if the Riverbed Licensing Portal has information regarding the licenses for a SteelHead (virtual edition) appliance. For example, the SteelHead (virtual edition) appliance displays this alarm when the portal returns licenses that are associated with a token that has been used on a different SteelHead (virtual edition) appliance. Make sure that any previous SteelHead (virtual edition) appliances that were licensed with that token are no longer running. The alarm clears automatically the next time the SteelHead (virtual edition) appliance fetches the licenses from the Licensing Portal. •Licenses Expired - This alarm triggers if one or more features has at least one license installed, but all of them are expired. •Licenses Expiring - This alarm triggers if the license for one or more features is going to expire within two weeks. Note: The licenses expiring and licenses expired alarms are triggered per feature. For example, if you install two license keys for a feature, LK1-FOO-xxx (expired) and LK1-FOO-yyy (not expired), the alarms do not trigger, because the feature has one valid license. If the Licenses Expiring alarm triggers, the system status changes to Needs Attention. The Licenses Expired alarm changes the system status to Degraded. Depending on the expiring license, other alarms might trigger simultaneously. For example, if the MSPEC or SH10BASE license expires, the Appliance Unlicensed alarm triggers and changes the health to Critical. |
Link Duplex | Degraded | Indicates that an interface was not configured for half-duplex negotiation but has negotiated half-duplex mode. Half-duplex significantly limits the optimization service results. The alarm displays which interface is triggering the duplex error. Choose Networking > Networking: Base Interfaces and examine the SteelHead link configuration. Next, examine the peer switch user interface to check its link configuration. If the configuration on one side is different from the other, traffic is sent at different rates on each side, causing many collisions. To troubleshoot, change both interfaces to automatic duplex negotiation. If the interfaces do not support automatic duplex, configure both ends for full duplex. You can enable or disable the alarm for a specific interface. To disable an alarm, choose Administration: System Settings > Alarms and select or clear the check box next to the link alarm. |
Link I/O Errors | Degraded | Indicates that the error rate on an interface has exceeded 0.1 percent while either sending or receiving packets. This threshold is based on the observation that even a small link error rate reduces TCP throughput significantly. A properly configured LAN connection experiences few errors. The alarm clears when the error rate drops below 0.05 percent. You can change the default alarm thresholds by entering the alarm link_io_errors err-threshold <threshold-value> command at the system prompt. For details, see the Riverbed Command-Line Interface Reference Manual. To troubleshoot, try a new cable and a different switch port. Another possible cause is electromagnetic noise nearby. You can enable or disable the alarm for a specific interface. For example, you can disable the alarm for a link after deciding to tolerate the errors. To enable or disable an alarm, choose Administration > System Settings: Alarms and select or clear the check box next to the link name. |
Link State | Degraded | Indicates that the system has lost one of its Ethernet links due to an unplugged cable or dead switch port. Check the physical connectivity between the appliance and its neighbor device. Investigate this alarm as soon as possible. Depending on what link is down, the system might no longer be optimizing, and a network outage could occur. You can enable or disable the alarm for a specific interface. To enable or disable the alarm, choose Administration > System Settings: Alarms and select or clear the check box next to the link name. |
Memory Paging | Degraded | Indicates that the system has reached the memory paging threshold. If 100 pages are swapped approximately every two hours the appliance is functioning properly. If thousands of pages are swapped every few minutes, reboot the appliance. For details, see Rebooting and shutting down. If rebooting does not solve the problem, contact Riverbed Support at https://support.riverbed.com. |
Neighbor Incompatibility | Degraded | Indicates that the system has encountered an error in reaching an appliance configured for connection forwarding. For details, see Configuring connection forwarding features. |
Network Bypass | Critical | Indicates that the system is in bypass failover mode. If the appliance is in bypass failover mode, restart the optimization service. If restarting the service does not resolve the problem, reboot the appliance. If rebooting does not resolve the problem, shut down and restart the appliance. For details, see Rebooting and shutting down, and Starting and stopping the optimization service. |
NFS V2/V4 Alarm | Degraded | Indicates that the system has detected either NFSv2 or NFSv4 is in use. The appliance supports only NFSv3 and passes through all other versions. For details, see Configuring NFS optimization. |
Optimization Service | Critical | •Internal Error - The optimization service has encountered a condition that might degrade optimization performance. Go to the Administration > Maintenance: Services page and restart the optimization service. •Unexpected Halt - The optimization service has halted due to a serious software error. See if a system dump was created. If so, retrieve the system dump and contact Riverbed Support immediately. For details, see Viewing logs. •Service Status - The optimization service has encountered an optimization service condition. The message indicates the reason for the condition: –optimization service is not running This message appears after an optimization restart. For more information, review the appliance logs. –in-path optimization is not enabled This message appears if an in-path setting is disabled for an in-path SteelHead. For more information, review the SteelHead logs. –optimization service is initializing This message appears after a reboot. The alarm clears. For more information, review the SteelHead logs. –optimization service is not optimizing This message appears after a system crash. For more information, review the SteelHead logs. –optimization service is disabled by user This message appears after entering the no service enable command or shutting down the optimization service from the Management Console. For more information, review the SteelHead logs. –optimization service is restarted by user This message appears after the optimization service is restarted from either the CLI or Management Console. You might want to review the SteelHead logs for more information. |
Outbound QoS WAN Bandwidth Configuration | Degraded (Needs Attention) | Indicates that the outbound QoS WAN bandwidth for one or more of the interfaces is set incorrectly. You must configure the WAN bandwidth to be less than or equal to the interface bandwidth link rate. This alarm triggers when the system encounters one of these conditions: •An interface is connected and the WAN bandwidth is set higher than its bandwidth link rate: for example, if the bandwidth link rate is 1536 kbps, and the WAN bandwidth is set to 2000 kbps. •A nonzero WAN bandwidth is set and QoS is enabled on an interface that is disconnected; that is, the bandwidth link rate is 0. •A previously disconnected interface is reconnected, and its previously configured WAN bandwidth was set higher than the bandwidth link rate. The Management Console refreshes the alarm message to inform you that the configured WAN bandwidth is set higher than the interface bandwidth link rate. While this alarm appears, the SteelHead puts existing connections into the default class. The alarm clears when you configure the WAN bandwidth to be less than or equal to the bandwidth link rate or reconnect an interface configured with the correct WAN bandwidth. |
Path Selection Path Down | Degraded | Indicates that one of the predefined paths for a connection is unavailable because it has exceeded either the timeout value for path latency or the threshold for observed packet loss. When a path fails, the SteelHead directs traffic through another available path. When the original path comes back up, the SteelHead redirects the traffic back to it. |
Path Selection Path Probing Error | Degraded | Indicates that a path selection monitoring probe for a predefined path has received a probe response from an unexpected relay or interface. |
Process Dump Creation Error | Degraded | Indicates that the system has detected an error while trying to create a process dump. This alarm indicates an abnormal condition in which RiOS cannot collect the core file after three retries. It can be caused when the /var directory, which is used to hold system dumps, is reaching capacity or other conditions. When this alarm is raised, the directory is blacklisted. Contact Riverbed Support to correct the issue. |
Riverbed Host Tools Version | Degraded | Indicates that the Riverbed host tools package (RHSP) is incompatible with the Windows server version. RHSP provides snapshot capabilities by exposing the Edge through iSCSI to the Windows Server as a snapshot provider. RHSP is compatible with 64-bit editions of Microsoft Windows Server 2008 R2 or later and can be downloaded from the Riverbed Support site at https://support.riverbed.com. |
Secure Transport | Critical | Indicates that a peer appliance has encountered a problem with the controller connection. The controller is an appliance that typically resides in the data center and manages the control channel and operations required for secure transport between peers. The control channel between the peers uses SSL to secure the connection. •Connection with Controller Lost - Indicates that the peer appliance is no longer connected to the controller for one of these reasons: •The connectivity between the peer appliance and the SteelHead controller is lost. •The SSL for the connection is not configured correctly. •Registration with Controller Unsuccessful - Indicates that the peer appliance is not registered with the SteelHead controller, and the controller does not recognize it as a member of the secure transport group. |
Secure Vault | Degraded | Indicates a problem with the secure vault. •Secure Vault Locked - Needs Attention - Indicates that the secure vault is locked. To optimize SSL connections or to use RiOS data store encryption, the secure vault must be unlocked. Go to Administration > Security: Secure Vault and unlock the secure vault. •Secure Vault New Password Recommended - Degraded - Indicates that the secure vault requires a new, nondefault password. Reenter the password. •Secure Vault Not Initialized - Critical - Indicates that an error has occurred while initializing the secure vault. When the vault is locked, SSL traffic is not optimized and you cannot encrypt the RiOS data store. For details, see Unlocking the secure vault. |
Server Backup | Degraded | Indicates that one of the following backup failures have occurred: •Failed connection to the server - The connection between the Edge and the ESXi server is down, the server is not running, or there are incorrect credentials for the ESXi or vCenter server login. To fix this issue, check if the server is reachable from the Edge and vice-versa. Also ensure that the correct credentials are being used for the ESXi server. This alarm is cleared when the connection is restored between the Edge and the server. •Backup failure on the Edge - A backup has failed on the Edge. The alarm displays a message with the affected server. •NFS export is shared among multiple Windows servers - At least one export is shared among two or more Windows servers. To fix this issue, make sure that the export has access to only one IP address. The alarm is cleared when servers no longer share export(s) and the next protect operation succeeds. •Server with a backup policy does not have an NFS export - A server with an associated backup policy does not have any VMs or exports to protect. |
Snapshot | Degraded | A snapshot failed to be committed to the Core, or a snapshot has failed to complete at the Edge because the blockstore is full, needs credentials, or there is a misconfiguration at the Core. Check the Core logs for details. Retry the Windows snapshot. |
Software Compatibility | Needs Attention or Degraded | Indicates that there is a mismatch between software versions in the Riverbed system. •Peer Mismatch - Needs Attention - Indicates that the appliance has encountered another appliance that is running an incompatible version of system software. Refer to the CLI, Management Console, or the SNMP peer table to determine which appliance is causing the conflict. Connections with that peer will not be optimized, connections with other peers running compatible RiOS versions are unaffected. To resolve the problem, upgrade your system software. No other action is required as the alarm clears automatically. •Software Version Mismatch - Degraded - Indicates that the appliance is running an incompatible version of system software. To resolve the problem, upgrade your system software. No other action is required as the alarm clears automatically. By default, this alarm is enabled. |
SSL | Needs Attention | Indicates that an error has been detected in your secure vault or SSL configuration. For details about checking your settings, see Verifying SSL and secure inner channel optimization. •Non-443 SSL Servers - Indicates that during a RiOS upgrade (for example, from 8.5 to 9.0), the system has detected a preexisting SSL server certificate configuration on a port other than the default SSL port 443. SSL traffic might not be optimized. To restore SSL optimization, you can add an in-path rule to the client-side appliance to intercept the connection and optimize the SSL traffic on the nondefault SSL server port. After adding an in-path rule, you must clear this alarm manually by entering this command: stats alarm non_443_ssl_servers_detected_on_upgrade clear •SSL Certificates Error - Indicates that an SSL peering certificate has failed to re-enroll automatically within the Simple Certificate Enrollment Protocol (SCEP) polling interval. •SSL Certificates Expiring - Indicates that an SSL certificate is about to expire. •SSL Certificates SCEP - Indicates that an SSL certificate has failed to reenroll automatically within the SCEP polling interval. |
SteelFusion Core | Degraded | Indicates that the system has encountered any of the following issues with the SteelFusion Core: •Unknown Edge - The Edge appliance has connected to a Core that does not recognize the appliance. Most likely the configuration present on the Core is missing an entry for the Edge. Check that the Edge is supplying the proper Edge ID. To find the Edge ID, choose Storage > Storage Edge Configuration on the Edge appliance. The edge identifier appears under SteelFusion Settings. •SteelFusion Core Connectivity - The Edge does not have an active connection with the Core. Check the network between the Edge and the Core; recheck the Edge configuration on the Core. •Inner Channel Down - The data channel between the Core and the Edge is down. The connection between the Core and the Edge has stalled. Check the network between the Edge and the Core. •Keep-Alive Timeout - The connection between the Core and the Edge has stalled. Check the network between the Edge and the Core. |
SteelFusion Edge Service | Needs Attention | Indicates that the Edge appliance connected to the Core is not servicing the Core. Check that the Edge appliance is running. |
SteelFusion Protocol Service | Indicates that an NFS protocol error is preventing a volume from being mounted from the Edge to the clients (for example, ESXi). | |
Storage Profile Switch Failed | Either Critical or Needs Attention, depending on the state | Indicates that an error has occurred while repartitioning the disk drives during a storage profile switch. The repartitioning was unsuccessful. A profile switch changes the disk space allocation on the drives to allow VSP to use varying amounts of storage. It also clears the SteelFusion and VSP data stores, and repartitions the data stores to the appropriate sizes. You switch a storage profile by entering the disk-config layout CLI command at the system prompt or by choosing Administration > System Settings: Disk Management and selecting a storage profile. A storage profile switch requires a reboot of the Edge. The alarm appears after the reboot. These reasons can cause a profile switch to fail: •RiOS can’t validate the profile. •The profile contains an invalid upgrade or downgrade. •RiOS can’t clean up the existing VDMKs. During cleanup, RiOS uninstalls all slots and deletes all backups and packages. When you encounter this error, reboot the Edge and then switch the storage profile again. If the switch succeeds, the error clears. If it fails, RiOS reverts the Edge to the previous storage profile. •If RiOS successfully reverts the Edge to the previous storage profile, the alarm status displays needs attention. •If RiOS is unable to revert the Edge to the previous storage profile, the alarm status becomes critical. For assistance, contact Riverbed Support. |
Storage Volume Status | Critical or Degraded | Indicates that the connection to the volume has failed or there is an issue with any of the following: •Backend connectivity •No read/write permissions •Space threshold has been reached •Resize failure •Export filesystem is corrupted or invalid. •Export metadata is corrupted or invalid. •Edge Virtual IP is not configured. •Export filesystem resize has failed. •Export could not be mounted to the client •Connectivity issues between Edge and Core. If the status is Degraded, the export is available to be written on the Edge however there may be issues with writing the Edge’s data to the backend storage array. If the status is Critical, the export may not be available to be used by the clients at the branch. By default, this alarm is enabled. |
System Detail Report | Degraded | Indicates that the system has detected a problem with an optimization or system module. For details, see Viewing system detail reports. |
Temperature | Critical or Warning | •Critical - Indicates that the CPU temperature has exceeded the critical threshold. The default value for the rising threshold temperature is 80ºC; the default reset threshold temperature is 67ºC. •Warning - Indicates that the CPU temperature is about to exceed the critical threshold. |
Uncommitted Edge Data | Degraded | Indicates that a large amount of data in the blockstore needs to be committed to SteelFusion Core. The difference between the contents of the blockstore and the SteelFusion Core-side export is significant. This alarm checks for how much uncommitted data is in the Edge cache as a percentage of the total cache size. This alarm triggers when the appliance writes a large amount of data very quickly, but the WAN pipe is not large enough to get the data back to the SteelFusion Core fast enough to keep the uncommitted data percentage below 5 percent. As long as data is being committed, the cache will flush eventually. The threshold is 5 percent, which for a 4 TiB (1260-4) system is 200 GiB. To change the threshold, use this command: [failover-peer] edge id <id> blockstore uncommitted [trigger-pct <percentage>] [repeat-pct <percentage>] [repeat-interval <minutes>] For example: Core3(config) # edge id Edge2 blockstore uncommitted trigger-pct 50 repeat-pct 25 repeat-interval 5 For details on the CLI command, see the SteelFusion Command-Line Interface Reference Manual. To check that data is being committed, go to Storage > Reports: Blockstore Metrics on the Edge. |
Virtualization | Degraded or Critical | Hypervisor - Indicates a problem with the hypervisor. License - Indicates that the hypervisor license has expired. |
Operation - The hypervisor is in lockdown mode. | ||
Degraded | Virtual Services Platform - Indicates a communication issue between VSP and the hypervisor. | |
Connection - The hypervisor is not communicating for any of these issues: •VSP is disconnected from the hypervisor. •The hypervisor password is invalid. •VSP was unable to gather some hardware information. •VSP is disconnected. | ||
Installation - VSP is not installed properly and is powered off for any of these issues: •A hypervisor upgrade has failed. •A configuration push from the Hypervisor Installer has failed. •VSP could not gather enough information to set up an interface. •The hypervisor is not installed. | ||
Web Proxy | Configuration - Indicates that an error has occurred with the web proxy configuration. Service Status - Indicates that an error has occurred with the web proxy service. |
Control | Description |
Time Interval | Select a report time interval of 5 minutes (5m), 1 hour (1h), 1 day (1d), 1 week (1w), All, or type a custom date. All includes statistics for the last 30 days. Time intervals that don’t apply to a particular report are dimmed. For a custom time interval, enter the start time and end time using the format yyyy/mm/dd hh:mm:ss You can quickly see the newest data and see data points as they’re added to the chart dynamically. To display the newest data, click Show newest data. |
Display Mode | Select one of these displays from the drop-down list: •Brief - Displays the CPU utilization percentage of all CPU cores combined as a systemwide average. •Detailed - Displays the CPU percentages for each RiOS core individually. The individual cores appear with a number and a color in the data series. To hide or display a core in the plot area, select or clear the check box next to the core name. |
Data series | Description |
Page Swap Out Rate | Specifies the total number of pages swapped per second. If 100 pages are swapped approximately every two hours, the appliance is functioning properly. If thousands of pages are swapped every few minutes, contact Riverbed Support at https://support.riverbed.com. |
Control | Description |
Time Interval | Select a report time interval of 5 minutes (5m), 1 hour (1h), 1 day (1d), 1 week (1w), All, or type a custom date. All includes statistics for the last 30 days. Time intervals that don’t apply to a particular report are dimmed. For a custom time interval, enter the start time and end time using the format yyyy/mm/dd hh:mm:ss You can quickly see the newest data and see data points as they’re added to the chart dynamically. To display the newest data, click Show newest data. |
Data series | Description |
Max Threshold | Displays the maximum amount of memory bytes that the TCP stack can allocate for its needs. |
Cutoff Threshold | Displays the number of memory bytes allocated until the TCP memory allocation subsystem does not apply memory-saving mechanisms and rules. As soon as the TCP memory consumption reaches the cutoff limit, the TCP stack enters a “memory pressure” state. This state applies several important limitations that restrict memory use by incoming and transmitted packets. In practice, this means that part of the incoming packets can be discarded, and user space code is limited in its abilities to send data. |
Enable Threshold | Displays the lower boundary of TCP memory consumption, when the memory pressure state is cleared and the TCP stack can use the regular memory allocation approach again. |
Memory Usage | Displays the average memory consumption by the TCP/IP stack. |
Memory Pressure | Displays the maximum percentage of time that the kernel has spent under TCP memory pressure. |
Control | Description |
Time Interval | Select a report time interval of 5 minutes (5m), 1 hour (1h), 1 day (1d), 1 week (1w), All, or type a custom date. All includes statistics for the last 30 days. Time intervals that don’t apply to a particular report are dimmed. For a custom time interval, enter the start time and end time using the format yyyy/mm/dd hh:mm:ss You can quickly see the newest data and see data points as they’re added to the chart dynamically. To display the newest data, click Show newest data. |
Column | Description |
Module | Displays the SteelFusion Edge module. Select a module name to view details. A right arrow to the left of a module indicates that the report includes detailed information about a submodule. Click the arrow to view submodule details. This report examines these modules: •CPU - Displays information about idle time, system time, and user time per CPU. •Memory - Displays information about the total, used, and free memory by percentage and in kilobytes. •CIFS - Click the right arrow and the submodule name to view details for unexpected shutdowns and round-trip statistics. •HTTP - Click the right arrow and the submodule name to view details for the URL Learning, Parse and Prefetch, and Object Prefetch Table optimization schemes. •Intercept - Click the right arrow to view statistics for message queue, GRE, and WCCP. Also includes table length and watchdog status. •Lotus Notes - Displays whether Lotus Notes optimization is enabled. •MAPI - Click the right arrow and the submodule name to view details for: Accelerators - Displays how many accelerator objects have been created for read-ahead, write-behind, and cached-mode folder synchronization. One accelerator object corresponds to the optimization of one particular Outlook action. •Read-ahead is for downloading an email attachment (in noncached Outlook mode or for public folders). •Write-behind is for uploading an email attachment. •Cache-sync is for downloading the new contents of a folder (in cached mode). Requests and responses - Displays the number of MAPI round trips used and saved. Includes the number of responses and faults along with the fault reason: for example, access denied. MAPI decryption and encryption (RPCCR) - Displays whether MAPI decryption and encryption is enabled. Includes the number of client-side and server-side appliance encrypted MAPI sessions, along with details about how many sessions were not encrypted, how many sessions were successfully decrypted and encrypted, how many sessions were passed through, and how many sessions experienced an authentication failure. Connection sessions - Displays the number of client-side and server-side appliance MAPI sessions, counting the number of MAPI 2000, 2003, 2007, and pass-through sessions. |
•Oracle Forms - Click the right arrow and submodule name to view details for native and HTTP mode key. •Secure Peering - Click the right arrow and submodule name to view details for secure inner channels, including information about certificate and private key validity, peer SteelHead trust, and blacklisted servers. •Splice Policy - Displays details about the splice policy in use. •SSL - Displays whether SSL optimization is enabled and details about the SSL configuration, such as which advanced settings are in use. Click the right arrow and the submodule name to view details for the SSL outer and inner channels. | |
Status | Displays one of these results: •OK (Green) •Warning (Yellow) •Error (Red) •Disabled (Gray). Appears when you manually disable the module. |
Column | Description |
Disk | Displays the disk number. |
Status | Displays the disk status: •Degraded - Indicates a failure of one or more of the RAID arrays. The disk itself has not failed. •Failed - Indicates the disk has failed. The alarm email notification denotes whether the failure is on a management or data store disk. The optimization service continues to run normally without interruption or dropped connections when a single disk fails, albeit with reduced data store capacity and performance degradation. This message can also indicate that a disk has been inserted into an incorrect slot or that the disk has already been used in another Edge. If all disks fail, the optimization service halts. Consult the system log for more information. Riverbed replaces the failed component at Riverbed’s expense as long as the device is covered by a current support contract. Depending on the level of support contract, a trained engineer could be on site with the replacement part within four hours. If the report displays a failed disk status, go to Riverbed Support: https://support.riverbed.com •Missing - There is no disk in the slot. •Rebuilding - The disk is rebuilding after it has been inserted into the slot. Rebuilding a data store disk takes approximately one hour or less to rebuild; a management disk that is part of a RAID mirror can take longer (4 to 6 hours). The status continues to be rebuilding until the drive is completely rebuilt. •Online - Disk is up and working. |
Task | Displays the system component the disk is used for: either data store or management. If the disk is used for both, the task column does not appear. |
Control | Description |
Gateway Test | Determines if each configured gateway is connected correctly. Run this test to ping each configured gateway address with 4 packets and record the number of failed or successful replies. The test passes if all 4 packets are acknowledged. The default packet size is 64 bytes. •Internet Protocol - Select IPv4 or IPv6 from the drop-down list. •Run - Click to run the test. If the test fails and all packets are lost, ensure the gateway IP address is correct and the SteelHead is on the correct network segment. If the gateway is reachable from another source, check the connections between the SteelHead and the gateway. If the test fails and only some packets are lost, check your duplex settings and other network conditions that might cause dropped packets. |
Cable Swap Test | Ensures that the WAN and LAN cables on the SteelHead are connected to the LAN and WAN of the network. The test enumerates the results by interface (one row entry per pair of bypass interfaces). By default, this test is disabled. Note: Certain network topologies might cause an incorrect result for this test. For the following topologies, we recommend that you confirm the test result manually: •SteelHeads deployed in virtual in-path mode. •Server-side SteelHeads that receive significant amounts of traffic from nonoptimized sites. •SteelHeads that sit in the path between other SteelHeads that are optimizing traffic. If the test fails, ensure a straight-through cable is not in use between an appliance port and a router, or that a crossover cable is not in use between an appliance port and a switch. |
Duplex Test | Determines if the speed and duplex settings match on each side of the selected interface. If one side is different from the other, then traffic is sent at different rates on each side, causing a great deal of collision. This test runs the ping utility for 5 seconds with a packet size of 2500 bytes against the interface. •Interface - Specify an interface to test. •IP Address - Specify an IPv4 or IPv6 address that is on the testing interface side. •Run - Click to run the test. The test passes if the system acknowledges 100 percent of the packets and receives responses from all packets. If any packets are lost, the test fails. If the test fails, ensure the speed and duplex settings of the appliance's Ethernet interface matches that of the switch ports to which it’s connected. The test output records the percentage of any lost packets and number of collisions. Note: For accurate test results, traffic must be running through the SteelHead. |
Peer Reachability Test | Select to send a test probe to a specified peer and await the probe response. If a response is not received, the test fails. To view the current peer appliances, choose Reports > Optimization: Peers. •IP Address - Specify the IPv4 or IPv6 address of the peer appliance to test. •Run - Click to run the test. Notes: •This test might not be accurate when the peer SteelHead is configured out-of-path. •Do not specify the primary or auxiliary IP of the same SteelHead displayed in the Peers report (the primary or auxiliary IP to which the SteelHead is connected). If the test fails, ensure that there are no firewalls, IDS/IPS, VPNs, or other security devices that might be stripping or dropping connection packets between SteelHeads. |
IP Port Reachability Test | Select to determine whether a specified IP address and optional port is correctly connected. If you specify only an IP address, the test sends an ICMP message to the IP address. If you specify a port number, the test telnets to the port. •Interface - Optionally, specify an interface to test. •IP Address - Specify the IP4 or IPv6 address to test. •Port - Optionally, specify a port to test. •Run - Click to run the test. If the test fails, ensure that dynamic or static routing on your network is correctly configured and that the remote network is reachable from hosts on the same local subnet as this appliance. |
Run Selected | Runs the selected tests. |
View or Hide Test Output | Click to view or hide the test results. |
Control | Description |
Test DNS | Checks the DNS settings, which must be correct for Windows domain authentication, SMB signing, SMB2/3 signing, and encrypted MAPI optimization. A test status appears for the most recent test run: Passed, Failed, or Undetermined. •Domain/Realm - Specify the fully qualified Active Directory domain in which the SteelHead is a member. Typically, this is your company domain name. •Test DNS - Click to run the test. The Management Console dims this button until you specify the domain name. |
Test Join | Confirms that the appliance is correctly joined to the Windows domain by verifying that the domain join configuration of the appliance is valid on the backend domain controller in Active Directory. A test status appears for the most recent test run: Passed, Failed, or Undetermined. •Test Join - Click to run the test. |
Test Delegation Setup | Checks whether an account has the necessary Active Directory privileges for delegation or automatic delegation. A test status appears for the most recent test run: Passed, Failed, or Undetermined. •Delegation Domain/Realm - Select the fully qualified domain in which the SteelHead is a member. Typically, this is your company domain name. •Domain Controller - Specify the host that provides user login service in the domain. •Test Delegation Setup - Click to run the test. The Management Console dims this button until you specify all required information. |
Test Delegation Privileges | Confirms delegation privileges for a particular server by verifying that the correct privileges are set to perform constrained delegation. Within SMB signing, SMB2/3 signing, and encrypted MAPI in delegation mode, the appliance and the AD environment must have correct privileges to obtain Kerberos tickets for the CIFS or Exchange server and perform the subsequent authentication. A test status appears for the most recent test run: Passed, Failed, or Undetermined. •Delegation Domain/Realm - Select the domain in which the SteelHead is a member. Typically, this is your company domain name. •Server - Specify a delegate server hostname. •Server IP - Specify the delegate server IP address. •Service - Select either CIFS or Exchange MDB. •Account to Delegate - Specify a domain username. •Test Delegation Privileges - Click to run the test. The Management Console dims this button until you specify all required information. |
Test NTLM Authentication | Tests whether NTLM can successfully authenticate a user to the joined domain. A test status appears for the most recent test run: Passed, Failed, or Undetermined. •Username - Specify an Active Directory domain username. •Password - Specify a password. •Domain/Realm - Specify the fully qualified domain of the Active Directory in which the SteelHead is a member. Typically, this is your company domain name. •Short Domain Name - Specify the short domain (NetBIOS) name if it does not match the first portion of the Active Directory domain name. Case matters; NBTTECH is not the same as nbttech. •Test NTLM Authentication - Click to run the test. The Management Console dims this button until you specify all required information. |
Test Replication Setup | Tests the ability to replicate the server account by attempting to replicate a server account using the replication user for the domain. A test status appears for the most recent test run: Passed, Failed, or Undetermined. •Delegation Domain/Realm - Select the fully qualified domain of the Active Directory in which the replication user is a trusted member. For example, REPLICATION.TEST. •Short Domain Name - Specify the short domain (NetBIOS) name (or replication server) if it does not match the first portion of the Active Directory domain name. Case matters; NBTTECH is not the same as nbttech. •Replication Server - Specify a CIFS or Exchange replication server hostname. •Test Replication Setup - Click to run the test. The Management Console dims this button until you specify all required information. |
Test Replication PRP | Ensures that the server account can be replicated as per the password replication policy (PRP) on the domain controller. This test only works for Windows 2008 and later domains. A test status appears for the most recent test run: Passed, Failed, or Undetermined. •Replication Domain/Realm - Select the fully qualified domain of the Active Directory in which the replication user is a trusted member: for example, REPLICATION.TEST. •Domain Controller - Specify the host that provides user login service in the domain. •Replication Server - Specify a CIFS or Exchange replication server hostname. •Test Replication PRP - Click to run the test. The Management Console dims this button until you specify all required information. |
Control | Description |
Show | Select one of the archived logs or Current Log from the drop-down list. |
Lines per Page | Specify the number of lines you want to display in the page. |
Jump to | Select one of these options from the drop-down list: •Page - Specify the number of pages you want to display. •Time - Specify the time for the log you want to display. |
Filter | Select one of these filtering options from the drop-down list: •Regular expression - Specify a regular expression on which to filter the log. •Error or higher - Displays Error level logs or higher. •Warning or higher - Displays Warning level logs or higher. •Notice or higher - Displays Notice level logs or higher. •Info or higher - Displays Info level logs or higher. |
Go | Displays the report. |
Control | Description |
Show | Select one of the archived logs or Current Log from the drop-down list. |
Lines per page | Specify the number of lines you want to display in the page. |
Jump to | Select one of these options from the drop-down list: •Page - Specify the number of pages you want to display. •Time - Specify the time for the log you want to display. |
Regular Expression Filter | Select one of these filtering options from the drop-down list: •Regular expression - Specify a regular expression on which to filter the log. •Error or higher - Displays Error level logs or higher. •Warning or higher - Displays Warning level logs or higher. •Notice or higher - Displays Notice level logs or higher. •Info or higher - Displays Info level logs or higher. |
Go | Displays the report. |
Control | Description |
Add a New TCP Dump | Displays the controls for creating a TCP trace dump. |
Capture Name | Specify the name of the capture file. The default filename uses this format: <hostname>_<interface>_<timestamp>.cap Where <hostname> is the hostname of the Edge, <interface> is the name of the interface selected for the trace (for example, lan0_1, wan0_1), and <timestamp> is in the yyyy-mm-dd-hh-mm-ss format. If this trace dump relates to an open Riverbed Support case, specify the capture filename case_<number> where <number> is your Riverbed Support case number. For example, case_12345. Note: The .cap file extension is not included with the filename when it appears in the capture queue. |
Endpoints | Specify IP addresses and port numbers to capture packets between them: IPs - Specify IP addresses of endpoints on one side. Separate multiple IP addresses using commas. You can enter IPv6 addresses separated by commas. The default setting is all IP addresses. Ports - Specify ports on one side. Separate multiple ports using commas. The default setting is all ports. —and— IPs - Specify IP addresses of endpoints on the other side. Separate multiple IP addresses using commas. You can enter IPv6 addresses separated by commas. The default setting is all IP addresses. Ports - Specify ports on the other side. Separate multiple ports using commas. The default setting is all ports. To capture traffic flowing in only one direction or to enter a custom command, use the tcpdump command. For details, see the Riverbed Command-Line Interface Reference Manual. |
Capture Interfaces | Captures the TCP trace dump on the selected interface(s). You can select all interfaces or a base, in-path, data, or miscellaneous interface. The default setting is none. You must specify a capture interface. If you select several interfaces at a time, the data is automatically placed into separate capture files. |
Capture Parameters | These parameters let you capture information about dot1q VLAN traffic. You can match traffic based on VLAN-tagged or untagged packets, or both. You can also filter by port number or host IP address and include or exclude ARP packets. Select one of these parameters for capturing VLAN packets: •Capture Untagged Traffic Only - Select this option for the following captures: – All untagged VLAN traffic. – Untagged 7850 traffic and ARP packets. You must also specify or arp in the custom flags field in this page. – Only untagged ARP packets. You must also specify and arp in the custom flags field in this page. •Capture VLAN-Tagged Traffic Only - Select this option for the following captures: – Only VLAN-tagged traffic. – VLAN-tagged packets with host 10.11.0.6 traffic and ARP packets. You must also specify 10.11.0.6 in the IPs field, and specify or arp in the custom flags field in this page. – VLAN-tagged ARP packets only. You must also specify and arp in the custom flags field in this page. •Capture both VLAN and Untagged Traffic - Select this option for the following captures: – All VLAN traffic. – Both tagged and untagged 7850 traffic and ARP packets. You must also specify the following in the custom flags field in this page: (port 7850 or arp) or (vlan and (port 7850 or arp)) – Both tagged and untagged 7850 traffic only. You must also specify 7850 in one of the port fields in this page. No custom flags are required. – Both tagged and untagged ARP packets. You must also specify the following in the custom flags field in this page: (arp) or (vlan and arp) |
Capture Duration (Seconds) | Specify a positive integer to set how long the capture runs, in seconds. The default value is 30. Specify 0 or continuous to initiate a continuous trace. For continuous capture, we recommend specifying a maximum capture size and a nonzero rotate file number to limit the size of the TCP dump. |
Maximum Capture Size (MB) | Specify the maximum capture file size in megabytes. The default value is 100. The recommended maximum capture file size is 1024 MB (1 GB). |
Buffer Size | Optionally, specify the maximum number of packets allowed to queue up while awaiting processing by the TCP trace dump. The default value is 154. |
Snap Length | Optionally, select the snap length value, in bytes, for the capture file or specify a custom value. The snap length equals the number of bytes the report captures for each packet. Having a snap length smaller than the maximum packet size on the network enables you to store more packets, but you might not be able to inspect the full packet content. The default value is 1518. Select 0 for a full packet capture (recommended for CIFS, MAPI, and SSL captures). When using jumbo frames, we recommend selecting 9018. The default custom value is 16383. |
Number of Files to Rotate | Specify how many capture files to keep for each interface before overwriting the oldest file. To stop file rotation, you can specify 0; however, we recommend rotating files, because stopping the rotation can fill the disk partition. This control limits the number of files created to the specified number, and begins overwriting files from the beginning, thus creating a rotating buffer. The default value is 5. The maximum value is a 32-bit integer. |
Custom Flags | Specify custom flags as additional statements within the filter expression. Custom flags are added to the end of the expression created from the Endpoints fields and the Capture Parameters radio buttons (pertaining to VLANs). If you require an “and” statement between the expression created from other fields and the expression that you are entering in the custom flags field, you must include the “and” statement at the start of the custom flags field. Do not use host, src, or dst statements in the custom flags field. Although it is possible in trivial cases to get these to start without a syntax error, they do not capture GRE-encapsulated packets that some modes of SteelHead communications use, such as WCCP deployments or Interceptor connection-setup traffic. We recommend using bidirectional filters by specifying endpoints. For complete control of your filter expression, use the CLI tcpdump command. For details, see the Riverbed Command-Line Interface Reference Manual. For examples, see Custom flag use examples. |
Schedule Dump | Schedules the trace dump to run at a later date and time. |
Start Date | Specify a date to initiate the trace dump in this format: yyyy/mm/dd |
Start Time | Specify a time to initiate the trace dump in this format: hh:mm:ss |
Add | Adds the TCP trace dump to the capture queue. |
Filter Purpose | Custom Flag |
To capture all traffic on VLAN 10 between two specified endpoints: 1.1.1.1 and 2.2.2.2 | and vlan 10 |
To capture any packet with a SYN or an ACK | tcp[tcpflags] & (tcp-syn|tcp-ack) != 0 |
To capture any packet with a SYN | tcp[tcpflags] & (tcp-syn) != 0 —or— tcp[13] & 2 == 2 |
To capture any SYN to or from host 1.1.1.1 | and (tcp[tcpflags] & (tcp-syn) != 0) —or— and (tcp[13] & 2 == 2) |
Filter Purpose | Custom Flag |
To capture all FIN packets to or from host 2001::2002 | and (ip6[53] & 1!=0) |
To capture all IPv6 SYN packets | ip6 or proto ipv6 and (ip6[53] & 2 == 2) |
Control | Description |
Report | Select the type of report you want to export from the drop-down list. |
Period | Select a report time interval of custom, last five minutes, last hour, last day, last week, or last month. |
Email Delivery | Sends the report to an email address. |
Email Address | Specify the email address of the recipient. |
Export | Exports the report data. |
Data series | Description |
Rule ID | The in-path rule ID. This ID corresponds to the Rule ID in the Optimization > Network Services: In-Path Rules page. |
Rule Summary | A summary of the rule's attributes. |
Description | The description, which corresponds to the optional Description field for the rule in the Optimization > Network Services: In-Path Rules page. |
Hit Count | The number of hits the rule has received. |
Last Hit Time | The last time the in-path rule was matched. |
Counter Clear Time | The last time the counter was cleared. |
Creation time | The time that the rule was created. |
Hostname | The hostname of the machine from where the user has logged in. |
Created by | The SteelHead user ID of the user that created the rule (for example, admin). |
Clear Stats | Clears the statistics. |
Email Notify | This field applies only if you specify a pass-through in-path rule, and indicates whether emails are sent when one or more pass-through in-path rules are configured. Reminder emails are also sent every 15 days. To enable email notifications, verify the following additional changes: •Select the Enable Email Notification check box when creating the rule in the Optimization > Network Services: In-Path Rules page. •Select the Send Reminder of Passthrough Rules via email check box in the Administration > System Settings: Email page. •Select the Report Events via Email check box and specify an email address in the in the Administration > System Settings: Email page. |