Content Creators: About Application Models
An application model defines the hardware and software used to support a business application. After an application is mapped (with hosts, internal elements, relationships, and end users), Portal uses the information to create dynamic dashboards for monitoring the end-to-end performance and status of the application.
When an application model is used to create an application map, the map visually shows performance and status using colors, defined by thresholds. The following figure shows an application model and the application dashboard summary created from the model.
The application map in the dashboard summary shows colors to indicate performance and status. From the application dashboard summary, you can easily view tooltips and drill down for details.
Application model and Application Dashboard summary
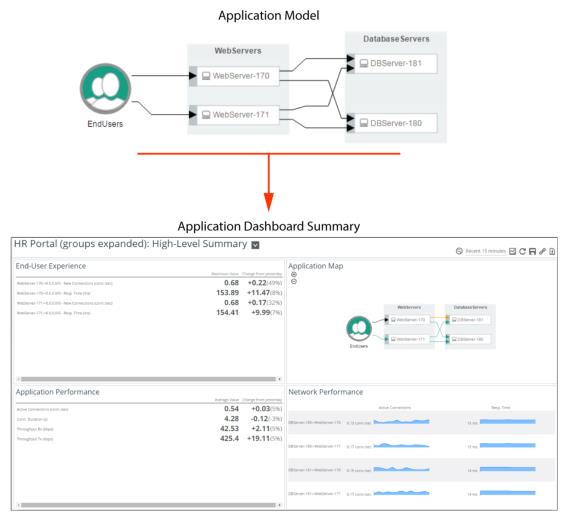
Application dashboards are adaptive in that they show the best content available for the given model. For example, the dashboards for an application monitored with NetProfiler and NetSensor will be different than those monitored by AppInternals and AppResponse (9.x).
Panels from application dashboards can be copied and pasted for reuse in custom dashboards. See
Copy and paste panels.Creating an application model may seem like a daunting task, especially if your knowledge of the application is limited. However, if you breakdown the process into manageable steps, you may be surprised how easy it is. But don’t expect to create an application model in a single session. The iterative process involves trial and error. That is why the software is designed to save your updates as the model is refined and to not allow others to use the model for monitoring until you indicate that the model is complete. Additionally, the software allows you to enter notes to support your updates and findings.
This table lists the general workflow for creating an application model. Consider the workflow as a starting point and then customize the process to your specific requirements.
# | Step | Description |
1 | Research Application | Learn as much as you can about the application. |
2 | Access Editor | Access the application editor to define the application model. |
3 | Specify Data Sources | Specify the data sources to use for an application model. |
4 | Define Back-end | Skip this step if you are modeling an application outside of the monitored network, such as a SaaS deployment. When the Add Hosts dialog box appears after defining the application name, simple click Close. |
5 | Define Front-end | |
6 | Refine | |
7 | Publish | |
8 | Define Thresholds | Define thresholds for the objects (that is, hosts, relationships) in the application dashboard. |
Hint: Document Your Findings
Enter notes regarding the application and objects (hosts, relationships, internal elements, and end users) for future reference. For more information, see
Documenting your findings with notes. |
About thresholds for application model objects
The ability to define thresholds for objects depends on the connected data sources. If one of the following data sources is connected, then you can define thresholds for those objects. (Also included are the metrics used to create the objects.) If one of the following data sources is not connected, then you cannot define thresholds for those objects. For example, if only AppResponse (9.x) and/or NetProfiler is connected, then you cannot define thresholds for hosts. But you can define thresholds for relationships.
Host
• AppInternals (CPU, Disk, Memory)
• AppInternals (9.x) (CPU, Disk, Memory)
• NetIM (CPU, Disk, Memory)
• NetIM (<2.3.0) (CPU, Disk, Memory)
.NET
• AppInternals (.NET health metrics (free memory, heap consumption, heap size, process CPU, thread count, time garbage collecting))
• AppInternals (9.x) (.NET health metrics (free memory, heap consumption, heap size, process CPU, thread count, time garbage collecting))
Java
• AppInternals (.NET health metrics (free memory, heap consumption, heap size, process CPU, thread count, time garbage collecting))
• AppInternals (9.x) (.NET health metrics (free memory, heap consumption, heap size, process CPU, thread count, time garbage collecting))
Group
• Aggregate of hosts
Relationship
• AppResponse (Response time)
• AppResponse (9.x) (Request rate, response time)
• NetProfiler (Response time, active connections, number of TCP resets, TCP retransmissions)
End User / Response Time
• AppInternals (Page Load Count, Page Load Time, and Violation Percentage)
• AppInternals (9.x) (Completed/Sec, Max. Active, Max. Response Time)
• AppResponse Application Stream Analysis (Connection Request Rate, Connections Failed Rate, User Response Time)
• AppResponse WTA (Page Time & Page View Rate)
• AppResponse (9.x) WTA (Page Time, Page View Rate, % Pages Optimized)
• AppResponse (9.x) Defined Application (Server Response Time (Servers), Turn Rate (Servers))
• Aternity (Activity Score)
• NetIM Synthetic Tests (Test Response Time, Test Status)
• NetIM (<2.3.0) Synthetic Tests (Test Response Time, Test Status)
• NetSensor Synthetic Tests (Test Response Time, Test Status)
• NetProfiler (Resp. Time, New Connections)
• Web Analyzer (Response Time, Page Views)
Related topics
Guidelines for modeling an application
Before creating an application model, conduct a little research. Ask the application developers and/or the IT staff about the application:
• On what server is the application deployed/installed (IP address/DNS name)
Does the application access a database and/or other components
• Does the application use Java or.NET framework
• Is the application behind a load balancer
• Are different transaction types performed at various times of the day or month
• Are there low-throughput or infrequent processes (for example, overnight batch operation)
Related topics
Creating application models
1. Choose Application > Create. The Application Name dialog box appears.
2. Enter a unique application name to identify the application and click OK.
The
Adding hosts dialog box appears for defining hosts (clients/servers) and relationships used by the application. For more information, see
About application model back-ends.To access an existing application model, perform the following procedure.
Accessing existing application models
1. Choose Application > Manage.
Alternatively, if the application model has been published, from the Home screen, click the application card’s gear icon and choose Edit Application.
2. Select the application that you want to edit and click Edit.
The application opens in the application model editor.
Related topic
About data sources for application models
You can specify the data sources to use for an application model. That is, search results will include components from all data sources and relevant metrics from all data sources will be used for monitoring the application. By default, all data sources are included.
If necessary, you can specify the data sources to use when monitoring individual hosts and relationships. See the
Hosts and
Relationships.Specifying data sources
2. Select Data Sources from the Model Menu/button. The Data Sources dialog box appears.
3. Select Use specific data sources. A list of available data sources appears.
4. Click data sources to select or unselect.
Only selected data sources will be used for monitoring. Unselected data sources will be excluded as will any data sources added or connected later.
5. Click OK.
About application model back-ends
Defining the back-end of an application model includes these procedures:
•
Adding hosts to search for and add hosts to the application model
Adding hosts
Hosts are servers that are involved in the execution of an application. When adding hosts one hop away from specific hosts, the relationships, representing traffic between the hosts, are also added.
The following procedure describes how to add hosts and relationships to an application model.
2. Choose Add > Add New Hosts…. The Add Hosts dialog box appears.
3. Enter the search criteria:
– In the search field, enter the full or partial name of the host or IP address.
For detailed information about searching the data sources for hosts and IP addresses, go to Knowledge Base article
S26458. (You must log in to view this Knowledge Base article.)
– Optionally, click the time range to specify a different time range.
4. Click Search. The search results are listed in the dialog box.
5. Add found hosts to the application model:
If no hosts are found during the search, you can optionally add a host manually be entering an IP address in the Manually-Added Host (IP Address) field (not shown above) and clicking Add Hosts. However, be aware that when published, no data will be shown for the manually added host until the host is monitored by a data source.
– Choose the hosts to add to the application model by selecting the check box in the first column.
– Optionally, clear the Include hosts one hop [downstream] check box from selected host(s) option to not add hosts that are one hop away. Alternatively, from the drop-down menu, select downstream, upstream, in both directions.
- Click Excluded Relationships to specify the relationships to exclude when adding hosts to the application model.
- Select an option from the NetProfiler search by drop-down menu:
Ports Only = relationships have port names specified, but no application names
Apps Only = relationships have application names specified, but no ports
Apps with Ports = relationships have application names and ports specified
Downstream relationships are those where the host initiated the connection. Upstream relationships are those where the host accepted a connection request.
– Optionally, change the setting for the Include previously deleted hosts and relationships in results option. If the check box is not selected, that previously deleted host/relationships are not added to the application model.
– Click Add Hosts. The hosts and relationships are added to the application model.
– Click Finish.
Adding neighboring hosts
The following procedure describes how to add hosts that neighbor the selected host(s). In other words, use this option to add hosts that are a single hop from selected host(s). This is an easy way to fill out an application model.
2. Select the host(s) in the application model to which you want to add neighboring hosts.
To select multiple hosts, hold down the SHIFT key and click the hosts.
3. Choose Add > Add Neighboring Hosts…. The Add Hosts dialog box appears.
4. Specify the search criteria:
– Time Range—Click the current time range to specify a different time range for the search.
– Direction of Hop—From the hosts one hop x from select host(s) option, select the direction from the drop-down menu: downstream, upstream, in both directions.
Downstream relationships are those where the host initiated the connection. Upstream relationships are those where the host accepted a connection request.
– Exclude Relationships—Click Excluded Relationship to filter relationships.
– NetProfiler Relationships—Select an option from the NetProfiler search by drop-down menu:
Ports Only = relationships have port names specified, but no application names
Apps Only = relationships have application names specified, but no ports
Apps with Ports = relationships have application names and ports specified
– Include Deleted Objects—Change the setting for Include previously deleted hosts and relationships in results to include/exclude hosts and relationships that match the search criteria.
5. Click Add Hosts.
The matching hosts and relationships are added to the application model.
6. Click Finish.
Adding relationships
If a relationship between two hosts is not being observed by any of the current data sources, then you can manually add relationships between the hosts.
Relationships represent the traffic flowing between hosts. A relationship is the application protocol used by two hosts.
When published, a manually created relationship will not be monitored until a relationship with the specified name is observed by a data source. Therefore, it is best to add relationship using
Adding neighboring hosts.2. Select the host or internal element to which you want to add a relationship.
To display internal elements for a host, select the host and choose View > Show Internal Elements.
4. In the Name field, specify the application protocol and port.
The specified name is listed on the
Relationships inspector when the relationship is selected.
5. In the application model, click a host or internal element to designate it as the server.
6. If necessary, click Switch to switch the designed client and server.
7. Click Add. The relationship is added and appears as a dashed line until the application map is published.
Related topics
Adding end users and response time
When defining the front-end of an application model, end users are a conceptual representation of how actual users access the application. End users connect to the application using one more relationships (response time).
Multiple end users can be added to an application model to signify different sets of users.
The following procedure describes how to define end-user experience monitoring in an application model.
2. Choose Add > Add End Users. An End Users object is added to the application model.
3. Select the End Users object. The
End User (Not Configured) inspector appears.
4. Optionally, change the name of the End Users object by editing the Name field in the inspector.
5. Add a Response Time. From the
End User inspector, click
Add Response Time. The Add Response Time wizard appears.
6. Follow the instructions shown in the three-step wizard:
– Select a server (host). (Select Unknown if the application is hosted outside of the monitored environment.)
– Select the end-user experience measurement type (data source)
– Select the application
The Response time appears as an arrow from the End Users object to the selected server (host).
Related topics
About refining application models
Refining the application model includes the following procedures:
Setting the status of objects
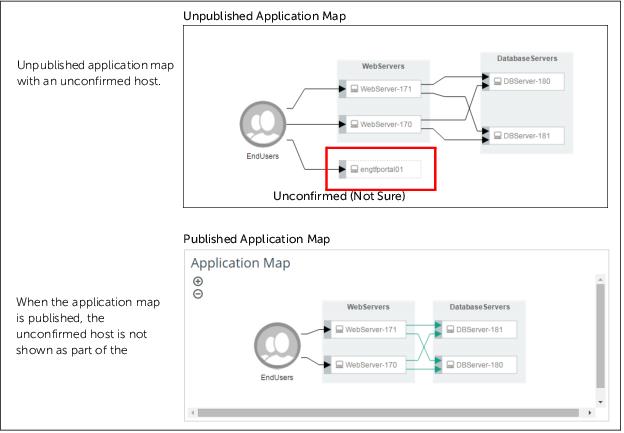
Creating an application map can be an iterative process that involves both interviewing subject matter experts and some trial and error. Before an application map can be used for monitoring, all objects in the map (hosts, relationships, internal elements) must be verified and their statuses must be set to In Application Model. When an application map is published for monitoring, any objects in the map not set to In Application Model will not appear in the application map and will not be monitored as part of the application.
For example, the following figure shows an application map in the application editor and the same map in an application dashboard after the map has been published. The status of all objects in the map is set to In Application Model except for the engtfPortal01 host. Notice that the unconfirmed engtfPortal01 does not appear in the application dashboard after the map has been published.
Unpublished and published application map
By default, all hosts, relationships, and internal elements are set to In Application Model.
Perform this task to set the status of objects:
1. In the application editor, select one or more objects.
Note the following:
– Objects must be displayed in the application map to select them:
- Groups must be expanded (Group > Expand Group)
- Internal elements must be shown (View > Show Internal Elements)
– To select multiple objects, hold down the Ctrl key and click each object.
– To select all objects of the same status, use the Select options (Select > Select All “Not Sure” and Select > Select All “In Application Model”).
2. In the info dock, select the status In Application Model or Not Sure for object(s).
If different types of objects are selected, be sure to set the status for each type. (The info dock will display a tab for each type: Host, Relationship, Internal Elements.)
You can easily identify the status of objects by their appearance:
- Objects set to In Application Model are shown with solid lines.
- Objects that are set to Not Sure are shown with dashed lines.
Related Topics
• “General Workflow for Resource Management“
• “Document Your Findings with Notes“
Deleting objects
Objects with the status Not Sure are not monitored as part of the application when the application map is published. For visual clarity, it is a good idea to delete the objects that are not part of the application. However, before deleting an object, it is good practice to adhere to the following guidelines:
• Set the status for the object to Not Sure.
• Enter notes pertaining to the object for future reference.
To delete a Host from the application map, select the object and click Delete.
To delete a relationship from the application map, select the relationship. Then in the info dock, select the relationship and click Delete.
Because it is assumed that deleted objects are not part of the application map, objects that have been deleted are not included in search results unless the “Include previously deleted hosts and relationships in results” option is selected.
Additionally, if you change your mind and want to reinstate an object that was previously deleted, you can select the object from the View Notes dialog box (Model > View Notes…). Find the object from the list and click Add Back.
Related Topics
• “General Workflow for Resource Management“
• “Document Your Findings with Notes“
Merging hosts
Use the merge feature when modeling Network Address Translation (NAT) hosts, where the IP address used within one network is translated to a different IP address in another network. In other words, when defining an application model, you can merge the front-end with the back-end. For example, you might see the following:
1.1.1.1 --> 2.2.2.2
3.3.3.3 --> 4.4.4.4
where 2.2.2.2 and 3.3.3.3 are different interfaces on the same physical host.
Grouping hosts
Use the group feature to represent logical hierarchy within the application model. When the application model is published and monitored, the status of a group will be based on the status of its members.
Groups can be collapsed or expanded using the View > Collapse Group and View > Expand Group options.
Merging hosts
2. Select the two or more hosts that you want to merge.
To select multiple hosts, hold down the Shift key and click the hosts.
3. In the
Hosts inspector, click
Merge selected hosts.
The selected hosts are merged into a single host.
To unmerge hosts, select the merged host, and click the Unmerge (

) icon in the
Hosts inspector.
Grouping hosts
2. Select one or more hosts that you want to group. To select multiple hosts, hold down the SHIFT key and click the hosts.
3. In the
Hosts inspector, choose an In Group option:
– To create a new group, click New, specify a group name, and click OK.
– To add the selected host(s) to an existing group, click the drop-down arrow and select the existing group name.
The selected host(s) are grouped.
When grouped hosts are expanded (View > Expand Group), the hosts are displayed in a shaded box.
To remove a host from a group, select the grouped host. Then in the
Groups inspector (shown below), select the host that you want to ungroup and click
Remove.
Excluding internal elements
You can specify the internal elements (databases, Java,.NET instances) to include when the application model is published and monitored. By default, all internal elements are included. That is, all internal elements will be monitored.
2. If the internal elements are not already shown, choose View > Show Internal Elements.
3. Select the host from which you want to exclude internal elements. The
Hosts inspector appears.
4. Next to Internal Elements, click Edit. The Internal Elements dialog box appears.
5. If the list of internal elements is not already shown, click the arrow.
6. Click internal elements to select or unselect. Only selected internal elements will be monitored. Unselected internal elements will be excluded.
7. Click Save.
Publishing application models
When the application model is complete, you can publish the model. When an application model is published, Portal generates an application dashboard that can be used to monitor the end-to-end performance and status of the application.
1. Choose Publish. The Publish dialog box appears.
2. Click OK. Portal creates an application dashboard from the model. The dashboard can then be used for monitoring the defined application.
After publishing an application for monitoring, the application can be shared with users and/or groups so that others can monitor the application.
To view and monitor the application, select the application card from the Home screen.
Related topic
Unpublishing application models
Published application models can be unpublished. When an application model is unpublished, it will no longer be available for monitoring. To unpublish an application model, edit the model and click Unpublish.
Documenting your findings with notes
Documenting your findings (such as how you learned about a specific host or your reasoning for excluding a relationship) is an important part of creating an application model. Your notes are a valuable resource for refining and maintaining application models.
This table lists the available places to enter your notes.
Object | Place to enter notes |
Application | Application Notes field in the Notes dialog box
(Choose Model > View Notes.) |
Host | Notes field in the
Hosts inspector |
Relationship | Notes field in the
Relationships inspector (Click the Add button.) |
End User | Notes field in the
End User inspector |
Internal Element | Notes field in the
Internal elements inspector If multiple objects are selected (hold down the SHIFT key and click the objects), then the notes are applied to all selected objects. Be aware that adding notes to multiple objects at once will override any existing object notes. |
To review notes for the application and objects (hosts, relationships, end users, response times, internal elements), open the Notes dialog box. (Choose Model > View Notes.)
Use these features to find an object in the list:
• Filter by Object Status—Filter the list by object status using these Show options:
– Published—Objects that have been published.
– Note Published—Objects that were added after the application map was last published.
– Deleted—Objects that have been added and then deleted from the application model.
• Display Objects with No Notes—Display objects with no notes using the Show option Object with no notes.
• Sort by Column Information—Sort the list by the information in a column by clicking the column header. Click the column header again to reverse the order.
• Reinstate a Deleted Object—To reinstate a previously deleted object in the application model, select the Add Back option for the object.
Related topic
About the application model editor
After learning about an application, it’s time to create the model. Application models are defined using the application model editor. See
Guidelines for modeling an application.To access the application model editor, perform one of these procedures:
Use the Application Model Editor to define application models.
• Zoom In/Out Buttons—Buttons for resizing the application model. Alternatively, use the View menu options to resize the application model.
• Publication Status—A message indicating whether the current application model has been published for monitoring.
• Inspector—Displays information and options specific to the selected object in the application model. If multiple types of objects are selected, the inspector displays the information on separate tabs. To adjust the width of the inspector, drag the left side of the panel. For more information, see
Inspector. About application model objects
Application models are graphically defined with the objects listed in this table.
Object | Description | Data source |
Hosts | The servers that are involved in the execution of the application | • AppInternals • AppInternals 9.x • NetIM • NetIM (<2.3.0) |
Relationships | The traffic flow between hosts in the application | • Web Transaction Analysis (AppResponse and AppResponse 9.x) • NetProfiler |
End Users | The users accessing the application | • Web Transaction Analysis (AppResponse and AppResponse 9.x) • Applications (Aternity) • Application Stream Analysis (AppResponse and AppResponse 9.x) • JavaScript (AppInternals) • JavaScript (AppInternals, Web Analyzer, (BrowserMetrix) • Enhanced Flow Data (NetProfiler) • Synthetic Tests (NetIM, NetIM (<2.3.0), and NetSensor) • Code Instrumentation (AppInternals 9.x) |
Response Time | The end user experience measurement for the application |
Groups | Provide structure in the application model. Groups are manually created. Groups can be expanded or collapsed. | — |
Internal Elements | The .NET or Java instances running inside a host. Internal Elements can be shown or hidden. | • AppInternals • AppInternals 9.x |
Related topic
About the application model editor menu options
Options | Description |
Model | |
Data Sources | Select the data sources to use for the model. If you select data sources, then only the selected data sources will be used for the model and any data sources which are not explicitly selected (including, for example, data sources which are connected to Portal later) will not be used for the model. |
Discard Edits | Removes all edits made to the application since the model was last published. |
View Notes | Allows you to review notes for current and deleted objects.
(Additionally, deleted objects can be reinstated.) |
Exit | Saves the application model and returns to the Home screen. |
Add | |
Add Neighboring Hosts… | Adds client/servers and their relationships to the application model for selected hosts. |
Add New Hosts… | Adds client/servers and their relationships to the application model. |
Add End Users | Adds an unconfigured end user to the application model. |
Select | |
Select All | Selects all hosts in the application model. |
Select All Not Published | Selects all hosts in the application model that were added after the last publication of the model. |
Select All Published | Selects all hosts in the application model that were included in the last publication of the model. |
View | |
Zoom In | Zoom in on the application model. (Alternatively, use the Zoom In (  ) icon.) |
Zoom Out | Zooms out of the application model. (Alternatively, use the Zoom Out (  ) icon.) |
Zoom to 100% | Sets the zoom level to 100 percent. |
Fit All | Sets the zoom level to display the entire application model. |
Center Map | Centers the application model in the application model editor. |
Show Internal Elements | Displays internal elements for a selected host. |
Hide Internal Elements | Hides internal elements for a selected host. |
Expand Group | Shows all hosts in a selected collapsed group. |
Collapse Group | Collapses all hosts in a selected expanded group. |
Delete | Deletes the selected objects from the model.
(To reinstate deleted objects, see Model > View Notes option.) |
Publish/Unpublish | Enables/disables the current application model for monitoring. |
Inspector
The inspector displays information and options specific to the selected object in the application model. If multiple types of objects are selected, the inspector displays the information on separate tabs. For a description of each inspector tab, see these sections:
To adjust the width of the inspector, drag the left side of the panel.
Hosts
Hosts inspector tab
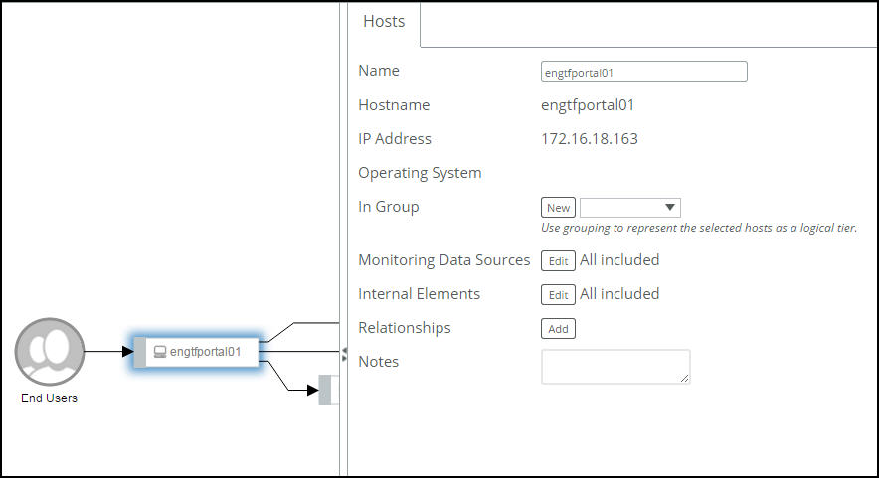
Field | Description |
Name | User-specified name of the host. To change the name, select the field and edit the text. |
Hostname | Name of the host. |
IP Address | IP address of the host. When a merged host is selected, this field lists the IP addresses of the merged host. Click Unmerge to move an IP address to its own host. (See Merge Hosts field.) |
Operating System | Operating system of the host. |
In Group | Adds the host to a group. Use the group option to represent the selected hosts as a logical tier. Click New to create a new group or select an existing group from the drop-down menu. For more information, see
Grouping hosts. |
Merge Hosts | Merges the selected hosts. Use the merge option to represent two or more hosts as a single host.
(This option appears when two or more hosts are selected. Hold down the SHIFT key and click each host.) Click Merge Selected Hosts to merge the hosts. For more information, see
Merging hosts. |
Monitoring Data Sources | Excludes data from specific data sources from monitoring the host. Click Edit to specify the data sources to exclude from monitoring the host when the application is published. |
Internal Elements | Excludes interface elements (databases, Java, .NET instances) from the host. Click Edit to specify the interface elements to exclude from monitoring the host when the application is published. Hint: Excluding unnecessary internal elements will reduce processing, which can improve overall performance. |
Relationships | Adds a relationship from the host. Click Add to manually define a client/server relationship with another host. For more information, see
Adding relationships. |
Notes | Specifies documentation regarding the host. |
Groups
Groups inspector tab
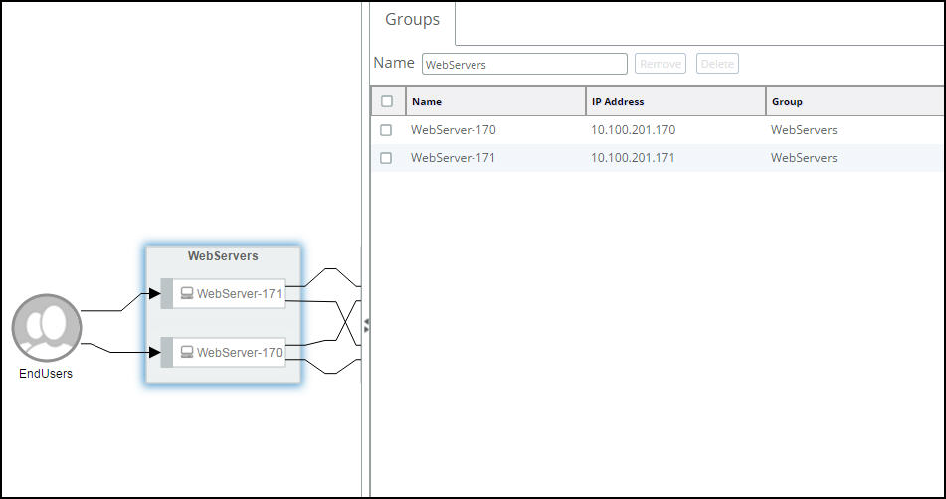
Field | Description |
Name | User-specified name of the group. To change the name of the group, select the field and edit the text. Related Actions: • To create a group, see the In Group field on the
Inspector. • To collapse a group, select the group and choose View > Collapse Group. • To expand a group, select the group and choose View > Expand Group. |
Remove | Removes the selected item from the group. |
Delete | Deletes the selected item from the application model. To delete a group, remove all items from the group. Then select the empty group and choose Delete. |
When multiple groups are selected, the Group column of the table identifies the group to which the item belongs.
Relationships
Relationships inspector tab
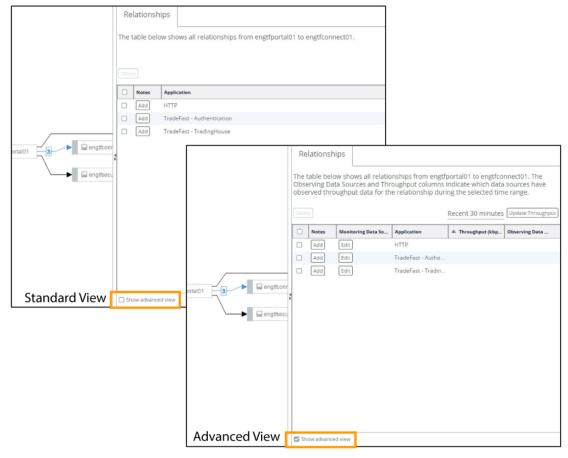
Field | Description |
Delete | Deletes the selected relationship from the application model. |
Add | Displays the Edit Notes dialog box for making notes about the specific relationship. |
Edit | Displays the Select Monitoring Data Source dialog box for specifying the data sources to use for monitoring the selected relationship when the application model is published.
(Advanced View only.) |
Time Range/
Update Throughput | Changes the time range and updates the throughput values for the selected items, which helps to identify the relationships to include in the application model.
(Advanced View only.) |
End User
To add an end user, choose Add > Add End Users.
End User inspector tab
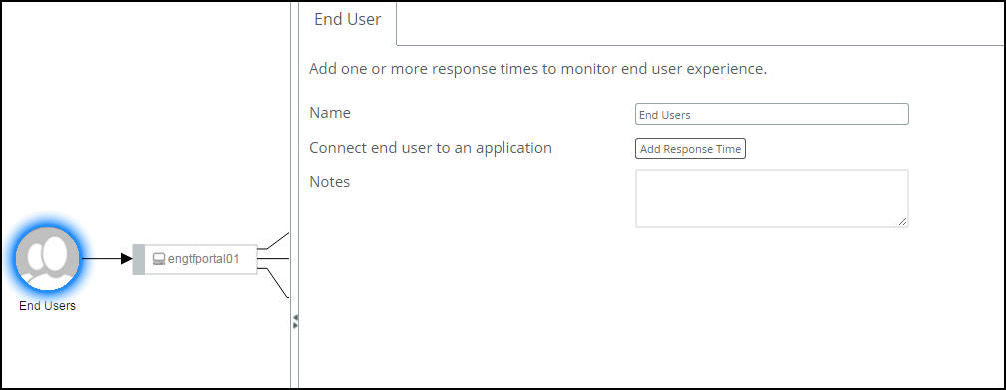
Field | Description |
Name | Name of the end user. To change the name, select the field and edit the text. |
Connect end user to an application | Adds a response time from the selected end user to a host. Click Add Response Time to define the response time between the end user and a host. |
Notes | Specifies documentation regarding the end user. |
Response Time
Response Time inspector tab
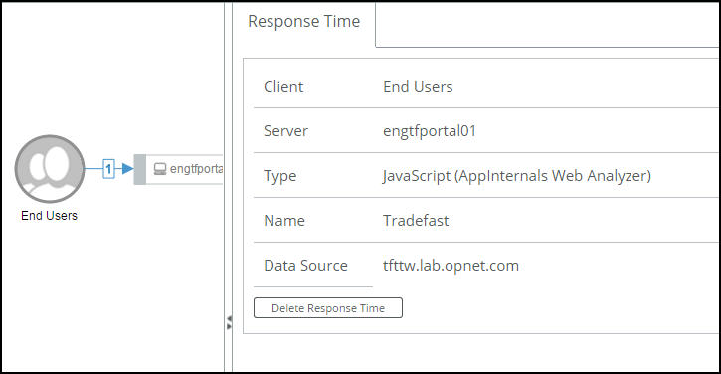
Field | Description |
Client | Name of the client (end user). |
Server | Name of the server. |
Type | Data source type. |
Name | Name of the application. |
Data Source | The data source ID. |
Delete Response Time | Deletes the response time. |
Internal elements
To display internal elements for a host, select the host and choose View > Show Internal Elements.
Internal Elements inspector tab
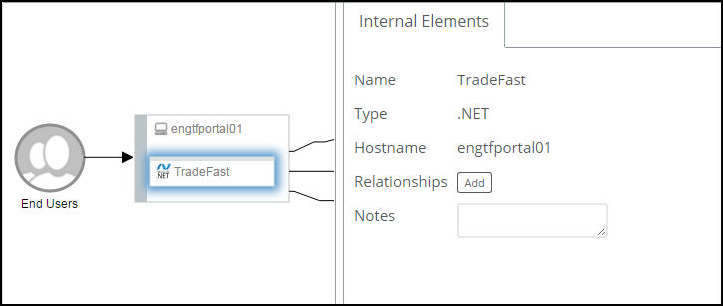
Field | Description |
Name | Name of the internal element. |
Type | Type of internal element, such as .NET or Java. |
Host | Name of the host. |
Relationships | Adds a relationship from the internal element. Click Add to define a client/server relationship with another host. |
Notes | Specifies documentation regarding the internal element. |