The Dashboard
The Dashboard displays a dynamic, at-a-glance view of how your entire Edge and storage infrastructure is performing, organized in various panes. Data is refreshed every 60 seconds.
If you are upgrading from any version without the Dashboard feature to version 4.5 or later, the Dashboard will appear after you clear your browser cache.
The system health status icon and the system hostname are located in the upper-left corner of the Dashboard page. Mouse over the icon to view the current system health status: Healthy, Degraded, or Critical.
Figure: Dashboard
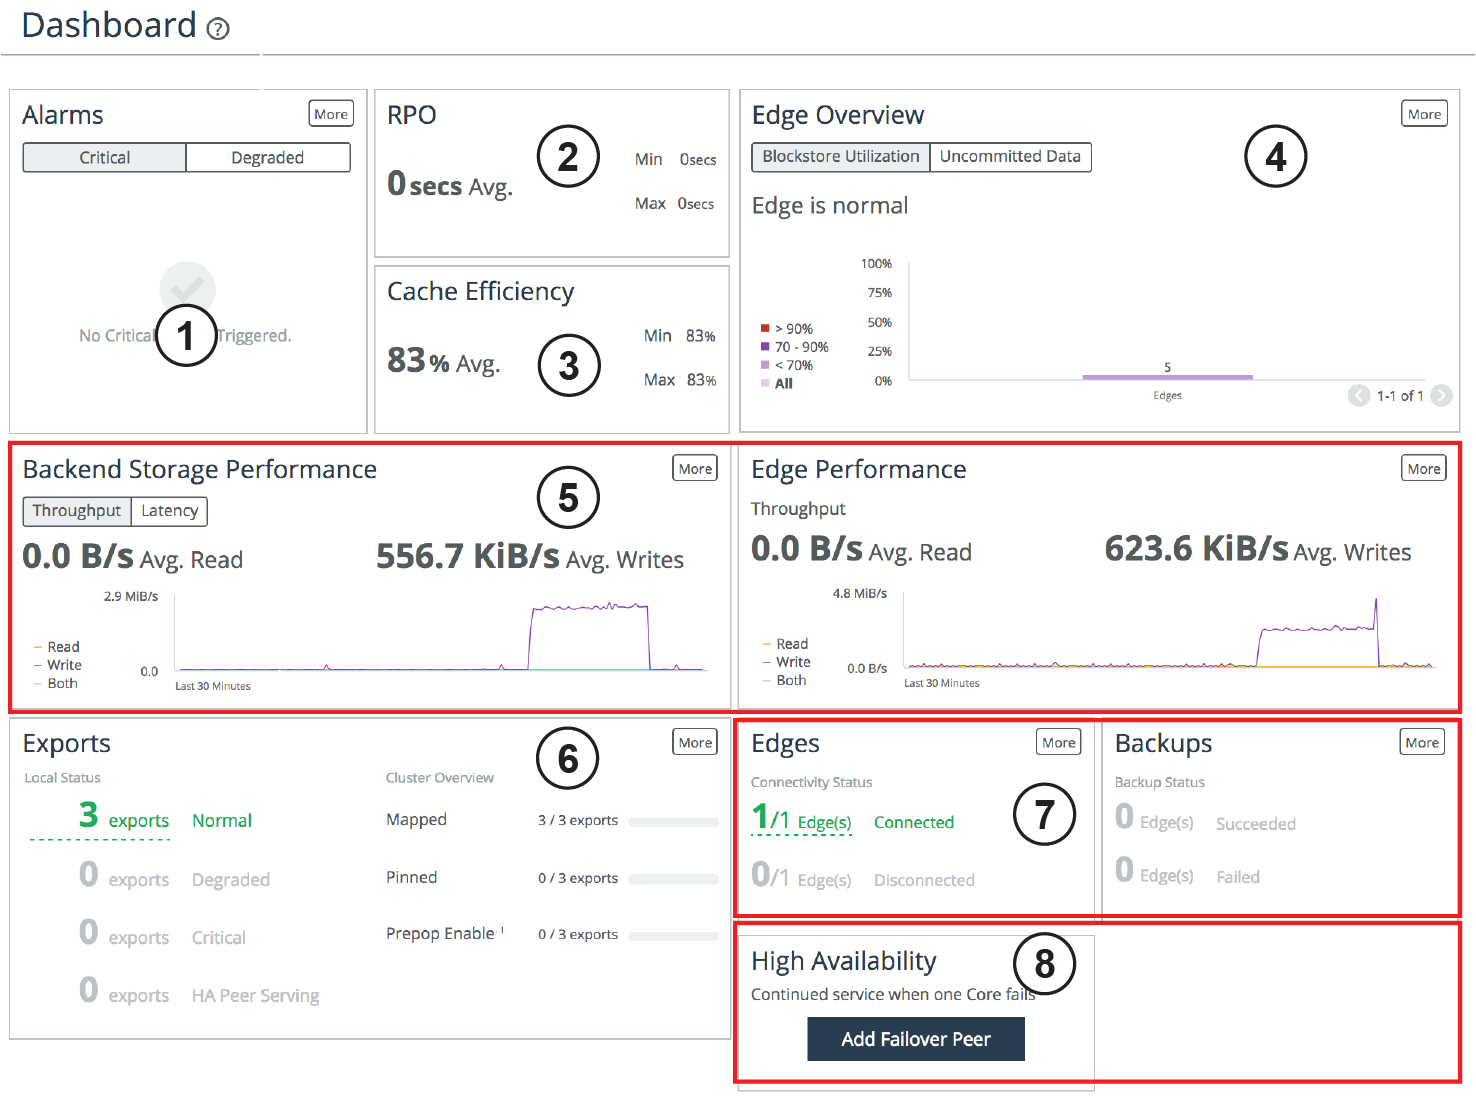

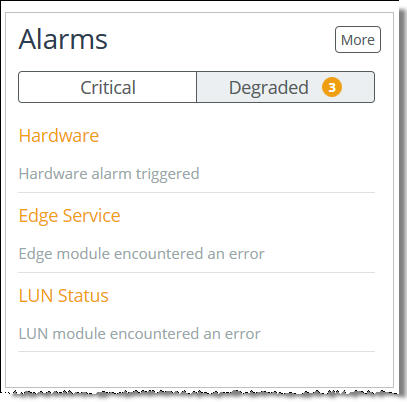
Alarms
• Alarms - Notifies you of any triggered Core alarms that require attention. There are two types of alarms: Critical or Degraded, and the number of triggered alarms appears on each tab. When the page is loaded, the Alarms pane displays the tab with the highest priority alarm by default. If both tabs contain active alarms, the Critical tab is shown by default. Click an alarm to view details on the Alarm Status page. Click More to view details on the Alarm Status page.
Figure: Alarms pane

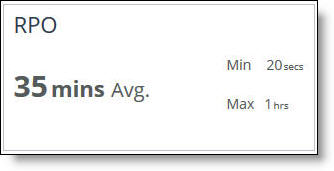
RPO
• RPO (Recovery Point Objective) - Summarizes the length of time since data from the Edges was last committed to the backend storage. For example, if the RPO is three hours, this means that there is a three-hour commit delay for data from the Edge to the Core, including any HA peers. These average, minimum, and maximum values are taken across all connected Edges running version 4.3 and later. The average value is useful as an overview of the average delay between the Edges and the Core, while the maximum value can alert you to a specific Edge that is particularly behind. A lower RPO is desired, and the actual number depends on the infrastructure. Click More to view details on the SteelFusion Edge Stats page.
Figure: RPO pane

Cache Efficiency
• Cache Efficiency - Displays how efficiently SteelFusion’s prefetch mechanism reduces the traffic between the Edge and the Core. This value is the percentage of data that is served locally from the cache compared to data read from the centralized storage (data center or cloud). These average, minimum, and maximum percentages are calculated across all connected Edges in the infrastructure (including any HA peers).
Figure: Cache Efficiency panes

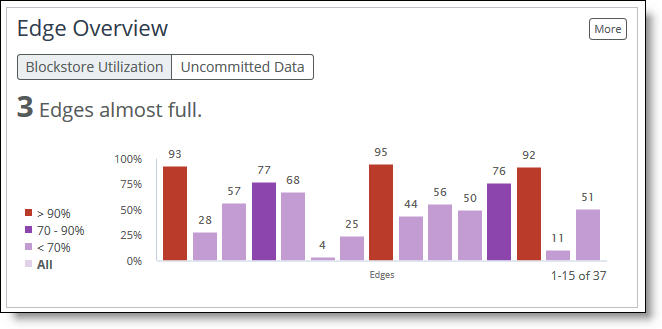
Edge Overview
• Edge Overview - Displays an overview of the Edges connected to the Core. Select the Blockstore Utilization tab to display the percentage of the blockstore currently being used at each Edge. Select the Uncommitted Data tab to display the percentage of blockstore data that is pending to be committed to the Core. Click More to view details on the SteelFusion Edges page.
Figure: Edge Overview pane

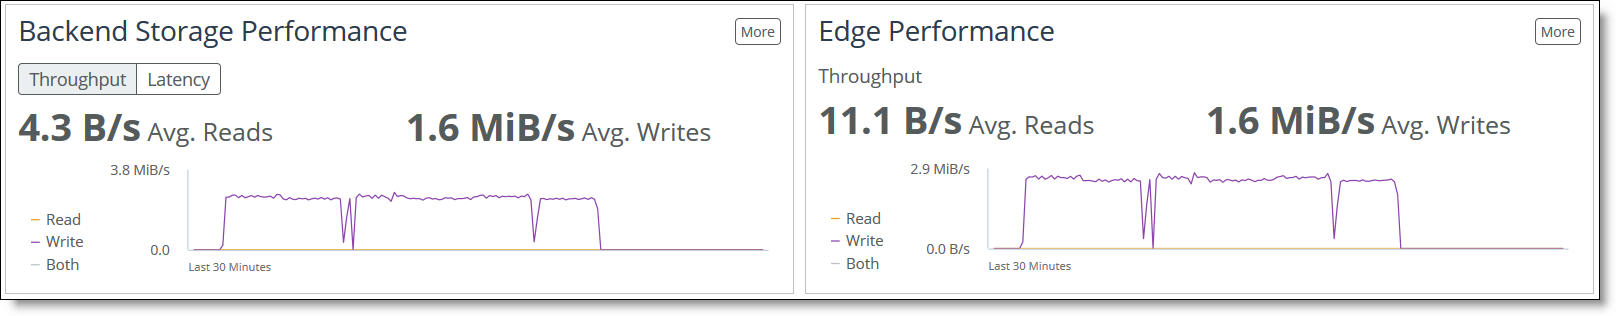
Backend Storage and Edge Performance
• Backend Storage Performance - Displays the performance statistics for all exports connected through this Core (and the peer Core, if HA is configured). This is an aggregate value across all exports. Select the Latency tab to view the average read/write latencies for all exports in the last 30 minutes. Select the Throughput tab to view how much data has been written to and read from the exports in the last 30 minutes. In both tabs, select Read, Write, or Both to customize the view. Click More to view details on the Export I/O Metrics page.
• Edge Performance - Displays the last 30 minutes of performance, measured in total read and write throughput, for all Edges connected to this Core (and the peer Core, if HA is configured). Click Read, Write, or Both to customize the view. Click More to view details on the SteelFusion Edges page.
Figure: Backend Storage Performance and Edge Performance panes

Exports
• Exports - Displays the total number of NFS exports and their current health state: Normal (the export is online and available), Degraded (the NFS export is unmapped, mapped but offline, or going offline), Critical (the NFS export is disconnected and/or unavailable), or HA Peer Serving. In addition, this pane displays the features currently enabled or configured on these NFS exports, such as prepopulation, snapshots, or whether the NFS exports are mapped or pinned. Edge Local Exports are included under the Local Status column. If NFS exports are not configured, click Add an Export to add an NFS export to this Core. Click More to view details on the Exports page.
Figure: Exports pane

Edges and Backups
• Edges - Displays the number of Edges and their connection status. The data shown is calculated across all Edges in the infrastructure (including the HA peer). If Edges are not configured, click Add an Edge to add an Edge to this Core. Click More to view details on the SteelFusion Edges page.
• Backups - Displays the overall status of configured backups in the Edge infrastructure and their current status. Edge backups are organized into Succeeded or Failed categories. The Backup Status for an Edge will display as Succeeded if all user-selected servers are currently protected. Click the Edges to display the Backups configuration page or click More to display the Backups report page.
Figure: Edges and Backups panes

High Availability
• High Availability - Displays the failover peer’s IP address or name and its failover state (if high availability is configured). Click the failover peer’s IP address or name to view the Dashboard for that peer. If high availability is not configured, click Add Failover Peer to add a peer. Click More to view details on the Failover Configuration page.
Figure: High Availability pane
Navigating in the SteelFusion Core Management Console
You can access the tools and reports in the Core using cascading menus.
To display cascading menus
1. Click the name of the type of information that you want to access in the menu bar to display the submenus.
For example, click Reports to display the Storage and Diagnostics submenus. The menu item that is currently active is highlighted.
2. To go to a page, select the menu name you want to display.
For example, choose Configure > Manage: SteelFusion Edges to display the SteelFusion Edges page.
The following table summarizes the cascading menus.
Menu | Description |
Dashboard | Displays the Dashboard. |
Configure | NFS - Mount NFS exports from a backend storage array, and map them to an Edge appliance. |
Networking - Configure host settings (hostname, DNS servers, hosts, proxies, date, and time), management interfaces (primary, auxiliary, and routing), and data interfaces. For details, see Configuring host settings. |
Wizards - Use the wizards to quickly perform initial setup and import/export Core configurations. For details, see Performing the initial setup. |
Manage - View currently configured Edges or add new ones to the configuration. For details, see Configuring Edges. |
Data Protection - Configure, manage, and monitor snapshots and backups. For details, see Configuring snapshots and backups. |
Failover - Configure another device for high availability in case of failure. For details, see Configuring failover. |
Reports | Storage - Display and download Core storage reports such as Edge connectivity and statistics for exports, network traffic, SANs, and replication. For details, see Viewing storage reports. |
Data Protection - View the status of the last backups (up to five), organized by Edge and server. VMs are listed under each server, and you can expand each VM to view its backup history. |
Report Builder - Select and display two reports on the same page. For details, see Building custom reports with the Report Builder. |
Networking - Display statistics for each configured interface. For details, see Viewing the Networking Interface Counters report. |
Diagnostics - Display and download Core diagnostic reports such as alarm status, CPU utilization, and memory paging. For details, see Viewing diagnostic reports. |
Logs - Display and download Core user and system logs. For details, see Viewing logs. |
Dumps - Display, download, or remove Core system and process dumps. View stored and currently running TCP dumps, add a new TCP dump, or use the TCP Dump scanner. For details, see Generating system dumps and Capturing and uploading TCP dumps. |
Settings | Maintenance - Start and stop system services, schedule jobs, upgrade software, back up configurations, and reboot or shut down the appliance. For details, see Starting, stopping, and restarting the service. |
Security - Configure general security parameters, user permissions, RADIUS, TACACS+, secure vault, and web settings. For details, see Configuring general security settings. |
System Settings - Configure alarm settings, announcements, email settings, log settings, monitored ports, and SNMP settings. For details, see Configuring System Settings. Modify the administrator user password. For details, see Changing the administrative password. Manage configuration files for the system. For details, see Managing configuration files. |
Help | Display online help and Core documentation; contact information for Riverbed Support; appliance details such as model number, revision type, serial number, software version; and appliance MIB files from this menu. For details, see Getting help. |
Getting help
The Support page provides you with the following options:
• Online Help - Displays online help and links to documentation on the Riverbed Support site.
• Technical Support - Displays links and contact information for Riverbed Support.
• Appliance Details - Displays appliance information such as the model number, hardware revision type, serial number, and the software version number currently installed on the appliance.
• MIB Files - Displays Riverbed and appliance MIB files in text format.
Displaying online help
The SteelFusion Core Management Console provides page-level help. You can also display an online help book containing all the help, including an index and table of contents.
The Management Console provides page-level help for the appliance.
To display online help in the Management Console
• Click the question mark (?) icon next to the page title. The help for the page appears in a new browser window.