Content Creators: About Thresholds
A threshold specifies a starting point. When defining elements that use color to indicate status (such as LEDs, LED Series graphs, and Graphs with status bars), a threshold specifies the numeric starting point of a status: Normal (green), Warning (yellow), and Critical (red).
For example, the following figure shows a dashboard LED Series element with warning and critical statuses reflecting specified ranges defined by thresholds.
LED Series in dashboard showing specified thresholds
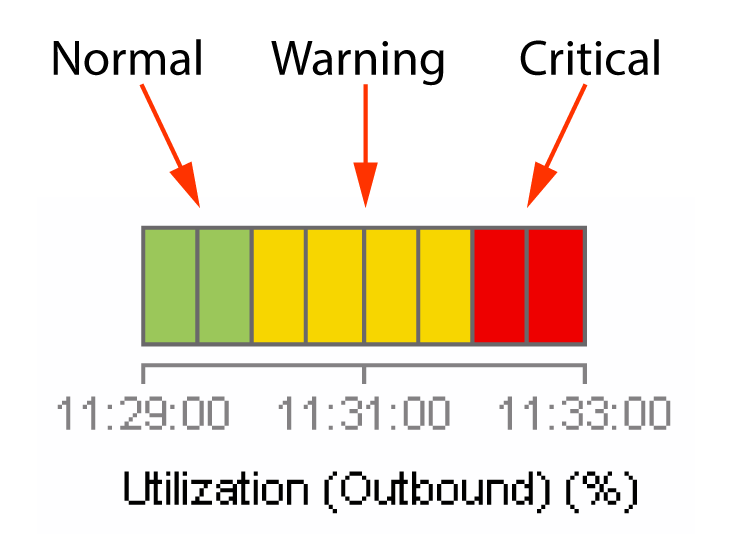
For example, suppose the LED Series has a High Critical threshold value of 90 and a High Warning threshold value of 80. When outbound utilization reaches or exceeds 80 (%), the element turns yellow. Similarly, when outbound utilization reaches or exceeds 90 (%), the LED turns red. For detailed examples, see
About threshold status levels.This section deals with data sources for which you must configure thresholds directly in Portal. If you do not configure the thresholds, the elements will be gray, and will not display status colors (green, yellow, red).
Some data sources (such as AppInternals 9.x) have thresholds configured in the data source itself.
For more information, see:
About individual and pattern-based thresholds
Portal has two types of thresholds: individual and pattern based.
An individual threshold applies to a specific metric, such as User Response Time (Servers), on a specific object, such as the application STOCK TRADER. If the same object-metric pair appears in multiple panels, then the specified threshold is applicable for the corresponding elements in those panels.
A pattern-based threshold applies to one or more metrics for one or more objects. When creating a pattern-based threshold, you use one or more of these fields to define the scope of the threshold:
• Object type—for example, Connected IP.
• Metric—for example, % Slow Pages (Servers) (%).
• Object Name pattern—A wildcard string that enables you to define a pattern with which to match object names. For example, a *NY* object name pattern matches these object names: NY_router_1, NY_router_2, and so on.
• Object Property—A drop-down menu containing object property names, and a field for entering a wildcard string search that enables you to find matches for a specific object property. For example, you might select the object property State from the object property drop-down menu. In the adjacent text field, you can then enter a wildcard search for the object property value *PA* for objects such as PA_router_1, PA_router_2, and so on. For more information on object properties, see
Grouping elements with object properties. These pattern-based threshold fields enable you to define a set of elements to which you can apply the pattern-based threshold. You can be as general or specific as required. For example, you can select just an object type, such as P Conversation. In this case, the threshold applies to all metrics for objects of the object type IP Conversation. To narrow the scope of the applied pattern-based threshold, choose a single metric, such as User Response Time (Servers). In this case, the pattern-based threshold applies to only User Response Time (Servers) for the set of objects of the object type IP Conversation.
You can access and configure thresholds in different ways:
Considerations when defining thresholds
Only one threshold can apply to the same object-metric pair at a time. This rule becomes important when both an individual threshold and one or more pattern-based thresholds apply to the same object-metric pair. For these situations, the individual threshold always takes precedence over pattern-based thresholds.
More specifically, thresholds are applied based on these precedence:
• assigned by data resource (See considerations specific to pattern-based thresholds, below.)
• assigned Individual threshold
• assigned Pattern-based threshold
Changes to an individual or pattern-based threshold can affect elements in other panels, if those elements match the modified threshold.
Considerations specific to pattern-based thresholds
For pattern-based thresholds, it is always the pattern-based threshold with the highest priority (that is, the one at the top of the pattern-based threshold table) that is applied. Select Increase Priority or Decrease Priority to move the thresholds up or down.
To restrict the scope of the pattern-based threshold, select Object Name Pattern and then use a wildcard string to search on objects sharing a common naming pattern.
To restrict the scope of the pattern-based threshold, select Object Property, choose an applicable object property from the drop-down menu, and then use a wildcard string to match an object property value. For more information, see
Grouping elements with object properties.Most data sources provide default thresholds. Having these thresholds already configured enables you to start monitoring data quickly. Default thresholds also provide a good starting point when creating dashboards. To override the default thresholds, simply assign a threshold or an unassigned pattern-based threshold.
The thresholds that are set for alerts within NetSensor and NetIM are not reflected in Portal.
For NetSensor and NetIM, if there are Rollups associated with the selected metric, you can further scope a pattern-based threshold by selecting a Rollup from the Rollup drop-down menu.
AppInternals 9.x data provide default thresholds that cannot be overridden from Portal. Instead, the thresholds must be defined in AppInternals 9.x.
About threshold status levels
There are five possible status levels for thresholds:
• High Critical and above
• High Warning to High Critical
• Normal
• Low Warning to Low Critical
• Low Critical and below
The following examples describe different ways of specifying ranges for thresholds.
Example 1—Specifying high ranges for a threshold
The following figure shows how you can use High Critical and High Warning boundaries to specify ranges.
High range threshold settings
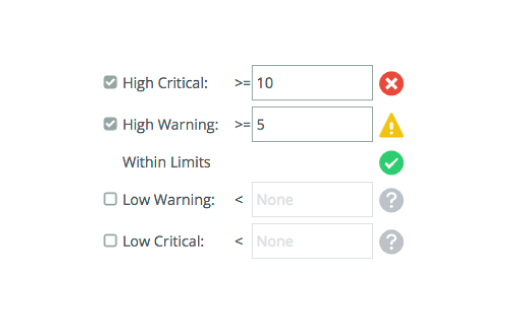
In this example, High Critical is set to 10 and High Warning is set to 5. When the value of an element is equal to or greater than 10, the element turns red (critical). Similarly, for values equal to or greater than 5 but less than 10, the element turns yellow (warning). A green element, reflecting the normal state, appears for values less than 5.
Example 2—Specifying low ranges for a threshold
The following figure shows how you can use Low Warning and Low Critical boundaries to specify ranges.
Low range threshold settings
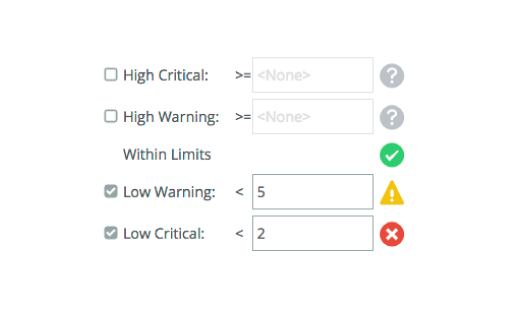
In this example, Low Warning is set to 5 and Low Critical is set to 2. When the value of an element is equal to or less than 2, the element turns red. Similarly, when the value is equal to or less than 5, but greater than 2, the element turns yellow. A green element, reflecting the normal state, appears for values greater than 5.
Example 3—Specifying ranges of a threshold by using a single boundary
The following figure shows how you can specify a single boundary, such as High Critical.
Single threshold settings
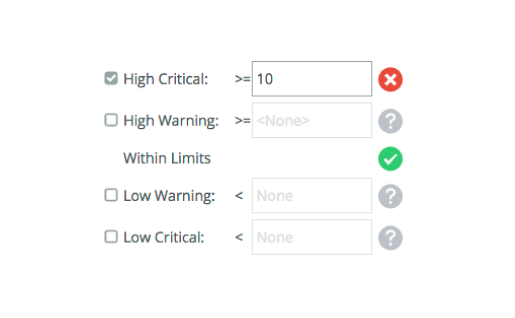
In this example, High Critical is set to 10. When the value of an element is equal to or greater than 10, the element turns red. For a value below 10, the element is green. There is no warning (yellow) boundary specified.
Defining thresholds for elements and panels
This procedure requires the Dashboard Configuration permission.
1. Right-click an element and choose Edit > Thresholds, or on the
Panel toolbar, click the Edit Settings (

) icon and choose Edit > Thresholds.
The following figure shows the Configure Dashboard Elements dialog box for a single element (on the left) and for multiple elements (on the right).
Configure Dashboard Elements
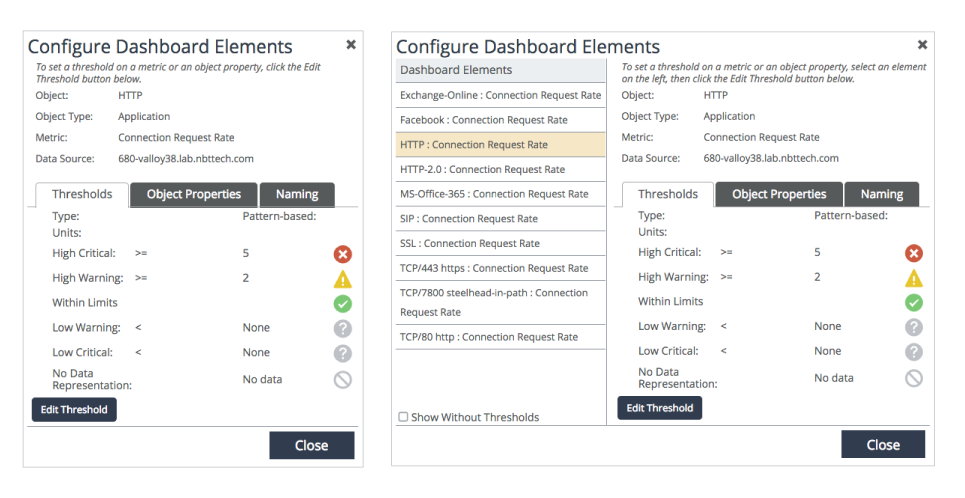
2. If the dialog box includes a list of multiple elements, select the element for which you want to define thresholds. To filter elements, select Show Without Thresholds to only show elements with no defined threshold values.
3. Click Edit Threshold. The Edit Threshold dialog box appears.
– To define an individual threshold, see
Step 4.
– To define a pattern-based threshold see
Step 5.
4. Define an individual threshold:
– Select Individual.
– Select the check box and specify a value, as needed, for each threshold status level:
- High Critical: Change to red if the metric is greater than or equal to the specified value.
- High Warning: Change to yellow if the metric is greater than or equal to the specified value.
- Low Warning: Change to yellow if the metric is less than the specified value.
- Low Critical: Change to red if the metric is less than the specified value.
- No Data Representation: Specify the icon to use when a data source returns “no data.”
To help you define threshold values, the line graph next to the individual threshold values shows the current data for the selected element and the defined threshold levels in the background.
– Click OK to close the Edit Threshold dialog box.
5. Define a pattern-based threshold:
– Select Pattern-based.
– If pattern-based thresholds have been defined for the same object/metric pair, you can select the threshold from the table and click Move to Top. Only the top threshold is applied.
– If a pattern-based threshold has not been defined for the object/metric pair, you can create one:
a. Click Create Pattern-based Threshold.
b. In the Create Pattern-based Threshold dialog box, specify the necessary information.
c. Click Create.
d. In the Edit Threshold dialog box, if necessary, move the threshold to the top of the table. (Select the threshold and click Move to Top.) Only the top threshold is applied.
– Click OK to close the Edit Threshold dialog box.
6. Click Close to close the Configure Dashboard Elements dialog box.
About global threshold management
You can globally manage thresholds from the Threshold Management screen, which lists all thresholds, Individual and Pattern-based. To access the Threshold Management screen, choose Administration > Dashboards: Thresholds.
From the Threshold Management screen, you can perform these operations:
• Individual Thresholds
– Edit—Use this option to edit a previously defined Individual threshold without opening the dashboard and locating the associated element. On the Threshold Management screen, select the Individual Thresholds tab, select the individual threshold from the list, and then click
Edit. Editing a threshold is similar to
Defining thresholds for elements and panels. – Delete—Use this option to delete a previously defined Individual threshold to clear the threshold setting from an existing dashboard element. Additionally, use this option to remove an Individual threshold that was defined for a dashboard that has been deleted. (On the Threshold Management screen, select the Individual Thresholds tab, select the individual threshold from the list, click Delete, and then click OK to confirm.)
• Pattern-based Thresholds
– Create—Use this option to create a pattern-based threshold. You can then define priority for the threshold, which defines when the threshold is applied. (On the Threshold Management screen, select the Pattern-based Thresholds tab, and click
New. Editing a threshold is similar to
Defining thresholds for elements and panels. – Edit—Use this option to edit a previously defined pattern-based threshold without opening the dashboard and locating the associated element. (On the Threshold Management screen, select the Pattern-based Thresholds tab, select the individual threshold from the list, and click
Edit. Editing a threshold is similar to
Defining thresholds for elements and panels. – Duplicate—Use this option to make a copy of an existing pattern-based threshold. You can then edit the copy to define a similar threshold. (On the Threshold Management screen, select the Pattern-based Thresholds tab, select the individual threshold from the list, and click Duplicate. The new copy is added to the bottom of the list.)
– Delete—Use this option to delete a previously defined pattern-based threshold. (On the Threshold Management screen, select the Pattern-based Thresholds tab, select the threshold from the list, click Delete, and then click OK to confirm.)
– Define Priority—Use the Increase Priority and Decrease Priority buttons to arrange the pattern-based thresholds in priority order, with the top being the highest priority. (On the Threshold Management screen, select the Pattern-based Thresholds tab, select the threshold from the list, click Increase Priority or Decrease Priority to move the selected threshold up/down.)
• Import/Export Thresholds—Use the Import and Export options for these purposes:
– Backup thresholds for archive purposes.
– Copy thresholds to another Portal server (such as from a test server to a production server).
– Edit multiple thresholds at one time. Simply export, edit the comma separated values, and import.
Only an experienced user should perform this option. Importing a malformed file will cause unexpected behavior.
About threshold status and settings visualization in graph elements
These settings are available to help you determine the threshold status and levels in custom dashboard graphs.
• Show Status Bar—Shows the critical (red), warning (yellow), and normal (green) statuses of the corresponding data points along the x-axis.
• Show Threshold Bands—Shows the critical (red), warning (yellow), and normal (green) threshold settings in the background of graphs.
To implement the visual settings in graph elements, perform the following procedure.
Configuring threshold status and settings visualization
1. Set the custom dashboard in edit mode. (In the dashboard toolbar, click the Edit Dashboard (

) icon.
2. In the panel toolbar, click the Edit Settings (

) icon, and choose Edit > Graph Settings. The Dashboard Panel Settings dialog box appears.
3. Scroll down to the bottom of the dialog box to see the threshold status and level settings.
4. Select one of the settings.
5. Click OK.
To quickly add a threshold visualization to graphs, define a graph visualization style with the threshold visualization style setting, and then apply the graph visualization style to elements/panels.