Navigating the Portal Web Interface
Portal is accessed using a web browser. Simply enter the URL into the web browser address field and, if necessary, log in. For the exact URL and credentials, contact your Portal Administrator.
1. Open a web browser and enter the URL for Portal. By default, the URL is as follows:
https://{<hostname> | <ip-address>}
2. If prompted, enter your username and password and click Sign In. The Portal Home screen appears.
The Home screen provides access to dashboards (for monitoring application performance) and to options (for creating/maintaining dashboards and applications), depending on your role and assigned permissions. For more information, see
About the Home screen.For security reasons, be sure to log out after completing your session. To log out, click Sign Out, located in the upper-right corner of the Portal screen.
About the Home screen
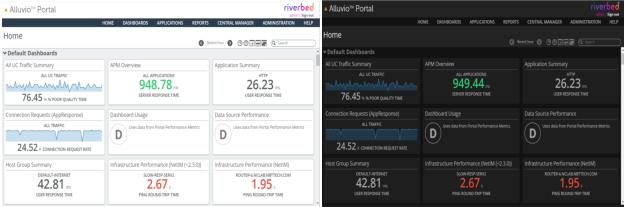
The Home screen provides access to dashboards and options based on the permissions assigned to your account. Portal supports both light and dark themes.
Example of light and dark screen themes
About dashboards
Portal allows you to create, manage, and view dashboards. A dashboard is a visual display of key performance indicators allowing you to monitor application performance. Typically, the displayed information is consolidated and arranged on a single screen to allow for at-a-glance monitoring.
Dashboards provide these features and functions:
• Creation—Dashboards can be created manually (using a template or free-hand) or automatically/dynamically based on application models and available metrics from data sources.
• Editability—Some dashboards can be edited, meaning the content can be modified and the modifications can be saved for future viewing.
• Interactivity—Users can drill down (either by double-clicking or by right-clicking options) for more detailed information in a temporary drill-down dashboard.
• Availability—Viewing of specific dashboards can be limited to particular users or groups of users. Additionally, the ability to drill down can be restricted.
• Automatic Update—Live dashboards (meaning dashboards that show the most recent n amount of time) update automatically at regular intervals.
This table lists the types of dashboards that are available in Portal.
Type | Creation | Editability | Automatic update |
| Manual (through the user interface) | Yes (with user permission) | Yes |
| Manual (using a template or free-hand) | Yes (with user permission) | Yes |
| Automatic/dynamic (based on available data sources) | No | Yes |
| Double-click/right-click options | No | Yes |
The dashboard types are described in the following sections.
About application dashboards
Application dashboards are based on defined application models. (Application models consist of the servers and relationships used by applications.) From each defined application map, Portal generates these dashboards based on the available metrics from data sources:
• High-Level Summary
• End-User Experience
• Application Map
• Application Performance
• Network Performance
While you can make configuration edits, you cannot change the metric data shown in application dashboards. However, depending on the change, modifying application models can alter the information shown in the dashboards.
Application dashboards can be shared with other users. If an application model is altered after being shared, the shared users will see the changes after the changes are published.
If assigned the Drill-down Access permission, you can
drill down for detailed information.
About custom dashboards
The dashboard’s content creator creates custom dashboards to satisfy monitoring requirements not met by application dashboards. Custom dashboards are crafted to display the necessary metrics and drill-downs to identify and troubleshoot application performance issues.
A custom dashboard can be created using one or more of these methods:
• Using a wizard and template
• Defining each panel manually
• Copying and pasting a panel from another dashboard
After being created, a custom dashboard can be shared with other users. If the dashboard is edited after being shared, the shared users will see the changes after the changes are published.
If assigned the Drill-down Access permission, you can
drill down for detailed information.
About default dashboards
Default dashboards are automatically created based on metric data from the available data sources. When the available data sources and metric data change, the information shown in the default dashboards also change.
A default dashboard cannot be edited. However, a default dashboard can be saved as a custom dashboard, and edited as necessary. Additionally, panels can be copied from a default dashboard to a custom dashboard, and edited as necessary.
If assigned the Drill-down Access permission, you can
drill down for detailed information.
About drill-down dashboards
Drill-down dashboards provide quick and easy access to detailed information for troubleshooting current or potential performance issues. Users who have the Drill-down Access permission can create drill-down dashboards by:
• double-clicking an element.
• right-clicking an element and choosing a drill-down option.
A drill-down dashboard can be saved as a custom dashboard and edited as necessary.
About search
Use the search option to search across all connected data sources for an object, such as a business group, web application, host, device, or IP address. The type-ahead feature displays matching results as you type. Click the object and choose one of the available templates to view data for that object. Alternatively, click the “Show all results for...” link to see the “Search Results for...” page. You can also use the search option to search for your custom dashboards (by name) and open them from the list of matching results. For more information, see
Creating dashboards using search.About data source status
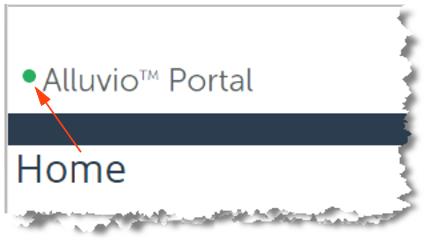
The data source status appears in the upper-left corner of the Home screen.
Data source status location
This table lists the possible statuses.
Symbol | Description |
| All data sources are connected. |
| At least one (but not all) data source is disconnected. |
| All data sources are disconnected. |
If the status indicates that data sources are disconnected, then a user with the ability to manage data sources can start the troubleshooting process by attempting to reconnect data sources. Double-click the data source status icon, select the disconnected data source, and then click
Reconnect. For more information see
Content Creators: About Data Sources, Objects, Metrics.Portal implements a uniform user interface, making it easy to learn and use. For more information, see:
Navigating dashboards
Perform these actions to navigate within the dashboards:
• To open a dashboard, click the card on the Home screen.
• To open a different dashboard, click the dark bar on the left side of the current dashboard. Then use the
Dashboard Group Navigator to select another dashboard.
• To return to the Home screen, select the Home menu option. Alternatively, click the browser’s Back button.
• To view details for an application dashboard, click the down-arrow (

) icon next to the application name and choose an option. Alternatively, click the Inspect (

) icon on the
Panel toolbar for which you want more detail.
• To view details for a custom or default dashboard, double-click an element or right-click an element and choose an option to view details in a floating window. Click the X in the upper-right corner to close the floating window.
– For Custom dashboards, right-click a drill-down option to display the details in a new dashboard. To return to the previous screen, click the browser’s Back button.
– For Custom and Default dashboards, right-click a Launch option to view more data in the data source.
• To view the Application Inspector, which provides details for an application, choose Dashboards > Performance Inspectors: Application and then use the
About the custom dashboard wizard. Alternatively, you can access the Application Inspector by searching for an application and selecting the Application Details template. When viewing an Application Details dashboard, click the down-arrow (

) icon next to the dashboard title to choose content options and the data sources to focus on.
• To view the Host Inspector, which provides details for a host, choose Dashboards > Performance Inspectors: Host and then use the custom dashboard wizard. See
About the custom dashboard wizard. Alternatively, you can access the Host Inspector by searching for an IP address or host and selecting the Host Details template. When viewing a Host Details dashboard, click the down-arrow (

) icon next to the dashboard title to choose content options and the data sources to focus on.
• To view the Host Group Inspector, which provides details for a host group, choose Dashboards > Performance Inspectors: Host Group and then use the custom dashboard wizard. See
About the custom dashboard wizard. Alternatively, you can access the Host Group Inspector by searching for a host group or IP address and selecting the Host Group Details template. When viewing a Host Group Details dashboard, click the down-arrow (

) icon next to the dashboard title to choose content options and the data sources to focus on.
• To view the IP Conversation Inspector, which provides detail for an IP conversation, choose Dashboards > Performance Inspectors: IP Conversation and then use the custom dashboard wizard. See
About the custom dashboard wizard. Alternatively, you can access the IP Conversation Inspector by searching for an IP conversation and selecting the IP Conversation Details template.
• When viewing an IP Conversation Details dashboard, click the down-arrow (

) icon next to the dashboard title to choose content options and the data sources to focus on.
About dashboard groups
Use dashboard groups to organize dashboards on the Home screen (requires Dashboard Configuration read-write permission).
Dashboard groups are global for the Portal instance; all users share the same set of groups. However, not all groups have to be visible on all users’ Home screens.
Built-in dashboard groups
These dashboard groups are created and populated automatically:
• Application dashboards—Includes cards for application dashboards. Use the
Content Creators: About Resources screen to control which content option to show when the application dashboard is opened.
• Default dashboards—Includes the default dashboards for the connected data sources.
• Uncategorized dashboards—Includes custom dashboards that have not been added to any other dashboard groups.
Built-in dashboard groups will not appear on the Home screen if they are empty or you removed them.
Dashboard Group Navigator
Use the Dashboard Group Navigator to quickly access other dashboards without returning to the Home screen. Click the dark bar on the left side of a dashboard to access the Dashboard Group Navigator, which shows an outline view of groups and dashboards with the open dashboard highlighted.
Managing dashboard groups
1. Choose Administration > Dashboards: Dashboard Groups to create, edit, and delete groups.
2. Select Edit to set the order of dashboards within a group. You can also add custom dashboards and instances of dashboard templates to the group. Users cannot override these global settings for the Portal instance. Users can change the order of, and choose not to see, dashboard groups.
You can add dashboard groups from the Administration > Dashboards: Dashboard Groups screen, from the Add icon (

) on the toolbar when viewing a dashboard, and from the Settings icon (

) on Home screen cards.
Editing the Home screen
1. Choose Administration > Dashboards: Edit Home Screen to configure your Home screen (requires Home Screen Customization permission). You can set the display order of groups, hide or show groups, and reset to the default Home screen configuration.
2. If you have the read-write Dashboard Configuration permission, you can set the current Home screen configuration to be the default for all users.
3. Click Reset to Default to remove user-level customization. If you have the read-write Dashboard Configuration permission, then a second reset will restore the Home screen to the factory default.
About Key Performance Indicators
Key Performance Indicators (KPIs) on Home screen cards give you a quick view of the status of the items you are monitoring.
KPIs are provided for many default dashboards and for other curated content (for example, instances of dashboard templates such as Host Details and Application Details).
Custom dashboard templates (see
Content Creators: Custom Dashboard Templates) support KPIs. If a KPI is set on a custom dashboard and you templatize it, Portal will try to templatize the KPI.
You can disable all the KPIs on your Home screen. To do this, choose Administration > Dashboards: User Dashboard Settings, and then clear the Enable KPI on Home Screen check box.
You can also disable KPIs for all users (requires Dashboard Configuration read-write permission). To do this, choose Administration > Dashboards: Global Dashboard Settings, and then clear the Enable KPI on Home Screen check box.
A KPI can only be a single object-metric pair and neither aggregations nor live searches are supported.
Adding and changing KPIs
Dashboard content creators can add KPIs to dashboards (one KPI per dashboard). You can add KPIs to a dashboard from the Home screen or from the dashboard (in edit mode). To create or edit a KPI, you must have the read-write Resource Configuration permission and access to the dashboard. If a dashboard has multiple content options, the KPI is tied to just one of them.
To create (or change) a KPI from a dashboard in edit mode, right-click the element if the KPI object-metric pair is visible on the dashboard and select Set as KPI for Dashboard. If the object-metric pair is not visible, then click the Settings icon (

) and select Add KPI for Dashboard....
To create (or change) a KPI from the Home screen, click the Settings icon (

) on the card and select Add KPI for Dashboard....
When adding a KPI, the
Object Selection Wizard opens in single-select mode.
Customizing KPIs
To customize a KPI for a dashboard, select Modify KPI for Dashboard... from the gear icon on the dashboard’s Home screen card or from the gear icon in the toolbar from the dashboard’s edit screen.
• Selected Object and Selected Metric—Clicking either of these fields will open the
Object Selection Wizard and let you specify a new object-metric pair to use for the KPI.
• Style—Select one of these options: Sparkline with Value, Sparkline with Status, Text Value, or Text Value with Status.
• KPI Settings—Configure additional KPI settings.
• Threshold: provides convenient access to configuring associated thresholds:
– Individual threshold for the specific object-metric pair
– Pattern-based threshold populated for object type and metric
About dashboard components
Regardless of the type (application, custom, default), dashboards are comprised of panels, and panels are comprised of elements.
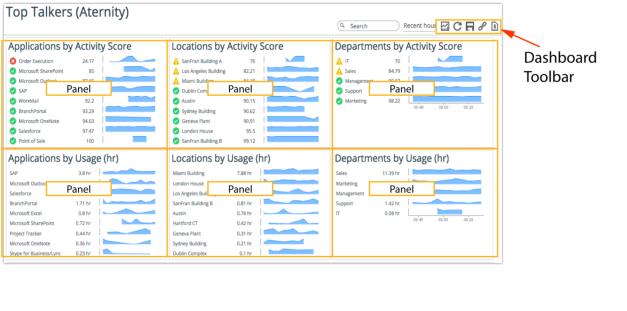
In the following figure, the sample dashboard has six panels. Also note the
About the dashboard toolbar in the upper-right corner. The available toolbar options are dependent upon your assigned permissions and the dashboard type.
Sample dashboard with six panels
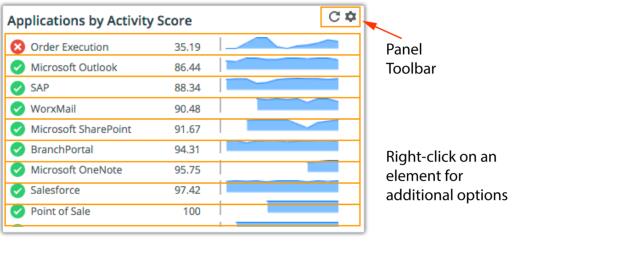
The following figure shows a single panel. In this case, each line is an element. Depending on your assigned permissions and the dashboard type, you can right-click an element for additional options. Also note the
Panel toolbar that appears when you mouse over the upper-right corner of the panel. The available toolbar options are dependent upon your assigned permissions and the dashboard type.
Sample single panel with panel toolbar
When a dashboard is created, the dashboard’s content creator selects the appropriate element type for the metric. The available element types are area graph, bar chart, compact row, donut chart, gauge, historic comparison row, geographic map, LED, LED Column, LED series, line graph, pie chart, sparkline, table, text, and value row.
About time ranges
When on the Home screen or viewing a dashboard, you can change the time range for a broader or narrower perspective.
When specifying the time range, you can choose between the Live (Most recent) option and Static (Custom) option.
Use the Live (Most recent) option to determine the current state of an application. The Most recent option is a live search from the current time to a specified amount of time in the past (for example, 1 hour, 4 hours, 1 day, and so on). The Home screen or dashboard is updated at regular intervals, since the current time is always moving forward.
Use the Static (Custom) option to identify performance trends over a specified time period in the past (for example, CPU usage for last month).
Under certain conditions, even if you have the assigned permission, you may not be able to change the time range for a custom dashboard. If the dashboard’s content creator locks the time range for a custom dashboard, then other users are prohibited from changing the time range. Additionally, if the dashboard’s content creator specifies a time range for a specific panel in a custom dashboard, then changing the time range for the dashboard will not change the time range for the panel.
All of the KPIs on the Home screen respect the specified time range.
Wide time ranges can impact performance. For best performance, keep time ranges as narrow as possible. If you do need to specify a wide time range, be sure to reset the time range to a narrower time range when your analysis is complete.
About toolbars
About dashboard cards
To access a specific dashboard, click the card on the Home screen. See
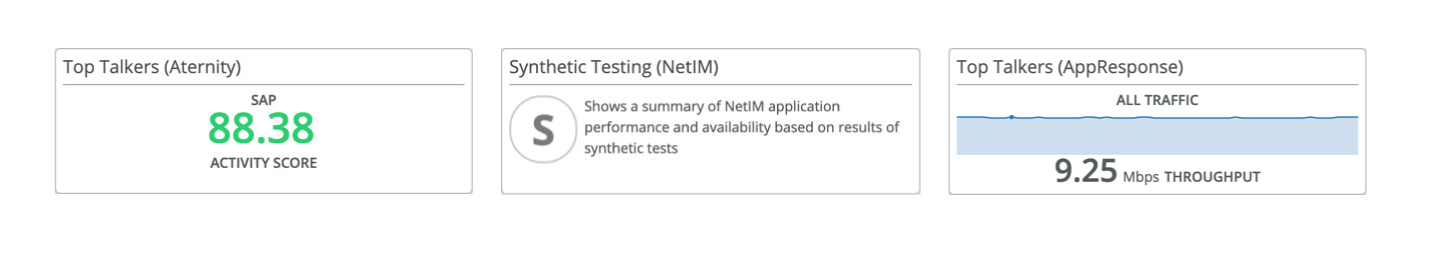
About the Home screen.Here are some typical cards.
Examples of cards
For quick access to common operations, click the Settings (

) icon, available on application and custom dashboard cards. The availability of certain options is dependent on the type of dashboard (application, custom) and the permissions assigned to your account.
• Edit Description—Modifies the description shown on the card (only works if the description is visible on the dashboard card).
• Modify Icon…—Changes the icon associated with the dashboard. By default, the first letter of the name is shown in a circle.
• Rename—Renames the dashboard.
• Add to Group—Adds dashboard to a new group or an existing group.
• Remove from Group—Removes dashboard from its current group (it will return to the Uncategorized Dashboards group).
• Add KPI for Dashboard…—Adds a Key Performance Indicator to be used on the dashboard card.
• Modify KPI for Dashboard…—Modifies the Key Performance Indicator to be used on the dashboard card.
• Clear KPI for Dashboard…—Clears the Key Performance Indicator. The dashboard card will revert to showing the description.
• Edit Application—Opens the application in the application model editor for modification.
• Delete Application—Deletes the application.
Application dashboards
When you open an application dashboard, the high-level summary dashboard appears. For detailed information, click the down-arrow (

) icon next to the application name and choose an option:
• End-User Experience
• Application Map
• Application Performance
• Network Performance
Alternatively, click the Inspect (

) icon on the
Panel toolbar for which you want more detail.
To return to the high-level summary dashboard, click the down-arrow (

) icon and select High-Level Summary or click the browser’s Back button.
About the dashboard toolbar
The dashboard toolbar is located in the upper-right corner of all dashboards.
The dashboard toolbar provides quick access to common operations. The availability of certain options is dependent on the type of dashboard (application, custom, default), the current dashboard mode (monitor, edit), and the permissions assigned to your account.
This table lists the dashboard toolbar options.
Option | Icon | Description |
Search | | Creates a dashboard for a found object. |
Time Range | | Specifies the time range of data shown in the dashboard. |
Add to Group | | Adds the dashboard to one or more dashboard groups or create new dashboard groups. |
Analytics | | Performs analyses and troubleshoots issues. |
Refresh | | Reloads the current page. |
Save As Custom Dashboard | | Saves the current dashboard as a new custom dashboard after prompting for a new dashboard name. |
Link or Embed Dashboard | | Provides quick access to live, read-only dashboard content. |
Create a Custom Dashboard Template from this Dashboard | | Invokes the Custom Dashboard Template Wizard. |
Create a Report from this Dashboard | | Creates a report based on the current dashboard. |
Edit Dashboard | | Places the dashboard in edit mode.
(This option is available when a custom dashboard is in monitor mode.) |
Dashboard Settings | | Defines dashboard-specific settings.
(This option is available when a custom dashboard is in edit mode.) |
Add Content | | Adds a new panel to the dashboard.
(This option is available when a custom dashboard is in edit mode.) |
Done Editing | | Places the dashboard in monitor mode.
(This option is available when a custom dashboard is in edit mode.) |
Panel toolbar
Each panel has a toolbar for performing options on the panel. To display the toolbar, mouse over the upper-right corner of the panel.
This table lists the panel toolbar options.
Option | Icon | Description |
Inspect | | Displays detailed information.
(This option is available only on the high-level summary dashboard for an application.) |
Refresh | | Reloads the panel. |
Edit Settings | | Edits the thresholds, object properties, and allows you to copy the panel. Additional options are available if the custom dashboard is in edit mode: pane configuration, time range settings, visualization styles, and grouping options. |
Add Content to panel | | Opens the Object Selection Wizard to add elements to the panel.
(This option is available when a custom dashboard is in edit mode.) |
Close | | Deletes the panel. (This option is available when a custom dashboard is in edit mode.) |
If you do not see all of the panel toolbar options, then you either don’t have the assigned permission to perform the option or the custom dashboard is not in edit mode. To edit a dashboard, click the Edit Dashboard (

) icon on the
About the dashboard toolbar.Customizing dashboard look and behavior
You can customize the look and behavior of dashboards to suit your personal preference, including:
• whether to display the dashboard navigator
• whether to display KPIs on the Home Screen
• whether to enable Operations View, which shrinks the header to provide more display area for dashboards
• choosing dark or light theme
• drill-down options on element right-click menus
These and other customizations are defined with the User Settings option.
Changes made with the User Dashboard Settings option apply only to you, and no other users.
1. Choose Administration > Dashboards: User Dashboard Settings. The User Settings dialog box appears.
2. Change the settings as desired.
– Setting Descriptions—For a description of a setting, mouse over the option text to display a tooltip.
– Identify Non-Default Settings—When a default setting is modified, an asterisk displays next to the option text as a visual cue that the default setting has been changed.
3. Click OK to save the changes.
Alternatively, click Restore to System Global Settings to reset all settings to the globally defined settings, including the drill-down settings.


