Deployment Scenarios
This section describes the following deployment scenarios:
Choosing How to Deploy the NetShark and Packet Analyzer
You can deploy the NetShark and Packet Analyzer in the following scenarios:
No matter which deployment scenario you use, the following information applies. You deploy the NetShark and Packet Analyzer if you want extremely detailed views of network traffic and to improve troubleshooting of your network-related issues. Because the NetShark can only receive packets, you must install the NetShark in a location close to the source of the majority of the packets you are interested in collecting and analyzing. Remember that this deployment does not include the higher-level analysis and reporting that is included with the NetProfiler.
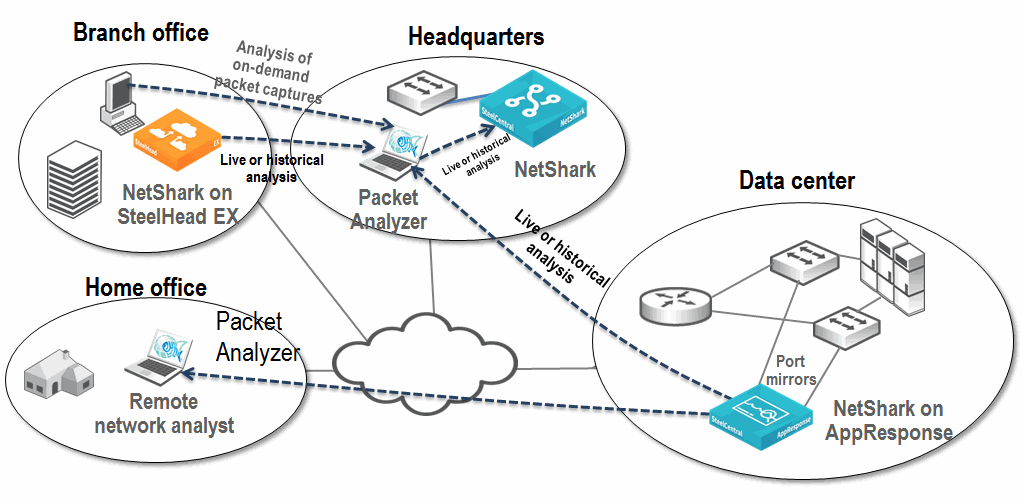
Figure: Example NetShark and Packet Analyzer Deployment shows an example NetShark (any variation) and Packet Analyzer deployment. Although this example shows only a single NetShark appliance, you might need additional NetShark appliances for large data centers or to monitor additional locations.
Figure: Example NetShark and Packet Analyzer Deployment

For most deployment scenarios, you want to deploy the NetShark in the data center. The majority of network traffic in most corporate environments is focused in the data center, making it an ideal place to put a traffic-monitoring solution. You can investigate and analyze the conversations flowing between end users and the servers in the data center—this information is invaluable when troubleshooting a network issue.
When you install the NetShark in the data center, you do not always catch all traffic. However, this uncaptured traffic is often not of great interest or significant volume: for example, local print traffic to a floor or building. If you want to monitor traffic that does not go through the data center, you can place additional NetSharks at strategic wiring closets or deployed in the branch office on the SteelHead EX. Because there are many NetShark sizes, you can choose one solution that is appropriate for the data center and a smaller NetShark for a remote wiring closet if appropriate. The availability of the NetShark-v enables you to leverage the power of NetShark in conjunction with an existing VMware ESXi, or Microsoft Hyper-V, or SteelHead EX VSP environment and extend visibility into parts of your network that were not previously practical. For available NetShark models, see
Choosing a NetShark Model.
If you connect the NetShark to a network mirror port or TAP, you can detect network activity that you want to monitor but not necessarily store: for example, you can create watches (configurable alerts based on the behavior of certain traffic) to detect certain conditions without capturing the traffic. You can preserve only the desired information, thereby reducing the amount of disk space you use compared to a capture job that captures all traffic.
For more details about watches, see the SteelCentral Packet Analyzer Reference Manual.
To store network traffic, you must define capture jobs on the NetShark. Capture jobs tell the NetShark what sort of packets to store to disk. The capture job can store packets based on a wide variety of criteria, including physical source, medium, or various aspects of packet-header information. Each NetShark network interface can support 15 running, non-indexing capture jobs. If any of these jobs include indexing, the number of running capture jobs supported on the interface is 14. You can create an unlimited number of stopped capture jobs. For example, you can define one capture job to capture all traffic on specific VoIP ports, and define another capture job to capture all traffic destined for specific critical servers. The different capture jobs operate independently of each other and can capture overlapping data.
Use Packet Analyzer to analyze the data stored on a NetShark and to look at real-time and historical traffic. You can use a variety of views, filters and drill-down techniques to analyze traffic. Packet Analyzer has numerous views available to assist with the analysis. Because Packet Analyzer can connect to multiple NetSharks, the location of Packet Analyzer is not as critical as the location of the NetShark. When you use Packet Analyzer to apply views to packets captured on NetShark, only a small amount of information is actually passed between Packet Analyzer and NetShark. This small amount of data helps to optimize the performance and limit the impact of manipulating the data on the network.
Packet Analyzer does not pull down all of the packets unless prompted to open the packets in Wireshark or save the packets to a local file. Typically, when you save packets or pull packets into Wireshark, you have already filtered the data so that you move only specific packets.
When looking at real-time (or near real-time) data, increasing the physical distance between Packet Analyzer and the NetShark can force more traffic to travel on the WAN. Retrieving full-packet data from the NetShark across a WAN, can use significant amounts of bandwidth and possibly have an impact on other traffic.
To prevent these issues, place Packet Analyzer as close as possible to the NetShark. If you place Packet Analyzer across a slower WAN from the NetShark, you must apply appropriate views and filtering before viewing raw packets or saving these packets locally to minimize the impact these actions have on overall network performance.
Deploying NetShark and Packet Analyzer
The NetShark provides up to 72 TB for packet storage and supports up to eight 1-Gbps and 10-Gbps network interfaces in various combinations depending on what model of NetShark you deploy. This combination provides a powerful solution for packet capture and analysis, while also allowing you to forward flow data to a NetProfiler.
Deploying the NetShark on AppResponse and Packet Analyzer
The NetShark on AppResponse provides a number of benefits over a traditional NetShark, NetShark-v, or NetShark on SteelHead EX deployment. If you have the NetShark on AppResponse, you can analyze packets with both the AppResponse processes and the NetShark processes. Having both processes enables the AppResponse to feed flow data to the NetProfiler. Packet Analyzer can access the entire packet store of the AppResponse, enabling for hundreds of terabytes of packet storage and the use of high-speed 10-Gbps NICs.
When you deploy the NetShark on AppResponse you can configure the NetShark to forward flow data to NetProfilers without any additional license requirements. If you want to access the NetShark with Packet Analyzer, you need an additional NetShark license and Packet Analyzer license.
The NetShark-v on AppResponse does not support capture jobs. Instead, all traffic captured is in a single job that uses the same packet store as AppResponse. This single job enables access to all packets detected and stored by AppResponse without having to use space to double store packets.
Deploying the NetShark-v on SteelHead EX and Packet Analyzer
The NetShark-v is a perfect solution for an enterprise looking for better visibility into smaller branch offices with SteelHead EX. The NetShark-v on the SteelHead EX provides enables you to gather traffic from external sources (such as SPANs off switches, TAPs off links, or aggregators) and generate advanced metrics, including VoIP metrics (MOS, Jitter, and so on) and end-user experience information (response time, client delay, and so on).
The NetShark-v on the SteelHead EX has the following limitations:
• Packet storage space is limited to the space available in VSP.
• There is no access to packets on internal interfaces on the SteelHead. You must use a SPAN or TAP (or other method of aggregating packets) to feed packets to the NetShark-v through the auxiliary or primary network interface.
• Other VSP appliances may impact the performance of the NetShark-v.
If you are deploying the NetShark-v on the SteelHead EX, make sure that the SteelHead in question has sufficient resources (disk, memory, CPU) in the VSP environment to support the NetShark-v. Also make sure that the volume of data coming to the NetShark-v does not exceed its capacity.
The NetShark-v on the SteelHead EX does not have access to the packets traversing within the SteelHead itself. Instead you must use the auxiliary port as a capture port (running in promiscuous mode) and connect an external source of packets to that port. The external source of packets can be a SPAN from another device, a TAP from a link, or some other source.
For more details, see
Port Mirroring and SPAN.
Deploying the NetExpress
The NetExpress is the ideal solution for a small enterprise looking for an advanced monitoring solution. The NetExpress has the following primary deployment scenarios:
• Acting as a standalone system for smaller network environments
• Integrated as part of a broader system that provides narrower views of portions of a larger network
Standalone Deployment
The NetExpress, both the physical appliance and virtual edition, is designed to act as a standalone system capable of both receiving network traffic information and providing all the reporting and monitoring functionality expected of NetProfiler solutions. You can achieve this with four 1-Gbps or two 10-Gbps network monitor interfaces for receiving packets and a single 1-Gbps network interface for receiving flow data directly from the flow sources.
The physical location of the NetExpress is extremely important. Generally, you install the NetExpress at a data center, close to the core switching and routing infrastructure. This location creates the shortest connection paths between devices, and provides the most flexible monitoring.
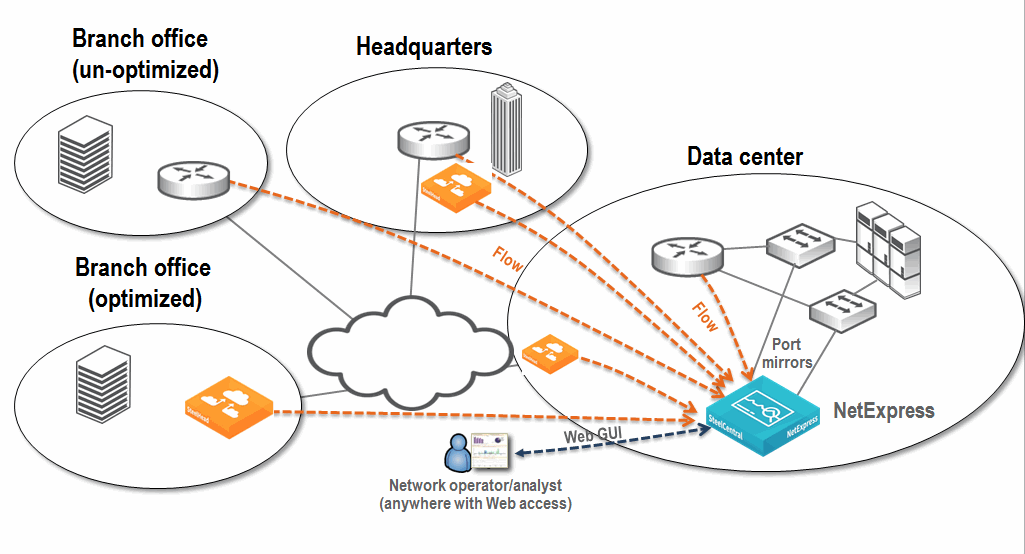
Figure: Example Standalone NetExpress Deployment shows an example of a standalone NetExpress deployment. Flow is collected locally at the data center from routers and SteelHeads, and additional flow is collected from remote sites. There is port mirroring of traffic for critical applications, sent directly to the NetExpress monitoring ports.
Figure: Example Standalone NetExpress Deployment

Integrated Deployment
When you deploy the NetExpress as an integrated deployment, consider what portions of the network you want visible. There are a few ways to restrict visibility directly within the NetProfiler, but you can use the NetExpress to more effectively simulate restricted visibility.
The NetExpress receives data directly from certain sources—through built-in or virtual monitoring ports and direct flow reception—and can forward certain data to other NetProfilers. Because of this, you can use the NetExpress to limit the view to a subset of the network and still feed a larger system to provide a full view.
When you deploy a NetExpress with a limited view, make sure that the NetExpress supports the required flow rate for the covered area. The largest NetExpress has a limit of 120,000 deduplicated flows per minute, and it can be quickly overwhelmed by larger deployments. For example, using an estimate of 40 fpm per host, 120,000 deduplicated flows should provide coverage for a network consisting of roughly 2,400 hosts; flows over 120,000 are dropped and you cannot specify which flows are kept and which are dropped.
An approximation of how much traffic a host can generate on a per-minute basis for internal communications is 50 fpm per host. If the host is also communicating with resources on the internet, then the number of flows generated can be higher.
Consider physical location when you deploy the NetExpress in an integrated environment. The NetExpress provides all the same advanced network metrics as other NetProfilers when deployed correctly. For example, to provide accurate optimized response time, you must deploy the monitoring interfaces between the server-side SteelHead and the servers. If you place the NetExpress in the wrong location (for example, between the client-side SteelHead and the clients), you can prevent accurate collection and calculation of these values.
If you install the NetExpress in close proximity to the data center, and do not plan appropriately, you can lose visibility into other important areas of the network. If the data center is in one physical location but you are going to use the NetExpress to monitor a separate physical location, you have to choose between not having local visibility or not having certain information available. You can avoid this issue by deploying an additional component, such as the NetShark.
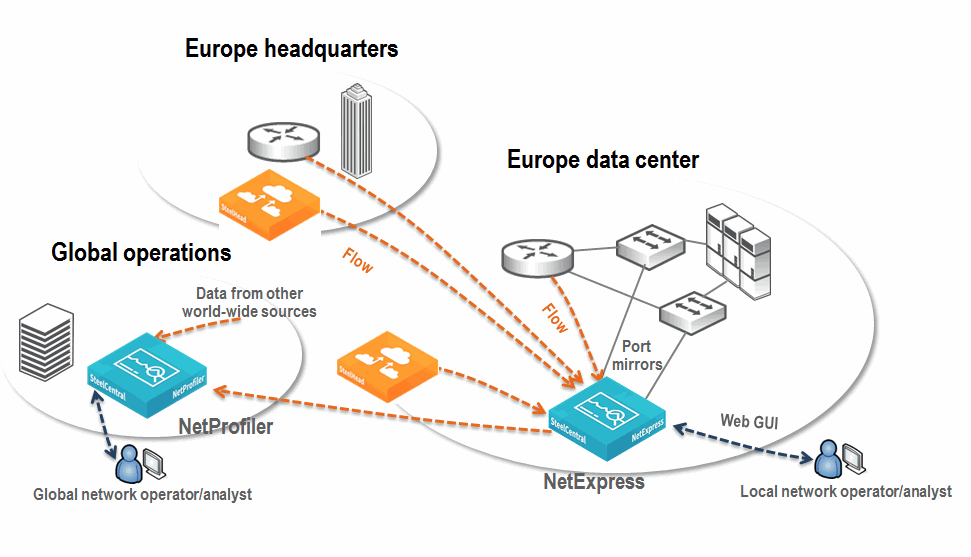
Figure: Example NetExpress in a Larger Deployment Environment shows the NetExpress as part of a larger deployment that includes a Standard NetProfiler. This example shows that the local network operator monitors all traffic on the NetExpress and can configure local policies and local service dashboards. The data received by the NetExpress is also sent to a global NetProfiler. Collection from other sources by the global NetProfiler is not shown.
Figure: Example NetExpress in a Larger Deployment Environment

Deploying the Standard NetProfiler and Flow Gateway
This deployment is useful if you have an environment that encompasses from several thousand to tens of thousands of hosts in several different physical locations. The primary objective of this deployment is to provide visibility into what is happening on the network from a very high level.
Because the primary objective is to provide basic network visibility, you do not need the NetShark to provide network performance information and Layer-7 application identification information. You can deploy only the NetProfiler and the Flow Gateway to detect what hosts communicate with what other hosts during what time periods.
This scenario requires you to collect data from routers, switches, SteelHeads, and other sources of flow information. Flow data is forwarded to a NetProfiler through one or more Flow Gateways for analysis and reporting. While there are no limitations on the distance between physical devices, network and bandwidth requirements might impact placement decisions.
When deploying the Flow Gateway and Standard NetProfiler, you have a choice between physical and virtual appliances. The Standard NetProfiler physical version supports up to 1,000,000 fpm and the virtual version supports up to 2,000,000 fpm. Because the virtual NetProfiler supports significantly more flows per minute then the physical appliance, there are many scenarios in which deploying the virtual version can make more sense. Be sure to confirm you have sufficient resources on your VMware ESXi host for the level of NetProfiler you choose. Running a NetProfiler-v with insufficient resources might cause a variety of different issues.
The virtual and physical Flow Gateway both support the same number of flows, up to 2,000,000 fpm, so the choice between the virtual and physical versions is less important. As with the NetProfiler-v, if you choose a Flow Gateway-v, make sure you have sufficient resources on the ESXi host to support the required flows per minute.
Answer the following questions to decide between physical and virtual appliances:
• Do you have sufficient ESXi 5.0, 5.1, or 5.5 infrastructure available to support the NetProfiler and Flow Gateway deployments?
• Do you expect to need more than 1,000,000 fpm on the Standard NetProfiler or 2,000,000 fpm on the virtual NetProfiler in the near future?
• Is your virtual infrastructure located close enough to the flow sources so that you will not send excess data across the WAN?
If you have multiple data centers and are using server virtualization, you can use the NetProfiler and Flow Gateway as tools to show you which clients are using which servers and where those clients are located. You can optionally look within a software defined network carrying traffic between your virtual servers and data centers. If you are using QoS on SteelHeads, you can configure bandwidth to be properly allocated and used in the most efficient manner. You can also monitor your WAN links to ensure that you have sufficient bandwidth for high-traffic times of the day by looking at real-time performance and historical information.
For more information about QoS, see
Configuring Riverbed QoS Integration.
If your organization has multiple physical locations that are not connected with high amounts of bandwidth (such as a branch connected to a main office through a DSL line), Riverbed recommends that you deploy multiple Flow Gateways throughout the enterprise, with one at each location you want to monitor. Due to concerns about native flow data being sent across a WAN, placing a Flow Gateway at locations with sufficient traffic makes sense if the location warrants monitoring in the first place. A small Flow Gateway or Flow Gateway-v can support up to thousands of hosts (reporting devices).
If you host your data center in a location that is not populated with employees, it might make sense to place your Flow Gateway at this site. The data you capture at the data center, even though there are few local employees, is often critical from a monitoring perspective. If there is small amounts of additional data that you want to monitor that does not warrant an additional Flow Gateway, you can send that data across the WAN.
When deciding where to deploy the Flow Gateway, consider the location of the two sides of the conversations you want to monitor. If the traffic is between remote clients and servers in a single data center, then you might not need to place the Flow Gateway at the remote office or send flow data from the remote office to a Flow Gateway in the data center. Because all critical traffic traverses the data center, a single Flow Gateway monitoring all the traffic in, out, and within the data center might be sufficient. If you want accurate per-interface statistics, then you might have to deploy additional Flow Gateways at smaller sites to properly gather interface statistics.
You do not have to install the NetProfiler in the data center because the physical location of the NetProfiler is much less important than the position of the Flow Gateway. Because there can still be considerable network traffic generated even after flows are compressed, Riverbed recommends that you install the NetProfiler as close as possible to the largest sources of flow data.
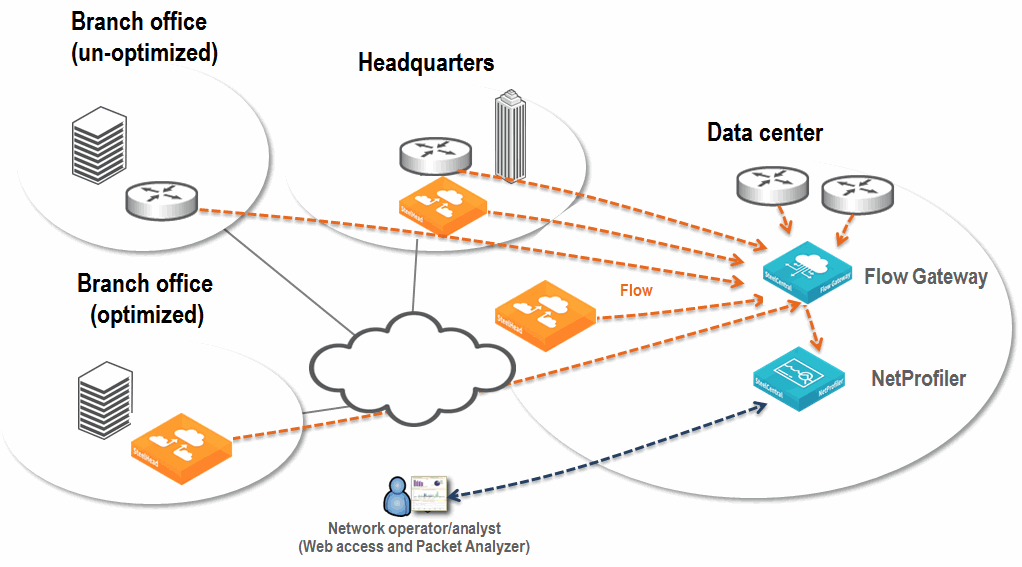
Figure: Example NetProfiler and Flow Gateway Deployment shows an example deployment that includes the NetProfiler and Flow Gateway. All SteelHeads and routers at remote sites, and routers within the data center, send flow data. There are no data flows from smaller sites (not shown in
Figure: Example NetProfiler and Flow Gateway Deployment). Because these much smaller sites primarily communicate back to the data center, traffic detection is based upon collection from the data center routers and SteelHead.
Figure: Example NetProfiler and Flow Gateway Deployment

Deploying the Enterprise NetProfiler and Flow Gateway
For very large environments, the Enterprise NetProfiler provides an expandable solution that can process flows from hundreds of thousands of hosts. The Enterprise NetProfiler provides a robust solution, allowing visibility ranging from a high-level overview, down to the flow level. The Enterprise NetProfiler has a base flow rate of 1,000,000 fpm, and you can add additional modules to support 1,000,000 fpm per module for a maximum supported flow capacity of 10,000,000 fpm, after deduplication. Because flows are stored across multiple expansion units, the amount of disk space for flow storage is increased as capacity increases.
If you have a very large organization, the physical location of the Enterprise NetProfiler becomes less critical. When you have enough traffic for this solution, you have multiple locations that are sending data. If there is a heavy enough concentration of flow in one specific area, it makes sense to install the Enterprise NetProfiler close to this source. In any case, you must locate the Enterprise NetProfiler in an appropriate facility with sufficient bandwidth, power, and cooling.
If you are deploying a very large Enterprise Cluster (consisting of a combination of more than five Analyzer and Expansion modules) you must deploy a separate Dispatcher module. On the Dispatcher module, you have the option of bonding the primary and AUX interfaces into a single channel. This bonding provides double the bandwidth between the Dispatcher module and associated switch (2 Gbps inbound and 2 Gbps outbound). Because of the high volume of data that must be moved between devices (Flow Gateway and NetShark to Enterprise Cluster and between modules on the Enterprise Cluster) Riverbed recommends that you perform this channel bonding.
The most important factor in this deployment is to install the Flow Gateways in the correct locations. The Flow Gateway needs to collect data effectively. Depending on the size of your organization, there are several ways to deploy the Flow Gateway that make sense.
You can deploy fewer, larger-capacity Flow Gateways if the number of data collection points is relatively low and the flow rate at those locations is very high. Fewer, larger-capacity Flow Gateways is a good choice if your organization has one or two large data centers to which all clients connect and where all the collected information is concentrated. If you place one or more large Flow Gateways in a data center, you can collect all the data necessary. With proper placement, the Flow Gateway can detect conversations from the clients in the remote office to servers in the data centers.
When choosing between a physical and virtual Flow Gateway to deploy with an Enterprise NetProfiler, make sure you have sufficient ESXi infrastructure to support the size of the virtual device you deploy—include considerations for future expansion and current needs.
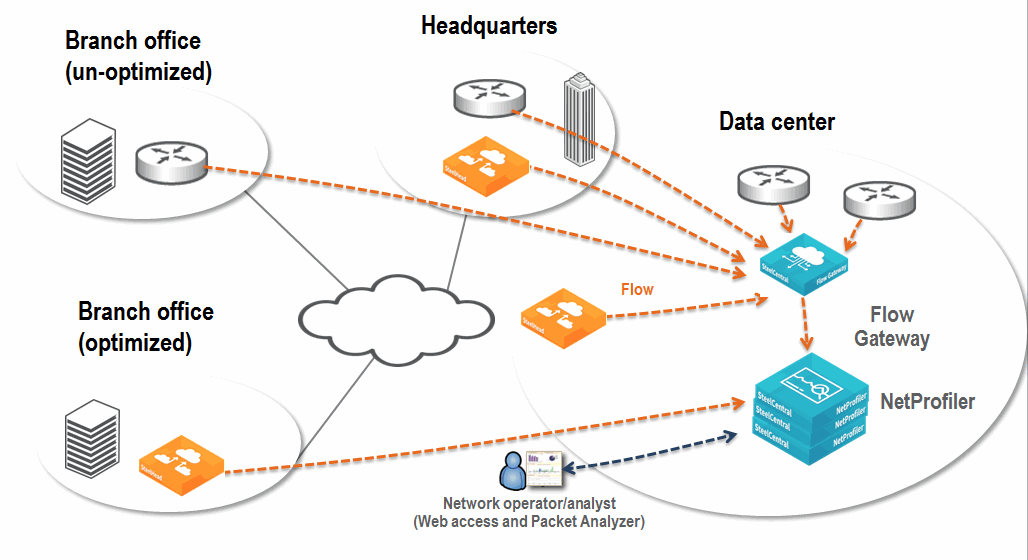
Figure: Example Enterprise NetProfiler and Flow Gateway Deployment shows a Flow Gateway collecting and deduplicating the data flow, then forwarding the flow to the Enterprise NetProfiler. Because this deployment does not require network performance and deep packet analysis, you do not need to install the NetShark. This solution enables you to report, analyze, and troubleshoot traffic across the entire large enterprise network.
Figure: Example Enterprise NetProfiler and Flow Gateway Deployment

Deploying the NetProfiler, Flow Gateway, NetShark, and Packet Analyzer
This scenario expands a standard NetProfiler and Flow Gateway deployment to include a NetShark and Packet Analyzer. The NetShark and Packet Analyzer enable you to:
• see network performance data (response time, server delay, and so on) and TCP health information (TCP retransmission).
• detect Layer-7 DPI application information identifying the applications running on the network, independent of ports and protocols in use.
• drill-down from the high-level view provided by the NetProfiler to successively lower-level views until you reach the packet-level view.
When you deploy NetShark you can choose between a physical and virtual appliance. The following questions can help you decide:
• Do you have sufficient ESXi or Hyper-V infrastructure to properly deploy a NetShark-v?
• Do you need more than 2 TB of packet storage?
The physical location of the NetShark is extremely important. The NetShark provides extensive packet capture and analysis capabilities. You must place the device in a location where it receives the maximum amount of critical traffic.
You must decide what information you want to monitor before you decide where to place the NetShark. If you have a single data center and the traffic to and from that data center is the most critical, you should place the NetShark so it can monitor the critical links or VLANs in the data center. However, if your servers contain critical data and are located in a special area (outside the traditional corporate data center), then you might want to place the NetShark in this area. For more information about various methods of collecting packet data, see
Packet Collection for SteelCentral.
As a best practice, Riverbed does not recommend that you use a NetShark to monitor a WAN, unless you want packet-level visibility into the WAN link. The routers or SteelHeads on either end of the link are likely to provide flow data that includes link use information down to the level of the individual conversations.
For performance reasons, you might need to limit the amount of data sent to a NetShark. A data center at a medium-size organization can easily exceed 10 Gpbs, which exceeds the write-to-disk capabilities of the NetShark.
The NetShark provides the following ways to monitor the appropriate traffic:
• Physical - Collecting packets by using SPAN, port mirroring, and TAP on only the desired links
• Virtual - Selecting only those specific packets that you want to monitor using the built-in filtering capabilities
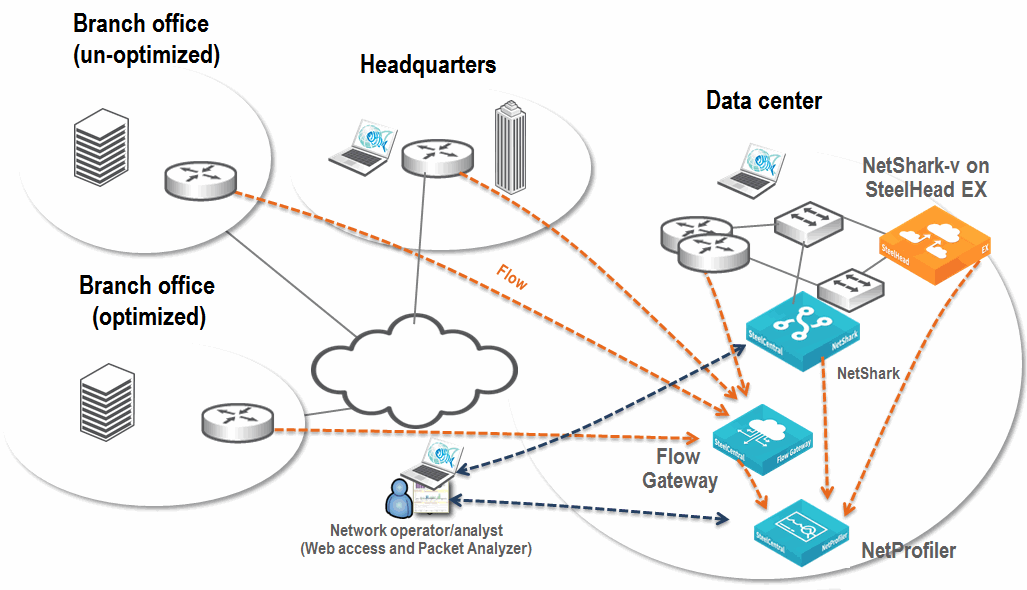
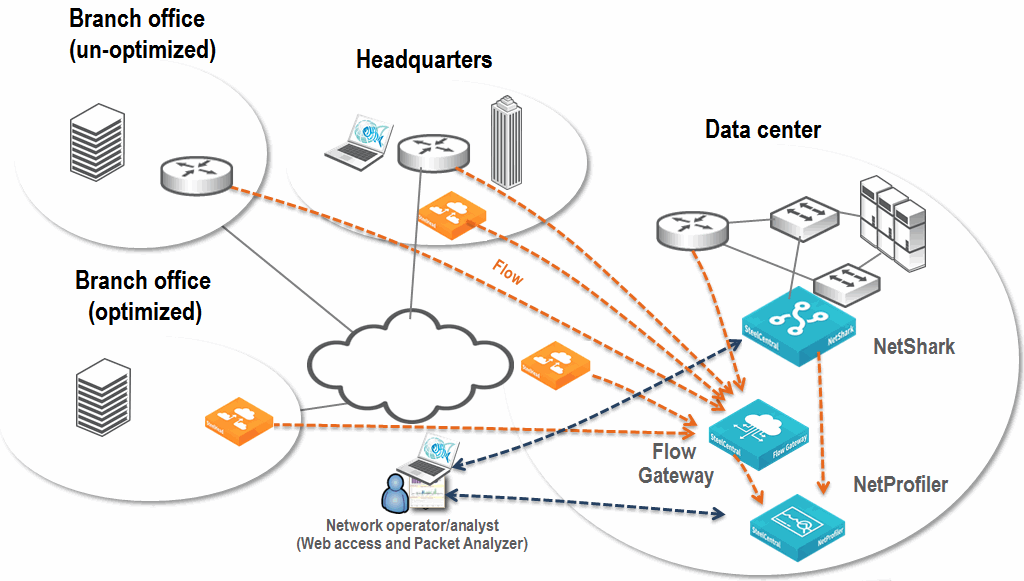
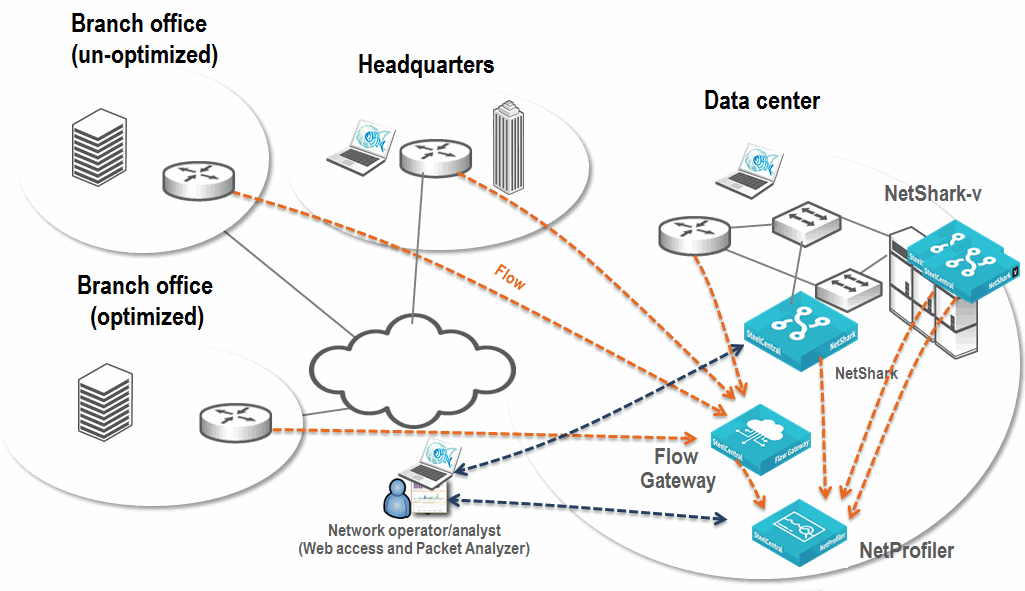
Figure: Example NetProfiler, Flow Gateway, NetShark, and Packet Analyzer Deployment shows an example deployment that includes a NetProfiler, Flow Gateway, a NetShark, and Packet Analyzer. Routers and SteelHeads send flow data across the network to the Flow Gateway and provide wide visibility into the network. A NetShark sits off of switches in the data center and collects packets for deeper visibility. Flow data from the NetShark merges with all other flow data collected by the NetProfiler. You can log in to the NetProfiler to view applications flowing across the entire network. When troubleshooting, if you need deeper packet-level analysis, the NetProfiler Management Console automatically launches Packet Analyzer. This configuration takes you from the NetProfiler view of flow data directly into Packet Analyzer views of packet data.
Figure: Example NetProfiler, Flow Gateway, NetShark, and Packet Analyzer Deployment

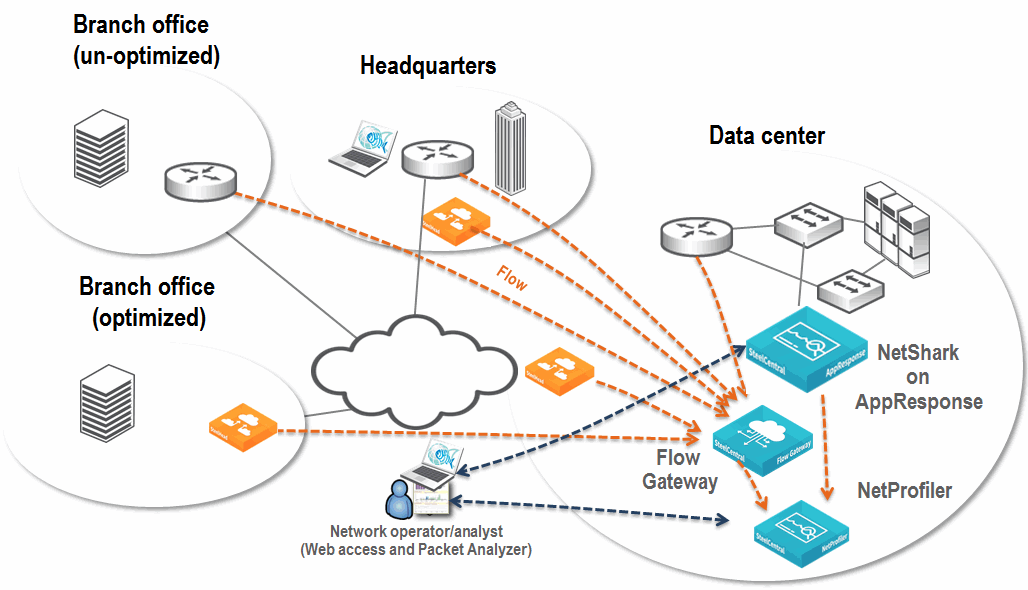
Deploying the NetProfiler, Flow Gateway, and NetShark on AppResponse
This deployment expands upon the NetProfiler deployment described in
Deploying the NetProfiler, Flow Gateway, NetShark, and Packet Analyzer. When you add an AppResponse with a NetShark to the deployment, you gain a number of benefits. These include:
• Deep packet level visibility the NetShark provides to the NetProfiler
• Access to the packets detected by the AppResponse including the expansive storage options
• Ability to drill down from the NetProfiler to the AppResponse
• Functionality of the AppResponse
When deploying the AppResponse with the NetShark and the NetProfiler, you have an extremely powerful network and application troubleshooting tool.
Figure: Example NetProfiler, Flow Gateway, and NetShark on AppResponse Deployment

Deploying the NetProfiler, Flow Gateway, NetShark, NetShark-v, and Packet Analyzer
This deployment expands upon the NetProfiler deployment described in
Deploying the NetProfiler, Flow Gateway, NetShark, and Packet Analyzer. By adding the NetShark-v, you add visibility into the physical network, and you have visibility into the relationship between virtual machines hosted on an ESXi platform in the virtual environment.
Figure: Example NetProfiler, Flow Gateway, NetShark, NetShark-v, and Packet Analyzer Deployment shows an example deployment that includes the NetProfiler, Flow Gateway, NetShark, NetShark-v, and Packet Analyzer. Deploy the NetShark-v on each ESXi platform in which you want visibility. Metrics are sent from within the virtual environment to the NetProfiler. Using Packet Analyzer, you can also perform packet analysis.
Figure: Example NetProfiler, Flow Gateway, NetShark, NetShark-v, and Packet Analyzer Deployment

Deploying the NetProfiler, Flow Gateway, NetShark, and NetShark-v on the SteelHead EX
This deployment expands upon the NetProfiler deployment described in
Deploying the NetProfiler, Flow Gateway, NetShark, and Packet Analyzer. When deploying the NetShark on the SteelHead EX as part of an overall deployment, you might want to deploy the NetShark-v if any of the following conditions are true:
• You do not have an existing VMware ESXi infrastructure.
• The location does not warrant a full NetShark appliance.
• You need visibility at a packet level.
• You have, or are planning to, deploy the SteelHead EX
By deploying NetShark on the SteelHead EX, you gain the flexibility and visibility that NetShark provides while leveraging the benefit of existing hardware and avoiding the expense and complexity of deploying a physical appliance.
Figure: Example NetProfiler, Flow Gateway, NetShark, NetShark-v, and SteelHead EX Deployment
