SteelHead and AppResponse Integration
This chapter provides a high-level overview of the SteelHead and AppResponse. It includes the following sections:
This chapter assumes you are familiar with the AppResponse documentation listed on the Riverbed Support site, at
https://support.riverbed.com/content/support/software/steelcentral-npm/appresponse-appliance.html.
Note: You must be running AppResponse 9.5 or later with RiOS 9.0 or later.
Overview of SteelHead and AppResponse integration
AppResponse provides real-time visibility of more than 60 TCP/IP metrics for each IP flow conversation between a client and server, using passive, IP flow-based monitoring. You typically deploy AppResponse in a data center and configure the appliance to use a network SPAN or tap that exposes it to IP traffic.
Prior to AppResponse 9.5, metrics from WAN-optimized network environments—such as SteelHead—were less reliable due to the acceleration and IP address translation that can occur when they pass through WAN-acceleration devices. AppResponse 9.5 or later communicates with SteelHeads running RiOS 9.0 or later that includes a Web Transaction Analysis (WTA) engine that provides extensive real-time monitoring and analysis of web applications.
You can view detailed data on all page views observed: response times for individual pages and objects (broken down by server versus network delays), slow pages, optimized versus nonoptimized content, user counts, view rates, page views by geographic region, HTTP response codes, and so on. SteelHeads and AppResponse use the following process:
1. The SteelHead collects HTTP payload data and time stamps for the web objects it optimizes.
2. The SteelHead transfers the data to AppResponse (called SteelFlow WTA) through the REST API.
3. The WTA process in AppResponse coalesces the data into page views and then calculates metrics.
AppResponse can identify:
• the components of delay (network, server, client).
• the components that are accelerated.
• how well the components performed when rendered on the desktop device of the client.
This unique capability enables network and application engineers to accurately identify what is the source of traffic congestion when a user is viewing web pages at a data center or a cloud-hosted environment. Using AppResponse helps you to understand the positive impact the SteelHeads are having in their environment.
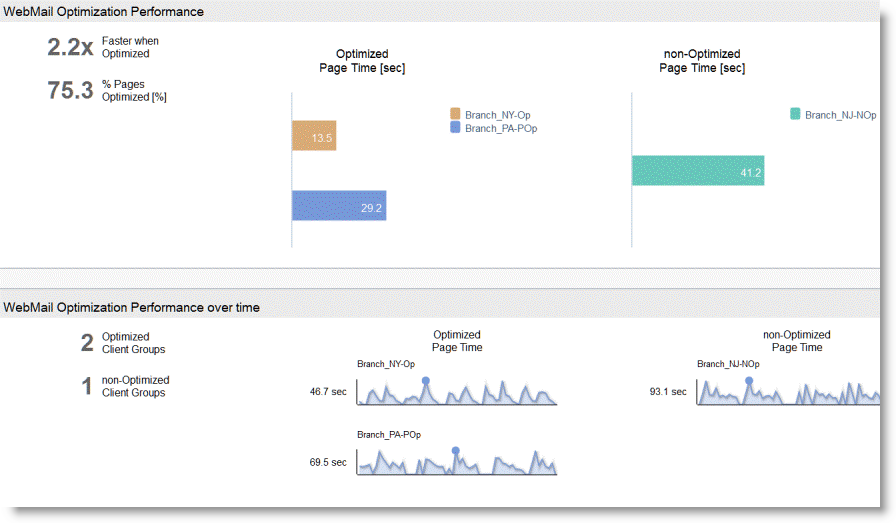
Figure: Remote site WebMail performance shows, on two different AppResponse reports, how you can identify what remote sites are benefiting the most from optimization and what performance they are receiving on average (Choose Quick Views > My SteelHeads > Top Optimized vs non-Optimized Client Groups for my Web App, and then select an application.)
Figure: Remote site WebMail performance
When you configure AppResponse and SteelHead to work together, you can extend the visibility of WTA from the data center to branch offices. You can evaluate the effects of SteelHead optimization of web pages between your data center and branch offices and between branch offices and cloud servers. Specifically you can:
• quantify end-user experience of your web applications at branch offices.
• compare branch office web application response times to each other.
• compare optimized branch office web application response time to each other.
• compare end-user experience in nonoptimized branch offices to optimized ones.
• compare user experience over time.
• measure optimization performance for business-critical applications.
• monitor and evaluate the performance of SaaS applications such as Salesforce.com.
• quickly identify web applications, pages, objects, sites, and users with high response times.
• break down HTTP response times into network versus application delays for specific pages, objects, and applications.
• tell how many users per site using this application (helps to find application adoption).
• tell what are the devices they are accessing application from (Windows, Mac).
• tell what are the browser type or versions.
• tell who are the top users.
• tell what are the slowest pages.
• tell what is the average user experience in terms of page load time.
• detect any bottlenecks
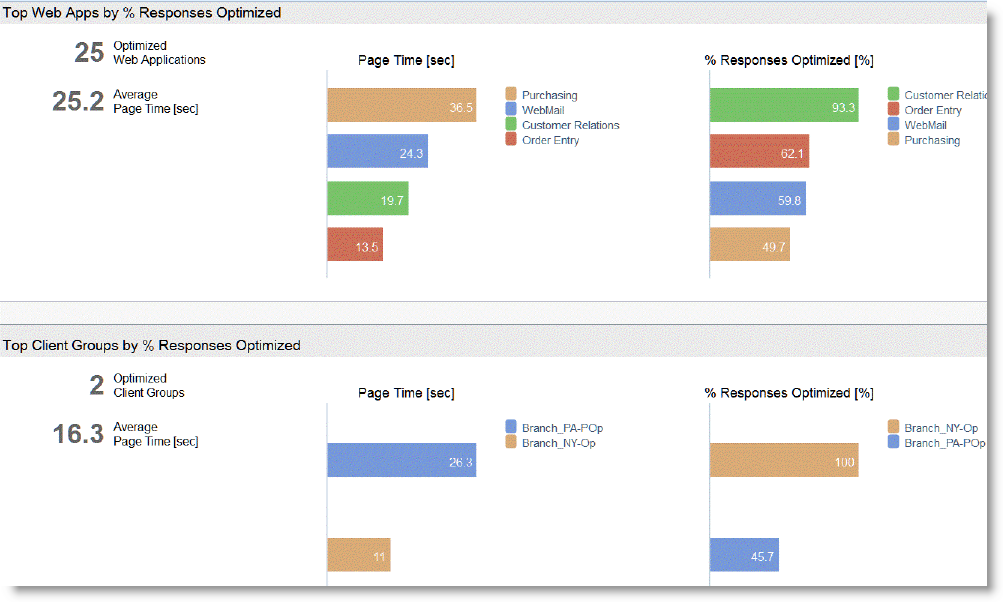
Figure: Optimization benefit shows the actual end-user response time on the average for applications that are being optimized, and who is benefiting the most from the optimization. (Choose Quick Views > My SteelHeads > Top Optimized Client Groups and Web Apps.)
Figure: Optimization benefit
AppResponse and SteelHead deployment scenarios
This section describes the deployment scenarios available for AppResponse and SteelHead. It includes the following topics:
Data center deployment
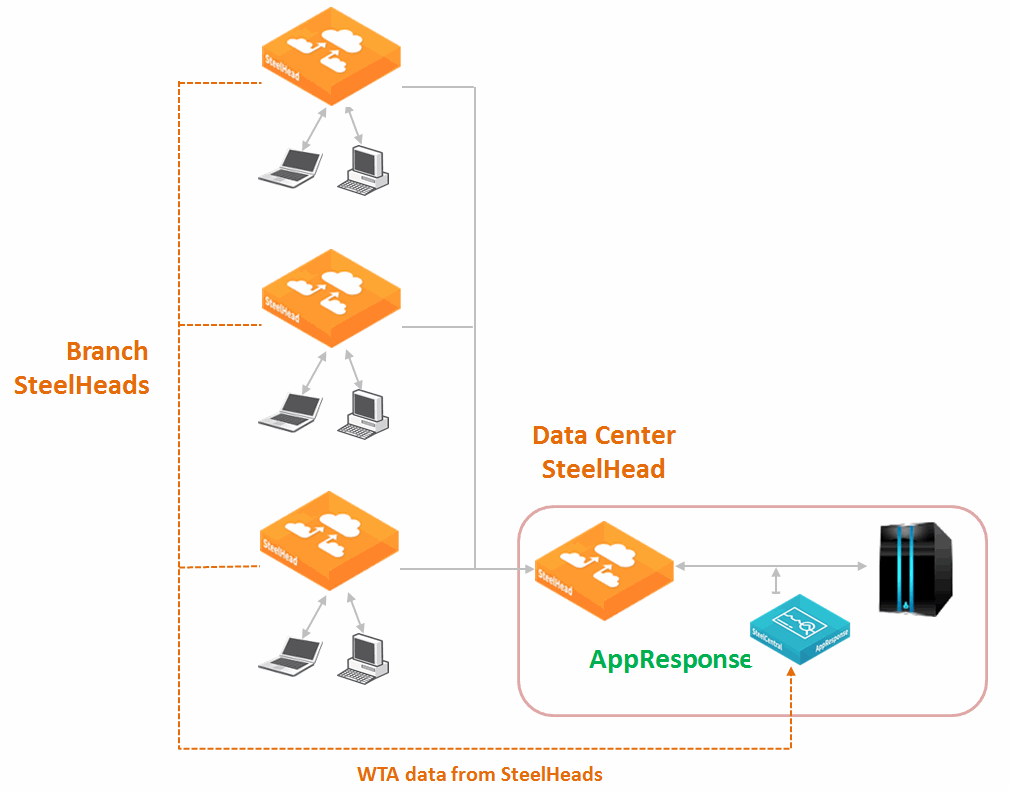
In the data center deployment scenario, AppResponse monitors optimization between branch offices and the data center, with SteelHeads in the data center and branch offices. One AppResponse can communicate with many SteelHeads, while one SteelHead can share SteelFlow WTA records with only one AppResponse.
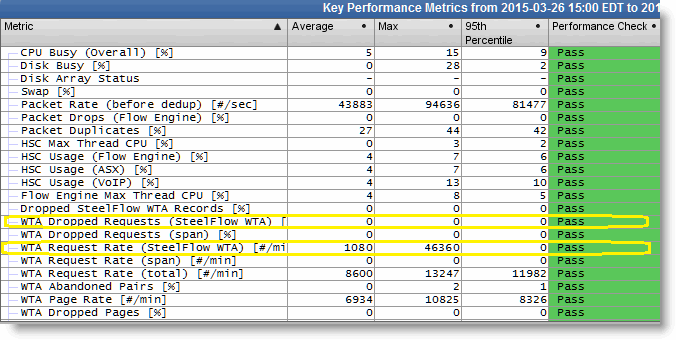
Correct sizing for this configuration can be difficult. You want to fully understand the volume and type of traffic you want to monitor to ensure the AppResponse can efficiently process the traffic sent to it. AppResponse 9.5.2 and later (depending on the size) can receive and process 50,000 to 70,000 SteelFlow WTA records per minute from 1 to N number of SteelHeads. You must check the processing capacity and headroom of each AppResponse as you configure more SteelHeads to send SteelFlow WTA records. This check is performed on AppResponse by using the Appliance Health Check Insight, which indicates pass, fail, or warning for the volume of traffic it receives in each category (
Figure: Key performance metrics).
Figure: Key performance metrics
Design considerations:
• One AppResponse can talk to and receive SteelFlow WTA records from N number of SteelHeads
• A SteelFlow WTA record represents some portion of a client HTTP/HTTPS request-response pair, which is optimized by the SteelHead.
• AppResponse is limited by the aggregate total volume of SteelFlow WTA records received per minute. There is no hard limit number of SteelHeads an AppResponse can talk to.
• The ARX 9.5.2 and 9.0.3 performance tables contain sizing information.
SteelFlow WTA collection is only supported on physical appliances. The smaller appliances can process 50K SteelFlow WTA records per minute and larger appliances can scale up to 70K SteelFlow WTA records per minute.
• We recommend that you add SteelHead and SteelFlow WTA configurations to an existing AppResponse incrementally while monitoring how close the AppResponse is to its maximum SteelFlow WTA processing limit using the Appliance Health Check Insight.
• A SteelFlow WTA record is a record of metrics about an HTTP/HTTPS request/response pair.
A web page GET generates many different requests for content on that page. On average a web page GET generates about 10 to 20 SteelFlow WTA records because 10 to 20 components of the page are requested and the server responds back with the requests.
Figure: Data center deployment shows one AppResponse in the data center, one SteelHead in the data center, and the other SteelHead in the branch office that you want to monitor.
Figure: Data center deployment
Cloud deployment
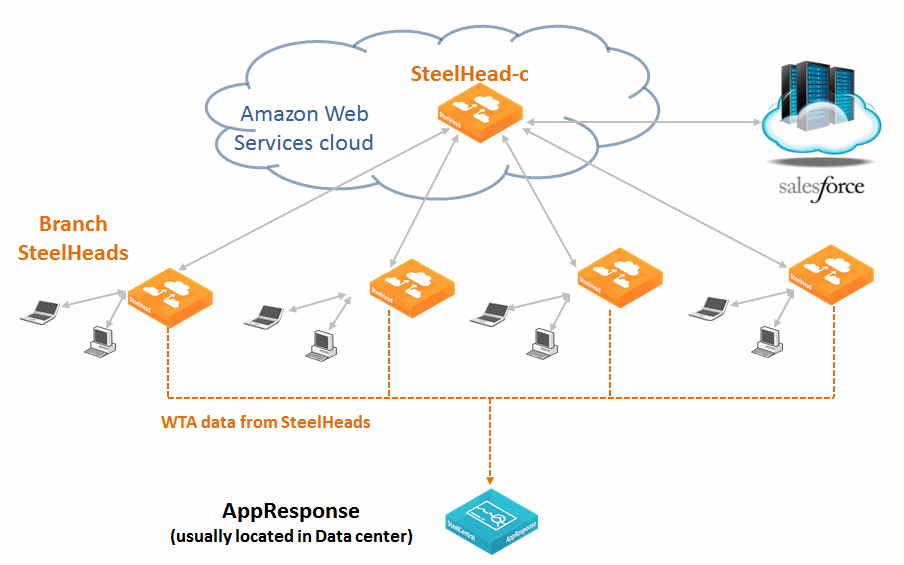
In the cloud deployment scenario, AppResponse monitors optimization between a branch office and a cloud server, with SteelHead-c and a SteelHead CX or EX in the branch offices.
Figure: Cloud deployment shows one AppResponse in the data center, one SteelHead-c in the cloud, and the other SteelHead in the branch offices sending their SteelFlow WTA data records to an AppResponse, usually located in a data center.
Figure: Cloud deployment
