About local and remote logging
Local and remote logging settings are located on the Administration > System Settings: Logging page.
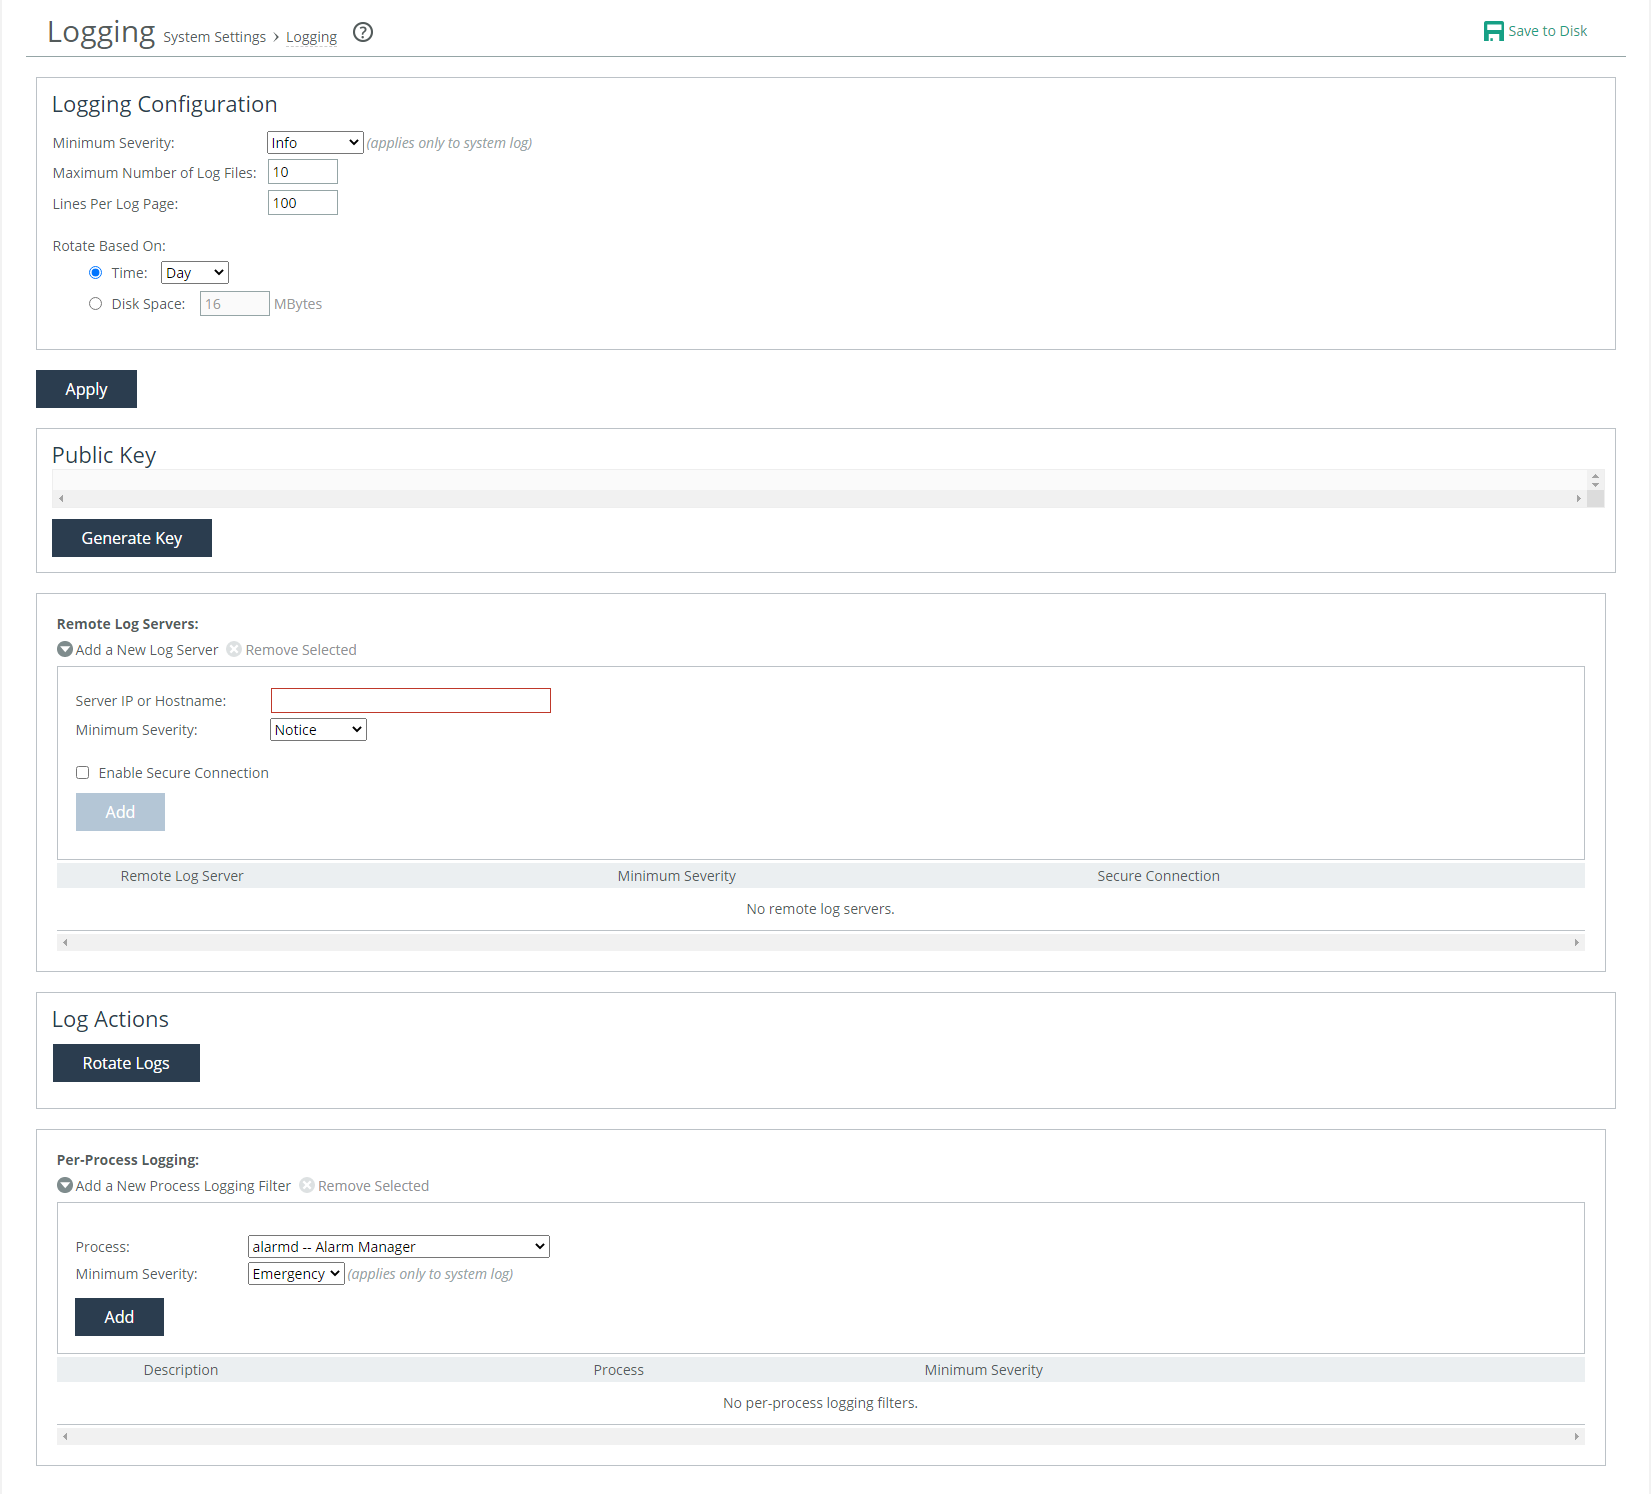
Logging page
By default, the system rotates each log file every 24 hours or when the file size reaches 1 gigabyte uncompressed. You can change this default setting to have the files rotated every week or month, or you can have the files rotated based on file size. The automatic rotation of system logs deletes your oldest log file, labeled as Archived log #10, pushes the current log to Archived log # 1, and starts a new current-day log file. For more details, see
About log rotation.You can send logs to remote log servers. For details, see
About remote logging.About logging configuration settings
Logging configuration settings enable you to specify:
• which messages, by severity level, the system logs.
• the maximum number of log files before the system rotates them and starts a new logging cycle.
• the maximum number of lines per log file.
• whether to rotate logs based on time or disk space.
Minimum severity applies to the system log only. It does not apply to the user log. The minimum severity level determines which kinds of messages the system logs. The system records messages with this severity level and higher in the log files. These levels are available:
• Emergency—Emergency, the system is unusable.
• Alert—Action must be taken immediately.
• Critical—Conditions that affect the functionality of the managed entities.
• Error—Conditions that probably affect the functionality of the managed entities.
• Warning—Conditions that could affect the functionality of the managed entities, such as authentication failures.
• Notice—Normal but significant conditions, such as a configuration change. This is the default setting.
• Info—Informational messages that provide general information about system operations.
Maximum number of log files sets the maximum number of logs to store. The default value is 10.
Lines per log page sets the number of lines per log page. The default value is 100.
Rotate based on sets the rotation schedule. For details about log rotation, see
About log rotation. About log rotation
Rotate based on sets the rotation schedule. You can set logs to rotate based on time or by disk space. Time frequencies are daily, weekly, or monthly, and the default is daily. Rotation based on disk space sets how much disk space, in megabytes, the log can use before triggering rotation, and the default value is 16 MB. Log file size is checked at ten-minute intervals. If there is an unusually large amount of logging activity, it is possible for a log file to grow larger than the set disk space limit in that period of time.
Under Log Actions, you can manually rotate logs. When you manually rotate logs, your archived file #1 contains data for a partial day because you’re writing a new log before the current 24-hour period is complete.
About remote logging
You can send logs to remote log servers. When adding remote servers, you’ll need those servers’ IP addresses. You’ll can also specify the minimum severity to filter which messages are sent. For details, see
About logging configuration settings.About filtering logs by process
You can filter a log by one or more applications or one or more processes. This filtering ability is particularly useful when capturing data at a lower severity level, at which the system might not be able to sustain the flow of logging data the service is committing to disk. These processes are available:
• alarmd—Alarm manager, which processes all alarms, including their thresholds and severity.
• cmcfc—CMC automatic registration utility.
• rgp—SCC connector, which handles SCC appliance communication.
• rgpd—SCC client daemon, the connection manager.
• cli—Command-line interface.
• mgmtd—Device control and management, which directs the entire device management system. It handles message passing between various management daemons, managing system configuration and general application of system configuration on the hardware underneath through the hald.
• hald—Hardware abstraction daemon, which handles access to the hardware.
• pm—Process manager, which handles launching of internal system daemons and keeps them running.
• sched—Process scheduler, which handles one-time scheduled events.
• statsd—Statistics collector, which handles queries, storage, and trending of system statistics.
• wdt—Watchdog timer, the motherboard watchdog daemon.
• webasd—Web application process, which handles the web user interface.
You can also set the minimum severity. For details, see
About logging configuration settings.