Viewing the Current Connections report
You view the Current Connections report under Networking: Reports > Current Connections.
Current Connections report
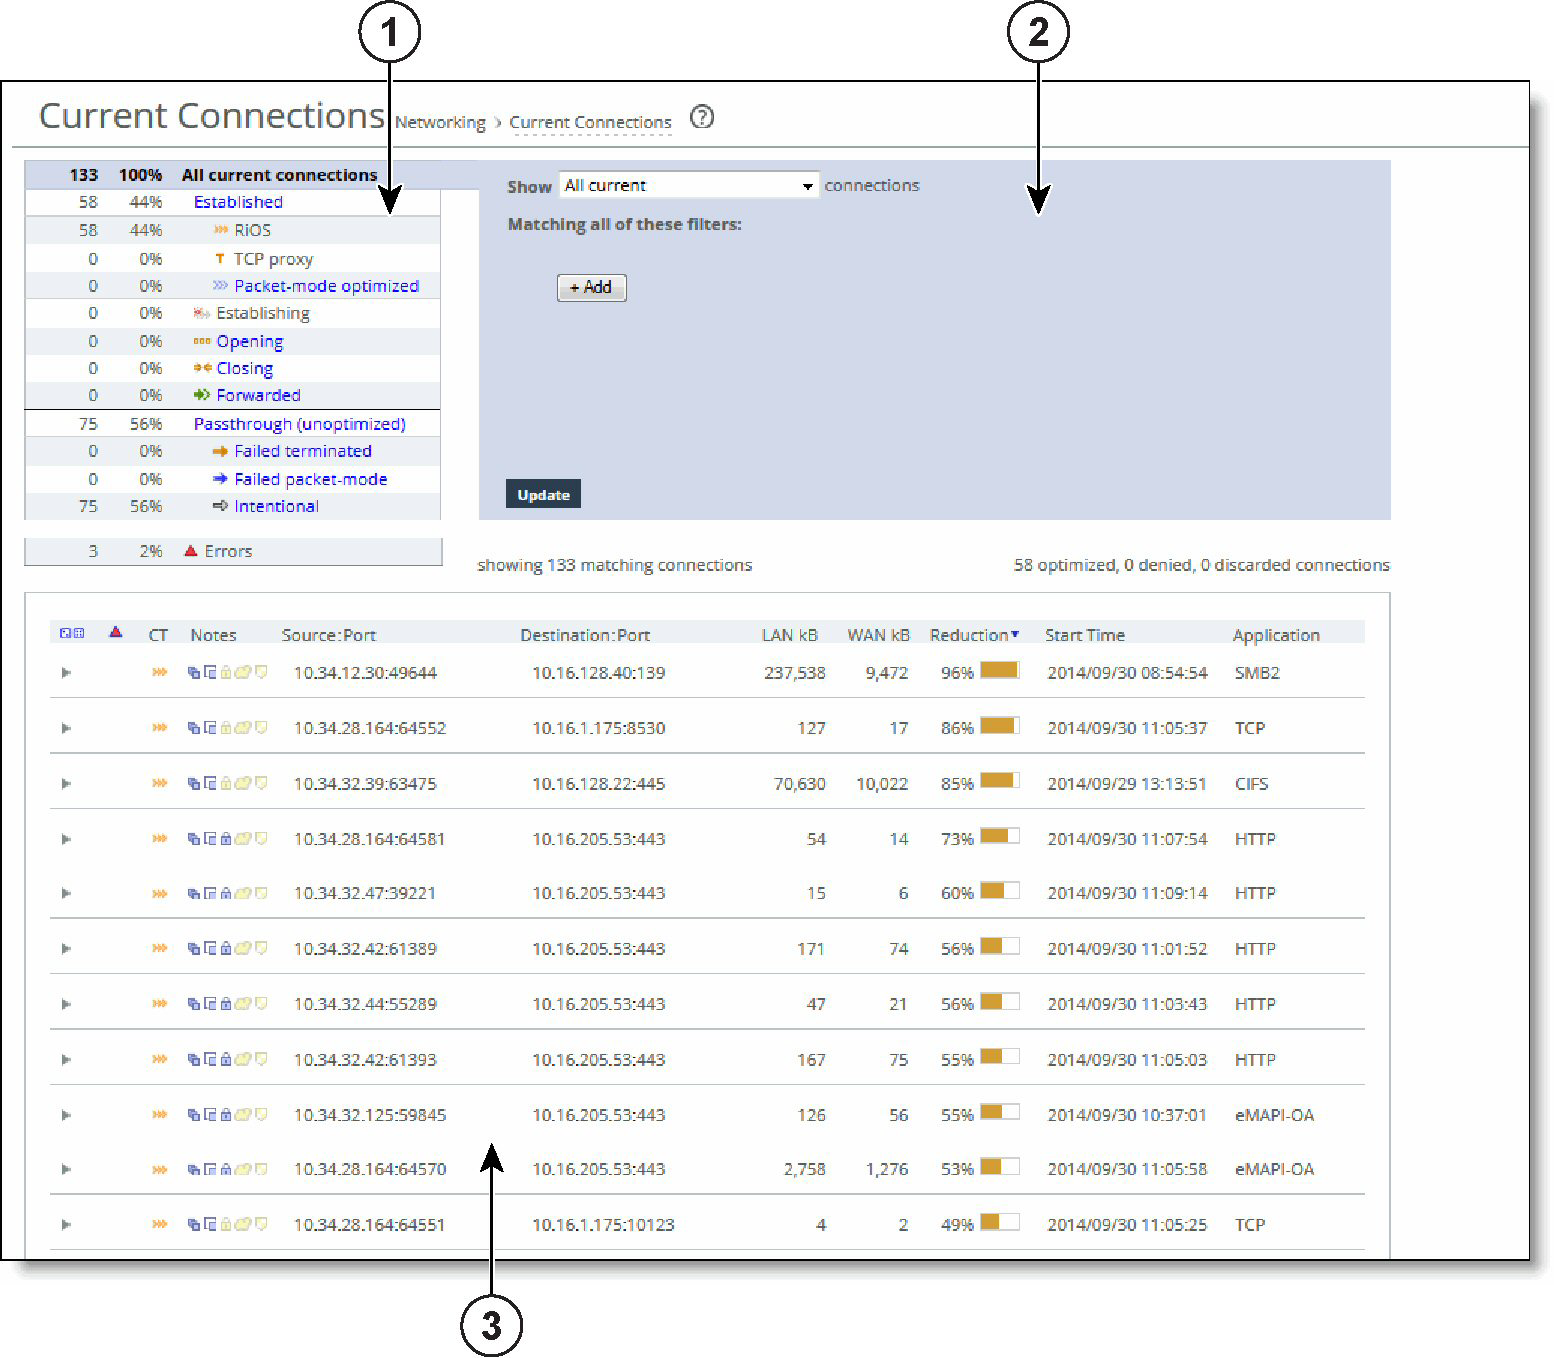
1-Connections summary
The summary gives you an at-a-glance hierarchical overview of the traffic the Edge detects. It displays the total connection numbers for various types of optimization, pass-through, and forwarding. It categorizes the optimized, established connections by type and displays the portion of the total connections each connection type represents.
When you click a connection type such as established, you select it and also drive the show statement in the query area to search for established connections and exclude the other types.
The connections summary displays these connection types:
Connection type | Icon | Description |
|---|
All current connections | | Displays the total number of connections the appliance detects at the time you access the report, refresh the page, or click the Update button. It includes the connections that the appliance is passing through unoptimized, and connections that do not appear in the connections table. |
Established | | Displays the total optimized, active connections. |
| | RiOS—Displays the double-ended, non-SCPS connections. |
| | RiOS + SCPS—Displays the total RiOS and SCPS connections established between two appliances. Because both appliances are SCPS compatible, this is a double-ended connection that benefits from traditional RiOS optimization (SDR and LZ). |
| | SCPS—Displays all current single-ended SCPS-optimized connections as a portion of the total. |
| | TCP proxy—Displays the total non-SCPS single-ended interception connections. An SEI connection is established between a single appliance paired with a third-party device running TCP-PEP (Performance Enhancing Proxy). |
| | Packet-mode optimized—Displays the total flows that were optimized packet-by-packet with SDR bandwidth optimization. These include TCP and UDP flows over IPv4 or IPv6. Packet-mode flows are considered to be neither single-ended nor double-ended. You must enable path selection and packet-mode optimization to view optimized UDP flows. To enable path selection, choose Networking > Network Services: Path Selection. |
Establishing | | Displays the total newly forming, initiating connections. The connection is being established but does not yet have an inner channel. Establishing connections count toward the connection count limit on the appliance because, at any time, they might become a fully opened connection. |
Opening | | Displays the total half-open active connections. A half-open connection is a TCP connection in which the connection has not been fully established. Half-open connections count toward the connection count limit on the appliance because, at any time, they might become a fully opened connection. If you are experiencing a large number of half-open connections, consider a more appropriately sized appliance. |
Closing | | Displays the total half-closed active connections. Half-closed connections are connections that the appliance has intercepted and optimized but are in the process of becoming disconnected. These connections count toward the connection count limit on the appliance. (Half-closed connections might remain if the client or server does not close its connections cleanly.) If you are experiencing a large number of half-closed connections, consider a more appropriately sized appliance. |
Forwarded | | Displays the total number of connections that were forwarded when you have configured a connection-forwarding neighbor to manage the connection. For details about connection forwarding, see Configuring connection forwarding features. |
Passthrough (unoptimized) | | Displays the total number of connections that were passed through unoptimized. You can view and sort these connections by intentional and unintentional pass-through in the connections table that follows this summary. |
| | Failed terminated—Displays the total number of terminated connections that were passed through unoptimized, because of reasons other than in-path rules. |
| | Failed packet-mode—Displays the total number of packet-mode flows that were passed through unoptimized, because of reasons other than in-path rules. You must enable path selection or packet-mode optimization or both to view pass-through UDP flows. To enable path selection, choose Networking > Network Services: Path Selection. |
| | Intentional—Displays the total number of connections that were intentionally passed through unoptimized by in-path rules. |
Errors | | Displays all connections that have application or transport protocol errors as a portion of the total connections. |
2-Query area
The connections summary and the connections table convey a lot of information about connections the appliance is detecting. The best way to narrow your search is to filter and sort the report. The query area is where you select a simple or compound connection type for your search and optionally filter the results. The Show search control defines the contents of the connection summary and the connections table.
The simple connection search uses a match against a connection type to display only that type, and excludes the others. If you want to use more advanced criteria, such as including all connections that were started after a certain date, you can add one or more filters to achieve this.
Displaying a simple connection type
After Show, select a connection type from the drop-down list:
All current
Displays the total number of connections the appliance detects, including the connections that are passed through unoptimized. This selection removes any previous selections or filters.
Established
Displays the total optimized, active connections.
Packet-mode optimized
Displays the total connections that were optimized packet-by-packet with SDR bandwidth optimization. These connections include TCP IPv4, TCP IPv6, UDP IPv4, and UDP IPv6 connections.
You must enable path selection and packet-mode optimization to view optimized UDP flows. To enable path selection, choose Networking > Network Services: Path Selection.
Opening
Displays the total half-open active connections. A half-open connection is a TCP connection in which the connection has not been fully established. Half-open connections count toward the connection count limit on the appliance because, at any time, they might become a fully opened connection.
If you are experiencing a large number of half-open connections, consider a more appropriately sized appliance.
Closing
Displays the total half-closed active connections. Half-closed connections are connections that the appliance has intercepted and optimized but are in the process of becoming disconnected. These connections are counted toward the connection count limit on the appliance. (Half-closed connections might remain if the client or server does not close its connections cleanly.)
If you are experiencing a large number of half-closed connections, consider a more appropriately sized appliance.
Forwarded
Displays the total number of connections forwarded by the connection-forwarding neighbor managing the connection.
Passthrough (unoptimized)
Displays the total number of connections that were passed through unoptimized. You can view and sort these connections by intentional and unintentional pass-through in the individual connections table that follows the connections summary.
Failed terminated
Displays the total number of terminated connections that were passed through unoptimized.
Failed packet-mode
Displays the total number of packet-mode flows that were passed through unoptimized.
Intentional
Displays the total number of connections that were intentionally passed through unoptimized.
Filtering the connections
Filters provide a powerful way to drill down into large numbers of connections by specifying either simple or complex filter criteria. Each filter further restricts the display.
When you customize filters, the system immediately writes them to disk on the appliance. The system saves all of your custom settings even after you log out, clear your browsing history, or close the browser. When you view the report again, your custom settings are intact. The system saves report settings on a per-user basis.
Filtering the display (optional)
Click Add, and select a filter from the drop-down list. Selecting some filters expands the query with a text input field for additional information. For example, selecting for application from the drop-down list displays a text input field for the application name. RiOS validates the text input fields as you enter the text (except when you enter a regular expression).
You can select any combination of these filters:
• matching regular expression displays a text input field for a regular expression and shows only those connections that match the expression. You can filter based on connections for a specific path selection uplink name by entering the name in this filter.
Examples:
10.16.35.1
Finds one particular IP address
10.16.35.1:5001
Finds port 5001 on one particular IP address
You can also use the regular expression filter to show only those connections for which the expression matches this string:
<source-ip>:<source-port> <destination-ip>:<destination-port> <protocol-name>
where each token in angle brackets is replaced by the connection properties. Use a single space between <source-port> and <destination-ip> and between <destination-port> <protocol-name>.
RiOS does not validate the expression. A regular expression can contain special characters and embedded spaces that are unique to the regular expression syntax. For details, see The Gnu Awk User's Guide.
The filter matches only against the source, destination, and application name. It does not consider start times, reduction, and byte counts.
The filter separates IP addresses and ports with a colon for matching:
x.x.x.x:p for IPv4
[xxxx:xxxx::xxxx]:p for IPv6
Uppercase and lowercase do not matter (“mapi” matches MAPI, MAPI-ENCRYPT, and any other application containing MAPI).
A connection matches if the match string occurs anywhere within it (that is, a colon (:) matches all rows), unless overridden by special regular expression language such as a caret (^) or a dollar sign ($).
• from source IP address/mask displays a text input field for the IP address and subnet mask. You can specify an IPv4 or an IPv6 IP address.
• from source port displays a text input field for the source port.
• to destination IP address/mask displays a text input field for the IP address and subnet mask. You can specify an IPv4 or an IPv6 IP address.
• to destination port displays a text input field for the destination port.
• that have errors displays connections with either application protocol errors or transport protocol errors.
• for application specifies an application name from the drop-down list. The application filter is only relevant for optimized connections.
• that were started before displays a text input field for the date and time. Use this format: yyyy/mm/dd hh:mm:ss
• that were started after displays a text input field for the date and time. Use this format: yyyy/mm/dd hh:mm:ss
• that are single-ended only displays SCPS and TCP proxy connections. Applies only to established connections.
• that are double-ended only displays RiOS and RiOS + SCPS connections. Applies only to established connections.
To add another filter, click add filter again. You can add up to eight filters; they are logically ANDed together and are all active at any given time. Continue adding filters until your query is complete, then click Update.
3-Connections table
The connections table displays more information about each connection, filtered by the show statement and any filters in the query area. The connections table can show up to 500 connections at a time; it lists the total of all matching connections in the upper-right corner. From this table, you can view more details about each connection and perform operations on it. For example, you can reset connections or send a keep-alive message to the outer remote machine for an optimized connection (the machine that is connected to the appliance).
Connections with IPv6 addresses are split into two rows to accommodate the long address. The report encloses IPv6 addresses in square brackets, and the source address, destination address, and other information appears in different columns.
Icons in the CT and Notes columns indicate the connection type and attributes. Mouse over an icon and reveal a tooltip identifying its meaning.
The individual connections table displays additional information about each connection. Because this report can list hundreds of transient connections, you can sort the table by column heading (except for the Notes column). For example, you can sort the connections by source IP address.
To sort the table by row, click the table column heading. The table contents reload, if necessary. Click the heading again to reverse the order. A small up or down triangle reflects the current bidirectional sort order.
To reset the connection sample, click the dice icon on the far left. The table contents reappear in the original display. For example, if you sort the display by a particular type, and there are more than 500 connections of that type, click the dice icon to return to the original display.
The connections table displays this information:
Column | Icon | Description |
|---|
Connection Details | | Click the connection to display the current connections details. See Viewing the Current Connections report details. Because the details are a snapshot in time, by the time you click the connection, it could be gone or in a different state. If the connection is no longer available, a message tells you that the connection is closed. To refresh the display, click Update. |
| | Protocol Error—Displays a protocol error for both transport and application conditions. This list contains some of the conditions that trigger errors; it is a small subset of possible error conditions: • When the Optimize Connections with Security Signatures feature is enabled (which prevents SMB signing). This is an expected response. For details about preventing SMB signing, see Configuring CIFS optimization. • If a problem occurs while optimizing encrypted MAPI traffic. For details about enabling optimization of encrypted MAPI traffic, see About MAPI optimization. • If a problem occurs with SSL optimization or the secure inner channel. • If a SRDF protocol error occurs when attempting to optimize traffic originating from the LAN side of the appliance. Check the LAN-side Symmetrix array for compatibility. Click the connection for more details about the error. |
CT (Connection Type) | | Established—Indicates that the connection is established and active. |
| | Intentional Passthrough—Indicates that the connection was intentionally passed through unoptimized because of in-path rules. |
| | Failed terminated—Indicates that the connection was passed through unoptimized. |
| | Failed packet-mode—Indicates that the packet-mode flow was passed through unoptimized. |
| | Establishing—Indicates that the connection is initiating and is not yet fully established. The source and destination ports appear as n/a. |
| | Opening (Optimized)—Indicates that the connection is half-open and active. A half-open connection is a TCP connection that has not been fully established. |
| | Closing (Optimized)—Indicates that the connection is half-closed and active. A half-closed connection has been intercepted and optimized by the appliance but is in the process of becoming disconnected. |
| | Forwarded—Indicates that the connection is forwarded by the connection-forwarding neighbor managing the connection. For details about connection forwarding, see Configuring connection forwarding features. |
Notes | | Displays connection icons that indicate the current state of the connection. The connection states can be one of these: |
| | Compression Enabled—Indicates that LZ compression is enabled. |
| | SDR Enabled—Indicates that SDR optimization is enabled. |
| | WAN Encryption Enabled—Indicates that encryption is enabled on the secure inner channel (WAN). For details, see Configuring secure peers. |
| | Cloud Acceleration ON—Indicates that the Cloud acceleration service for SaaS applications is enabled. |
Source:Port | | Displays the connection source IP address and port. |
Destination:Port | | Displays the connection destination IP address and port. |
LAN/kB WAN/kB | | Displays the amount of LAN or WAN throughput, in kilobytes. |
Reduction | | Displays the degree of WAN traffic optimization as a percentage of LAN traffic sent. Higher percentages mean that fewer bytes were sent over the WAN. Red squares indicate that an optimizing connection is currently showing 0 percent data reduction, which might be caused by multiple scenarios. Typically, 0 percent data reduction occurs when the system is optimizing a session containing encrypted payload. You can set up an in-path pass-through rule to prevent the system from interception the connection for optimization. |
Start Time | | Displays the time that the connection was started. This column does not apply to preexisting connections. Select the column heading to sort data start time in ascending or descending order. |
Application | | Displays the application associated with the connection: for example: TCP, CIFS, MAPI, eMAPI-OA (encrypted MAPI Outlook Anywhere), or HTTP. When Application Visibility is enabled (the default), the table displays the hierarchical, DPI-based application name (for example, HTTP > Facebook), instead of just the port-based name (for example, HTTP). When you expand a connection, a new Application row displays the hierarchical name, when available, or the port-based name if not. (For newly formed connections, the application name might have changed from what was reported in the table). Application visibility gives you a better sense of what applications are running instead of just seeing traffic through port numbers or web traffic classified as generic HTTP. |


