Troubleshooting
Support package
What is a support package?
A support package offers appliance status information in a single JavaScript Object Notation (JSON) file that you can view in SCM or download.
To generate a support package
1. Choose Appliances.
2. Select an appliance.
You can’t generate a support package for SDI-5030 gateways.
3. Click Live or select the Debug tab.
4. Click (Re-)Request to generate a support package.
The Event log reports the request for a support package.
After the support package is generated, you can view it in SCM or download it as a JSON file. The package is categorized by diagnostic commands and categories. From SCM you can collapse or expand the output for each command or category.
Requesting another support package overwrites any previous support package output.
To view a specific support package category without downloading the JSON file
1. If you requested a support package from the Live tab, select the Debug tab.
The Debug tab
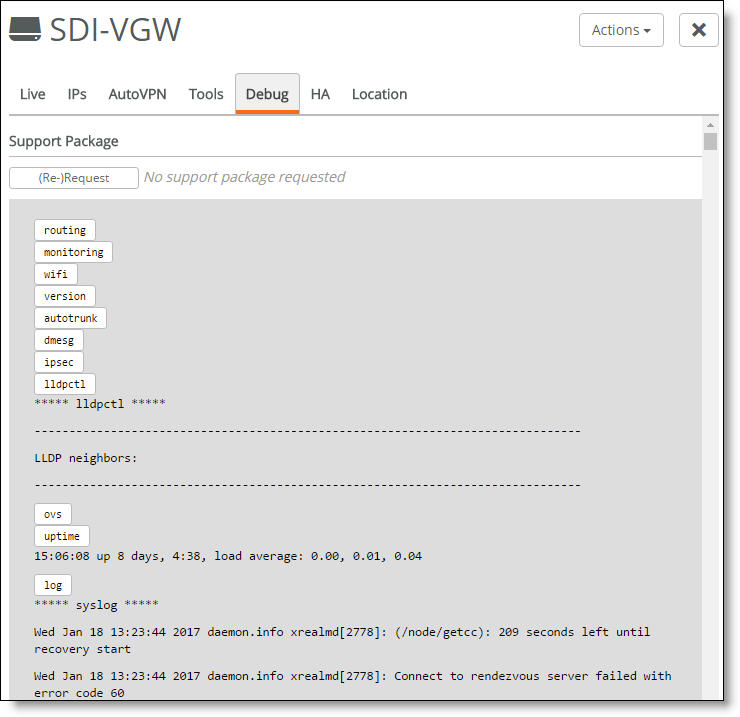
Tip: You can copy and paste the output from the Debug tab for use in another application.
2. Click a category to filter the output.
Category | Description |
routing | Shows the current IP routing table. |
monitoring | Shows the results from system monitoring, such as uplink configuration. |
wifi | Shows the WiFi status, such as whether an SSID is broadcasting, and includes information about wireless interfaces. |
swconfig | Shows the appliance software configuration and status. |
version | Shows the current firmware version. |
autotrunk | Shows the interconnected trunking between two gateways. |
dmesg | Shows the message buffer of the kernel. The output of this command contains the messages produced by the device drivers. |
ipsec | Shows the IPSec encryption tunnel status, including endpoints, virtual IP pools, the IKE daemon status, and more. |
iptables | Shows the filter table rules in place to allow and block traffic and the network address translation (NAT) table rules in place to rewrite packets, allowing NAT. Includes the chain prerouting, input, output, and post routing. |
ifconfig | Shows the appliance interface(s) information, such as configuration, packets received and transmitted, statistics, and status. |
qos | Shows the Quality of Service (QoS) statistics. |
lldpctl | Shows information about the Link Layer Discovery Protocol. |
ovs | Shows the current state of an OpenFlow switch, including features, configurations, table entries, and the configuration database entries. |
uptime | Shows the system uptime in 24-hour format, a timeframe of how long the system has been running, and the average system load. For the system load output, translate the two decimal points as a percentage. For example, 0.25 means 25% and 0.19 means 19%. The sequence 0.25, 0.25, 0.19 represents the load over the past 1 minute, 5 minutes, and 15 minutes. Lower numbers mean better system performance. |
processes | Shows the current running processes. |
log | Shows the last 1000 entries of the appliance log. |
To expand or collapse the display
•Click Collapse/Expand All to toggle the view for the entire output.
•Click an output category to toggle the view for that category.
To download the JSON file
•Click Download JSON.
You can open the file in any JSON file viewer.
Tip: If the View, Collapse/Expand All, and Download JSON buttons aren’t visible, request another support package. After the support package is generated, the buttons appear.
Ping and traceroute connectivity tests
The Ping and Traceroute tests are useful to determine if a destination is reachable.
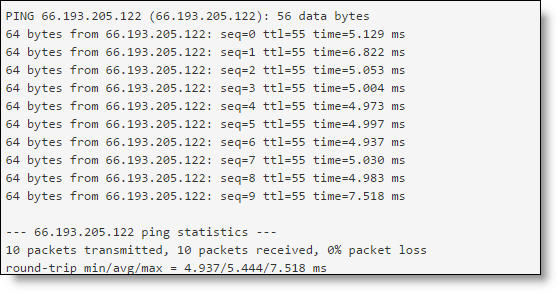
•Ping - Verifies reachability by sending ICMP packets from an appliance to a host on an Internet Protocol (IP) network.
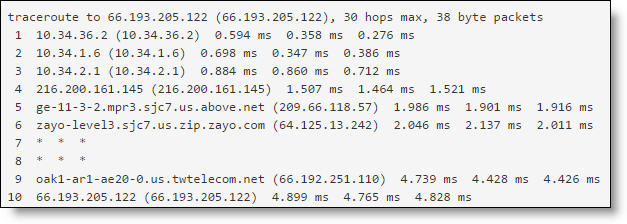
•Traceroute - Sends a sequence of User Datagram Protocol (UDP) packets between two points and shows you the route the packets take. Traceroute also measures the transit delays of packets across an IP network.
If the destination is unreachable, the tests report where the connection failed.
The SDI-5030 gateways don’t support the packet capture or traceroute tests.
We recommend using the ping or traceroute tests to verify connectivity, followed by a packet capture or an echo test to dive deeper into troubleshooting. See
Packet capture and
Echo test.
To run a ping or traceroute test
1. Choose Appliances and select a gateway. You can select any gateway within an organization. The appliance must be online, registered with SCM, and assigned to a site; offline and shadow appliances are dimmed and unavailable.
2. Select the Tools tab.
Tools tab
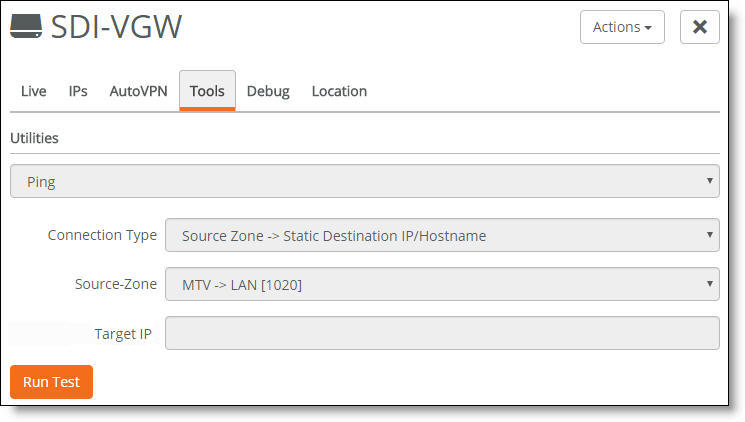
3. Select Ping or Traceroute from the drop-down menu.
4. Select a connection type from the drop-down menu:
•Source uplink and static destination IP address or hostname.
•Source uplink to a destination uplink.
•Source zone to a static destination IP address.
The display changes depending on the connection type.
•If you’re testing an uplink to a static destination, select the uplink from the drop-down list and type the IP address or hostname.
•If you’re testing an uplink to an uplink, select the source uplink, appliance, and destination uplink from the drop-down lists.
•If you’re testing a source zone to a static destination, select the source zone and uplink from the drop-down list and type the IP address.
Ping and traceroute tests from a source zone using the GUI work differently than ping and traceroute tests from a source zone using the CLI. When you select a source zone from the GUI, the gateway allocates an additional interface with an IP address in the selected zone and runs the ping or traceroute from it. This additional interface emulates the traffic path that a host in the same subnet takes, which might be different than the path the packets take when originating from the gateway.
The gateway must be able to allocate a free IP in the selected zone. If your zone only has a /30 subnet, or all IP addresses are in use, the ping or traceroute will fail and display an error message such as "Ping could not complete."
5. Click Run Test.
The test response appears.
Ping test response
Traceroute test response
The settings from the previous test remain in place the next time you return to the Tools tab.
Packet capture
You can request an on-demand packet capture for a gateway and download the capture file from the Tools tab. Capture files contain summary information for every internet packet received or transmitted on the appliance interface to help diagnose problems in the system.
The 570-SD, 770-SD, 3070-SD appliances and SDI-5030 gateways don’t support packet capture.
To perform a packet capture
1. Choose Appliances and select a gateway. The gateway must be online and registered with SCM; offline and shadow appliances are dimmed and unavailable.
2. Select the Tools tab.
3. Select Packet Capture from the drop-down menu.
4. Select a physical target port (Management, WAN, or LAN) from the drop-down list.
LAN ports must be configured as an uplink to appear on the drop-down list.
5. Optionally, specify the snap length value, in bytes. The snap length equals the number of bytes of each packet to be captured. Specify 1500 for a full packet capture. The default value is 500 bytes per packet.
6. Optionally, specify how long the capture runs, in seconds.
The packet capture typically completes within 90 to 100 seconds and times out after 120 seconds.
SCM and the gateway work together to provide a best-effort service. SCM sends the snap length and time for capture on a particular port to the gateway. The gateway attempts to capture packets on that port until either:
•500 packets are captured (each packet will contain bytes of data set by the snap length value)
—or—
•The capture time is reached.
The packet capture stops when one of these criteria is reached, whichever occurs first. For example, on a very busy port (a port where many packets are flowing) the system might always hit the 500 packet boundary but never reach the capture time. On a relatively idle port, the system might reach the capture time after capturing only 300 packets.
7. Click Run Test.
A message reports the test status.
8. Click Download Capture File to view the results of a successful packet capture.
Echo test
The echo test dives deeper into troubleshooting by testing network connectivity between a client-side and a server-side zone using a TCP port number and the TCP protocol. The echo test tells you if the communication from appliance A to appliance B is crossing the network overlay.
The 570-SD, 770-SD, 3070-SD appliances and SDI-5030 gateways don’t support the echo test.
To run an echo test
1. Choose Appliances and select a gateway. The gateway must be online and registered with SCM; offline and shadow appliances are dimmed and unavailable.
2. Select the Tools tab.
3. Select Echo Test from the drop-down menu.
4. Select a primary zone from the drop-down menu.
5. Select a secondary appliance on the other side from the drop-down menu.
6. Select a secondary zone on the other side from the drop-down menu.
7. Specify a TCP port number from 1 to 65535.
8. Click Run Test.
Appliance configuration
How can I tell if the appliance configuration is up to date?
•Choose Appliances > Overview.
Under the Config column, “Up-to-date” indicates that the latest configuration was applied successfully.
SteelConnect Windows Agent
How do I install SteelConnect Agent to use Windows 7 Client?
If your laptop client agent fails during installation, check the following:
•Is Windows using at least Service Pack 1?
•Are the latest security fixes installed?
•Are the IKE and AuthIP IPsec Keying Modules start up type set to automatic?
•Is Windows UAC (User Account Control) enabled with at least Level 1 settings?
Try re-executing the installer: browse to ProgramFiles%\Riverbed\Agent and execute Agent<orgname>.exe.
if you’re still having problems after trying these solutions, take a screenshot of the error message and contact Riverbed support.
Why do I see the error message “Organization ID is invalid! Location is off-site”?
The Windows agent detects its location by checking for Riverbed gateways belonging to the same organization. If it doesn’t receive a match, it assumes that it is off-site. The error message indicates that the agent has recognized that the device it’s installed on is not located behind a Riverbed appliance of its organization. The agent doesn’t negotiate a dedicated IPSec tunnel.
Provisioning
How do I get an appliance to show up in SCM?
In most cases, the first provisioning fails due to local firewall restrictions for TCP port 3900 and 3902.
For a gateway, make sure that internet connectivity and a DHCP server are available on the WAN port of the gateway to allow the first provisioning to succeed. While booting up, one green LED of the gateway will glow as long as a connection to SCM was established successfully. Glowing will stop in normal operation mode.
An access point appliance attempts to receive an IP address through DHCP from the zone automatically. Make sure that you have added your SSIDs (choose WiFi) and then assign the SSIDs to sites (choose WiFi > Broadcasts). All access points in a site will broadcast the SSIDs as configured in the WiFi section.
When deploying an access point in to a location without a Riverbed gateway, you might want to enable AutoVPN operation for the access point to join the full-mesh VPN. See
To enable AutoVPN on an access point.
While booting up, two LEDs (green and orange) on the access point blink as long as a connection to SCM was established successfully. Blinking stops in normal operation mode.
How do I bring an appliance online?
•If the IP address configuration through DHCP fails, check your DHCP server. The DNS resolution of core.riverbed.cc should resolve to 82.115.105.183.
•Connect to YourCC.riverbed.cc via TCP Port 3900 and 3902, and enter the telnet command:
telnet YourCC.riverbed.cc 3900
telnet YourCC.riverbed.cc 3902
Multiple DNS servers for a site
What is the format for entering more than one DNS server for a site?
Separate the servers by a space: for example, 208.67.222. 123 8.8.8.8.
Uplink subnet mask format
What is the format for specifying a subnet mask on an uplink?
The uplink subnet mask format is xxx.xx.xxx.xx/xx. For example: 121.73.131.14/16.
VPN
Why is AutoVPN not working?
AutoVPN is enabled by default and provides connectivity between sites on the same organization. In each site there can be only one appliance acting as an AutoVPN endpoint.
The VPN appliance should ideally be the gateway for this site or placed in-path to pass all traffic entering and exiting the site. Sites that don’t have a gateway might enable AutoVPN on an access point to join the full-mesh VPN.
If AutoVPN is down, check the uplink status and cabling, and check the tunnel.
Tip: You view the uplink status using your iPhone. For details, see the SteelConnect iOS Application User’s Guide.
To check the uplink status and cabling
1. Select the organization and click Manage.
2. Choose Network Design > Uplinks. Check the Status column. Are any appliance uplinks reported as off-line?
3. Choose Ports to verify that the port is set to Port mode: uplink.
4. Check the cable to the WAN2 port to make sure it’s configured correctly.
To check the tunnel
•Check that the uplinks and appliance status are online.
•Log in to both affected gateways to verify that a tunnel is established.
•Check the IPSec ports via IPSec debugging to see whether inbound IPSec/IKE packets are received.
•Ensure you can reach UDP ports 500 and 4500 on the remote gateway.
WiFi
Why are clients not receiving IP addresses via DHCP in guest zone SSID?
•Choose WiFi > Broadcasts to check the broadcast SSIDs for the zones.
•Choose Appliances > Overview and check the access point's wired configuration mode. Check that the access point port LAN port is set up correctly. It needs to be set up in multizone if more than one WiFi is broadcast.
Why is the wireless client roaming inefficiently?
Roaming behavior depends on the wireless client’s network adapter. Some manufacturers such as Intel provide documentation regarding roaming behavior:
If the wireless client is roaming inefficiently, check the signal strength and quality first and verify if the issue is persistent on other devices as well.
Access points
Can I run an access point without a SteelConnect gateway?
Yes, you just need to ensure that there is a DHCP service running in the configured access point zone to provide IPs to the wireless client services.
When no gateway is present, internal servers need to provide network services like DHCP.
If you want to use different broadcasts with more than one zone (VLAN) for your WiFi networks, make sure that the access point is attached to a VLAN-capable switch.
Gateways
What does it mean when a gateway is in recovery mode?
Recovery mode is a mechanism used by the gateway in an attempt to restore communication to its SCM controller when an uplink is not working.
The WAN ports on the gateway go into recovery mode approximately five minutes after communication is lost to its SCM controller. In recovery mode, the WAN port receives an IP address through DHCP and then uses this IP address to reach SCM.
If recovery mode does not work, you can also restore the gateway using an off-line USB method. For details, see
How do I provision a gateway offline?.