Viewing Connection Tracing Reports
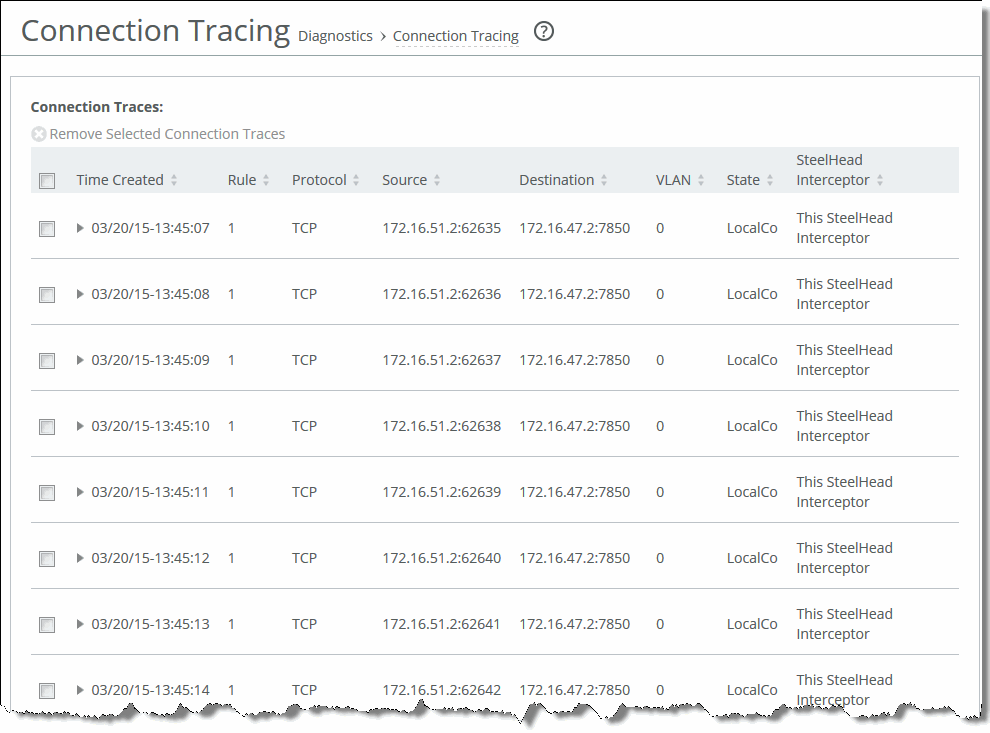
The Connection Tracing report provides the current status of configured connection traces, showing the SteelHeads to which the SteelHead Interceptor has redirected specific connections. Connection traces also enable users to debug failing or unoptimized connections.
For details about configuring connection tracing, see
Configuring Connection Tracing Rules.
What This Report Tells You
The Connection Tracing report answers the following questions:
• Which redirected connections went to which SteelHeads?
• Which connection tracing rule determined the connection?
• Was the connection optimized, serviced, passed through, redirected, ignored, or dropped?
To view the Connection Tracing report
1. Choose Reports > Diagnostics: Connection Tracing to display the Connection Tracing page.
Figure: Connection Tracing Page

The report provides the following information about traced connections.
Field | Descriptions |
Time Created | Displays the timestamp of when the traced connection was made. |
Rule | Displays the connection tracing rule that applies to the entry. |
Protocol | Displays the protocol. |
Source | Displays the IP address and port number of the source SteelHead. |
Destination | Displays the IP address and port number of the destination SteelHead. |
VLAN | Displays the VLAN ID, if applicable. (In VLAN segregation mode, displays instance information.) |
State | Displays the connection state (optimized, serviced, pass-through, redirect, remote, local, ignored, dropped, or unknown). |
SteelHead Interceptor | Displays the SteelHead Interceptor from which the trace originated. |
2. Optionally, select the check box next to the connection, and click Remove Selected Connection Traces.


