Viewing Logs
SteelHead Interceptor log reports provide a high-level view of network activity. You can view both user and system logs.
Viewing User Logs
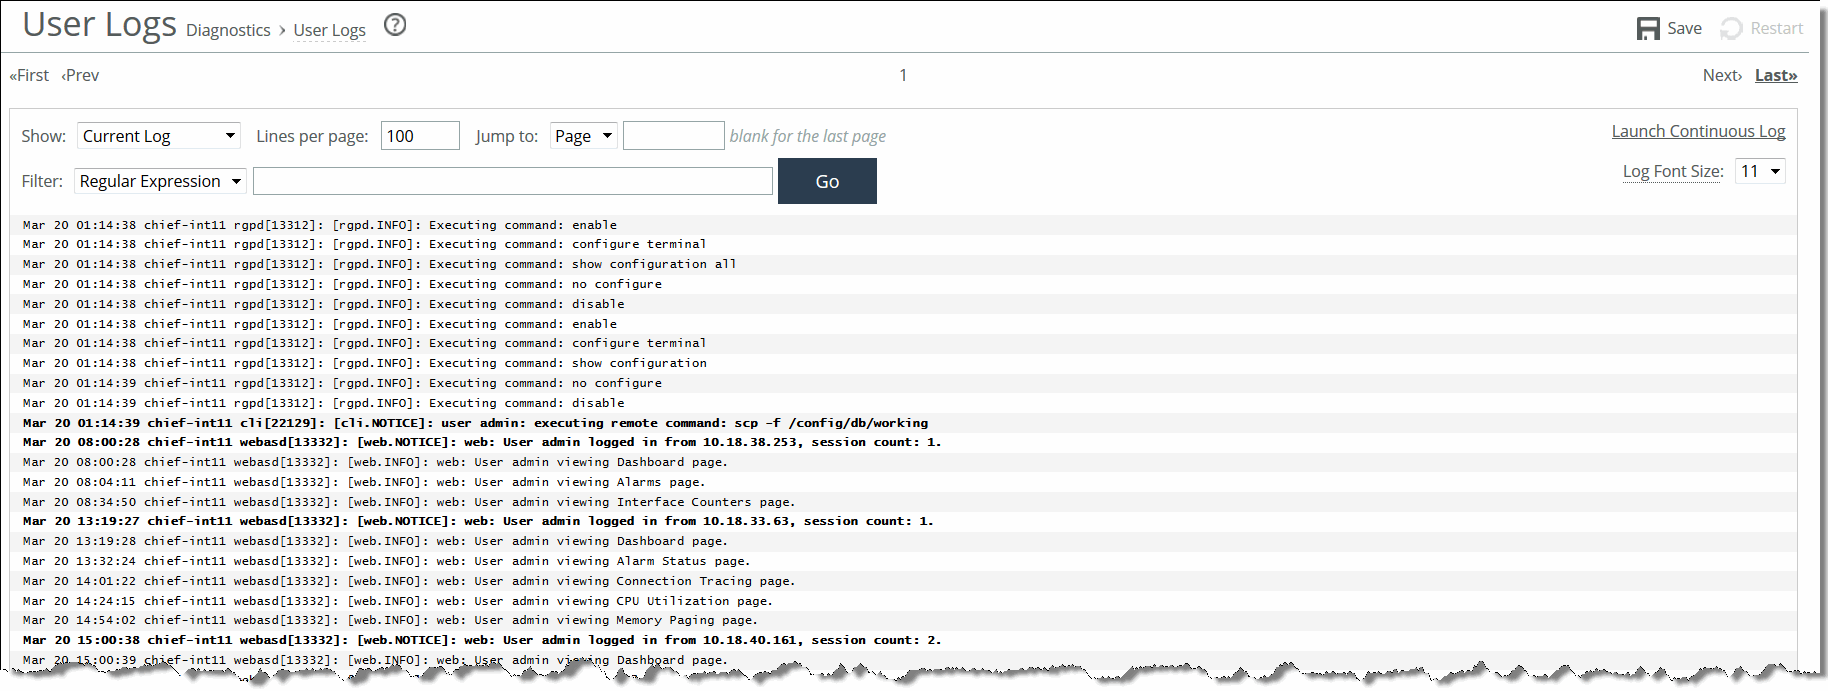
You can view user logs in the Reports > Diagnostics: User Logs page. The user log filters messages from the system log to display messages that are of immediate use to the system administrator.
View user logs to monitor system activity and to troubleshoot problems. For example, you can monitor who logged in, who logged out, and who entered particular CLI commands, alarms and errors. The most recent log events are listed first.
To view and customize user logs
1. Choose Reports > Diagnostics: User Logs to display the User Logs page.
Figure: User Logs Page

2. Use the controls to customize the log as described in this table.
Control | Description |
Show | Select one of the archived logs or Current Log from the drop-down list. |
Lines per Page | Specify the number of lines you want to display in the page. |
Jump to | Select one of the following options from the drop-down list: • Page - Specify the number of pages you want to display. • Time - Specify the time for the log you want to display. |
Filter | Select one of the following filtering options from the drop-down list: • Regular expression - Specify a regular expression on which to filter the log. • Error or higher - Displays Error level logs or higher. • Warning or higher - Displays Warning level logs or higher. • Notice or higher - Displays Notice level logs or higher. • Info or higher - Displays Info level logs or higher. |
Go | Displays the report. |
3. To print the report, choose File > Print in your web browser to open the Print dialog box.
Note: You can continuously display new lines as the log grows and appends new data.
To view a continuous log
1. Choose Reports > Diagnostics: User Logs to display the User Logs page.
3. Click Launch continuous log in the upper-right corner of the page.
Note: If the continuous log does not appear after clicking the icon, a pair of SteelHeads might be optimizing HTTP traffic between your web browser and the primary or auxiliary interface of the SteelHead on which you are viewing the log, and the pair of SteelHeads are buffering the HTTP response. To display the continuous log, you can switch to HTTPS, because the SteelHeads will not optimize HTTPS traffic. Alternatively, you can configure the other SteelHeads to pass through traffic on the primary or auxiliary interfaces for port 80.
Viewing System Logs
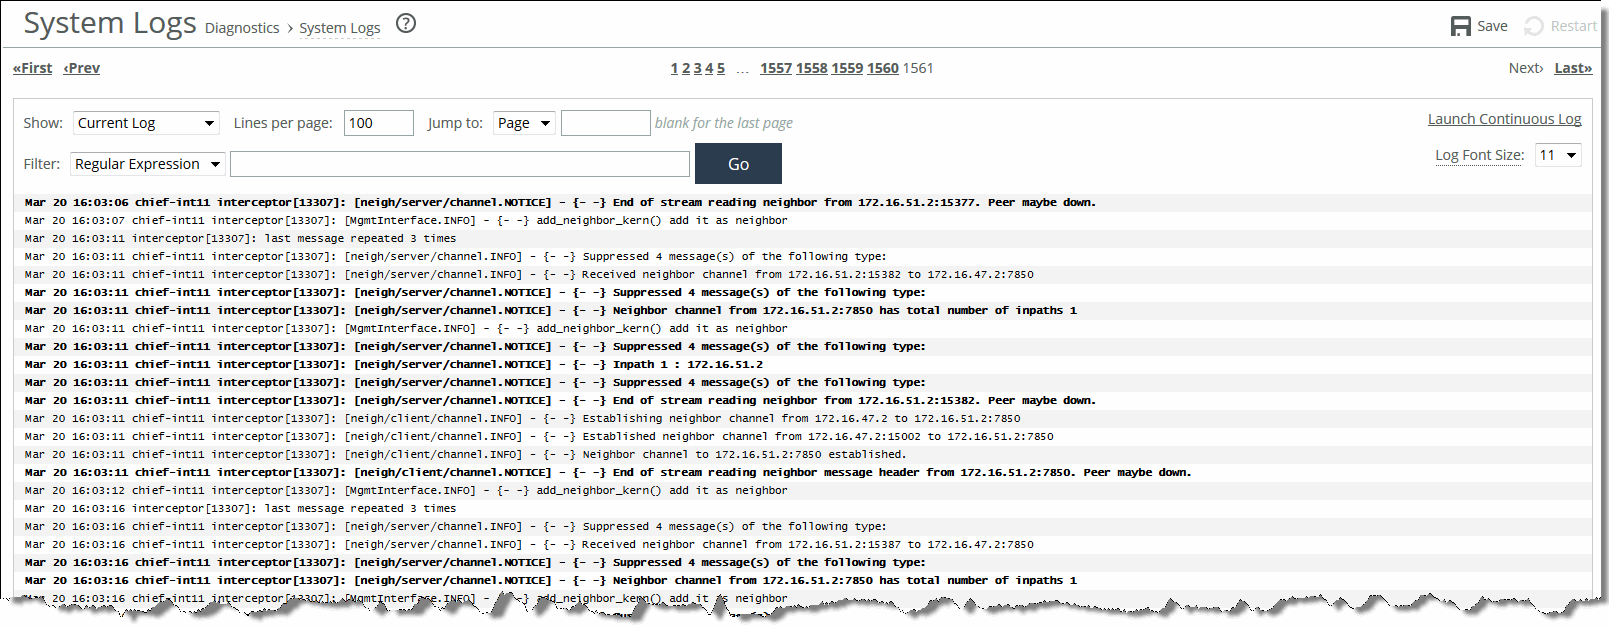
You can view system logs in the Reports > Diagnostics: System Logs page. View system logs to monitor system activity and to troubleshoot problems. The most recent log events are listed first.
To customize system logs
1. Choose Reports > Diagnostics: System Logs to display the System Logs page.
Figure: System Logs Page

2. Use the controls to customize the log as described in this table.
Control | Description |
Show | Select one of the archived logs or Current Log from the drop-down list. |
Lines per Page | Specify the number of lines you want to display in the page. |
Jump to | Select one of the following options from the drop-down list: • Page - Specify the number of pages you want to display. • Time - Specify the time for the log you want to display. |
Filter | Select one of the following filtering options from the drop-down list: • Regular expression - Specify a regular expression on which to filter the log. • Error or higher - Displays Error level logs or higher. • Warning or higher - Displays Warning level logs or higher. • Notice or higher - Displays Notice level logs or higher. • Info or higher - Displays Info level logs or higher. |
Go | Displays the report. |
3. To print the report, choose File > Print in your web browser to open the Print dialog box.
Note: You can continuously display new lines as the log grows and appends new data.
To view a continuous log
1. Choose Reports > Diagnostics: System Logs to display the System Logs page.
3. Click Launch continuous log in the upper-right corner of the page.
Note: If the continuous log does not appear after clicking the icon, a pair of SteelHeads might be optimizing HTTP traffic between your web browser and the primary or auxiliary interface of the SteelHead on which you are viewing the log, and the pair of SteelHeads are buffering the HTTP response. To display the continuous log, you can switch to HTTPS, because the SteelHeads will not optimize HTTPS traffic. Alternatively, you can configure the other SteelHeads to pass through traffic on the primary or auxiliary interfaces for port 80.
