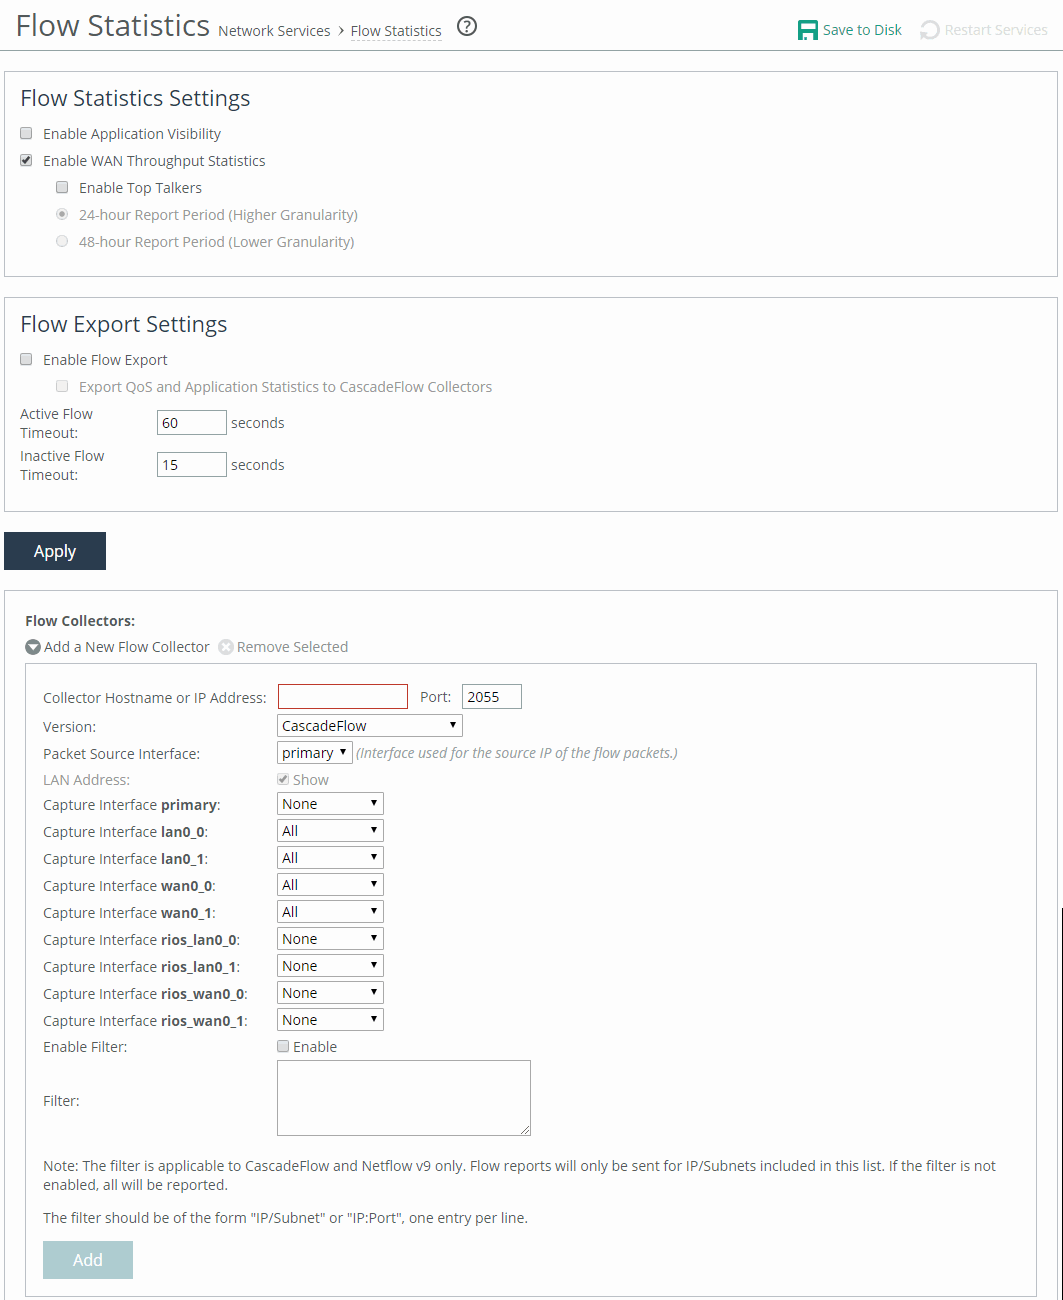
Configuring flow statistics
You enable and configure flow statistic settings in the Networking > Network Services: Flow Statistics page. You can also enable flow export to an external collector and to a CascadeFlow collector. CascadeFlow collectors can aggregate information about QoS configuration and other application statistics to send to a SteelCentral NetProfiler. The Enterprise NetProfiler summarizes and displays the QoS configuration statistics.
By default, flow export is disabled.
You can’t export data flowing through a secure transport tunnel to a flow collector. Secure transport provides security by creating tunnels between the peers through which the traffic flows. IPsec is used to provide authentication and encryption to the packets that flow through the tunnels. Specifically, secure transport uses the ESP mode of IPsec. Flow statistic collectors can’t collect ESP packet data flow information.
External collectors use information about network data flows to report trends such as the top users, peak usage times, traffic accounting, security, and traffic routing. You can export preoptimization and post-optimization data to an external collector.
The Top Talkers feature enables a report that details the hosts, applications, and host and application pairs that are either sending or receiving the most data on the network. Top Talkers doesn’t use a NetFlow Collector.
Flow Statistics page

Enabling flow export
SteelHeads support NetFlow v5.0 and later, CascadeFlow v9.1 and later, and CascadeFlow-compatible features.
NetFlow export is supported only when Xbridge mode is enabled. NetProfiler 10.20 and later are supported.
Flow export requires these components:
• Exporter—When you enable flow export support, the SteelHead exports data about the individual flows that it sees as they traverse the network.
• Collector—A server or appliance designed to aggregate data sent to it by the SteelHead and other exporters.
• Analyzer—A collection of tools used to analyze the data and provide relevant data summaries and graphs. NetFlow analyzers are available for free or from commercial sources. Analyzers are often provided in conjunction with the collectors.
Before you enable flow export in your network, consider the following:
• Flow data typically consumes less than 1 percent of link bandwidth. Take care with low bandwidth links to ensure that flow export doesn’t consume too much bandwidth and thereby impacting application performance.
• You can reduce the amount of bandwidth consumption by applying filters that only export the most critical information needed for your reports.
Flow statistics settings
This section describes the flow statistics settings.
Enable Application Visibility
Continuously collects detailed application-level statistics for both pass-through and optimized traffic. The Application Visibility and Application Statistics reports display these statistics. This statistic collection is disabled by default.
To view the reports, choose Reports > Networking: Application Statistics or Application Visibility.
Enabling application visibility also improves connection reporting on the Current Connections report. For example, HTTP-SharePoint is displayed as the WebDAV or FPSE protocols and Office 365 appears as MS-Office-365 instead of HTTP.
Enable WAN Throughput Statistics
Continuously collects detailed application-level statistics for both pass-through and optimized traffic. The Application Visibility and Application Statistics reports display these statistics. This statistic collection is disabled by default.
To view the reports, choose Reports > Networking: Application Statistics or Application Visibility.
Enabling application visibility also improves connection reporting on the Current Connections report. For example, HTTP-SharePoint is displayed as the WebDAV or FPSE protocols and Office 365 appears as MS-Office-365 instead of HTTP.
Enable Top Talkers
Continuously collects statistics for the most active traffic flows. A traffic flow consists of data sent and received from a single source IP address and port number to a single destination IP address and port number over the same protocol.
The most active, heaviest users of WAN bandwidth are called the Top Talkers. A flow collector identifies the top consumers of the available WAN capacity (the top 50 by default) and displays them in the Top Talkers report. Collecting statistics on the Top Talkers provides visibility into WAN traffic without applying an in-path rule to enable a WAN visibility mode.
You can analyze the Top Talkers for accounting, security, troubleshooting, and capacity planning purposes. You can also export the complete list in CSV format.
The collector gathers statistics on the Top Talkers based on the proportion of WAN bandwidth consumed by the top hosts, applications, and host and application pair conversations. The statistics track pass-through or optimized traffic, or both. Data includes TCP or UDP traffic, or both (configurable in the Top Talkers report page).
A NetFlow collector is not required for this feature.
Optionally, select a time period to adjust the collection interval:
24-hour Report Period—For a five-minute granularity (the default setting).
48-hour Report Period—For a ten-minute granularity.
The system also uses the time period to collect SNMP Top Talker statistics. For top talkers displayed in the Top Talker report and SNMP Top Talker statistics, the system updates the Top Talker data ranks either every 300 seconds (for a 24- hour reporting period), or 600 seconds (for a 48-hour reporting period).
The system saves a maximum of 300 Top Talker data snapshots, and aggregates these to calculate the top talkers for the 24-hour or 48-hour reporting period.
The system never clears top talker data at the time of polling; however, every 300 or 600 seconds, it replaces the oldest Top Talker data snapshot of the 300 with the new data snapshot.
After you change the reporting period, it takes the system one day to update the Top Talker rankings to reflect the new reporting period. In the interim, the data used to calculate the Top Talkers still includes data snapshots from the original reporting period. This delay applies to Top Talker report queries and SNMP Top Talker statistics.
To enable flow statistic settings
1. Choose Networking > Network Services: Flow Statistics to display the Flow Statistics page.
2. Under Flow Statistics Settings, adjust the settings to your needs.
3. Click Apply to apply your settings.
4. Click Save to Disk to save your settings permanently.
Flow export settings
This section describes the flow export settings.
Enable Flow Export
Enables the SteelHead to export network statistics about the individual flows that it sees as they traverse the network. By default, this setting is disabled.
Export QoS and Application Statistics to CascadeFlow Collectors
Sends application-level statistics from all sites to a SteelCentral collector on a SteelCentral appliance. SteelCentral appliances provide central reporting capabilities. The collector aggregates QoS and application statistics to provide visibility using detailed records specific to flows traversing the SteelHead.
The SteelHead sends SteelCentral an enhanced version of NetFlow called CascadeFlow. CascadeFlow includes:
• NetFlow v9 extensions for round-trip time measurements that enable you to understand volumes of traffic across your WAN and end-to-end response time.
• extensions that enable a SteelCentral NetExpress to properly measure and report on the benefits of optimization.
After the statistics are aggregated on a Cascade appliance, you can use its central reporting capabilities to:
• analyze overall WAN use, such as traffic generated by application, most active sites, and so on.
• troubleshoot a particular application by viewing how much bandwidth it received, checking for any retransmissions, interference from other applications, and so on.
• compare actual application use against your outbound QoS policy configuration to analyze whether your policies are effective. For example, if your QoS policy determines that Citrix should get a minimum of 10 percent of the link, and the application statistics reveal that Citrix performance is unreliable and always stuck at 10 percent, you might want to increase that minimum guarantee.
You must enable outbound QoS on the SteelHead, add a CascadeFlow collector, and enable REST API access before sending QoS configuration statistics to a SteelCentral NetProfiler.
To enable QoS, choose Networking > Network Services: Outbound QoS. You can’t export statistics for inbound QoS.
The collectors appear in the Flow Collector list at the bottom of the Configure > Networking: Flow Statistics page.
To enable REST API access, choose Administration > Security: REST API Access.
The CascadeFlow collector collects read-only statistics on both pass-through and optimized traffic. When you use CascadeFlow, the SteelHead sends four flow records for each optimized TCP session: ingress and egress for the inner-channel connection, and ingress and egress for the outer-channel connection. A pass-through connection still sends four flow records, even though there are no separate inner- and outer-channel connections. In either case, the SteelCentral NetExpress merges these flow records together with flow data collected for the same flow from other devices.
For details, see the SteelCentral Network Performance Management Deployment Guide.
Enable IPv6
Enables support for IPv6 addresses for flow exports.
Active Flow Timeout
Optionally, specify the amount of time, in seconds, the collector retains the list of active traffic flows. The default value is 60 seconds.
You can set the time-out period even if the Top Talkers option is enabled.
Inactive Flow Timeout
Optionally, specify the amount of time, in seconds, the collector retains the list of inactive traffic flows. The default value is 15 seconds.
To enable flow export settings
1. Choose Networking > Network Services: Flow Statistics to display the Flow Statistics page.
2. Under Flow Export Settings, adjust the settings to your needs.
3. Click Apply to apply your settings.
4. Click Save to Disk to save your settings permanently.
Flow collector settings
This section describes flow collector settings.
Collector Hostname or IP Address
Specifies the IP address or (in RiOS 9.7 and later) a hostname for the Flow collector.
Port
Specifies the UDP port the Flow collector is listening on. The default value is 2055.
Version
Select one of these versions from the drop-down list:
• CascadeFlow—Use with Cascade Profiler 8.4 or later.
• CascadeFlow-compatible—Use with Cascade Profiler 8.3.2 or earlier, and select the LAN Address check box.
• NetFlow v9—Enables both ingress and egress flow records.
• NetFlow v5—Enables ingress flow records.
For details on using NetFlow records with Cascade, see the SteelCentral Network Performance Management Deployment Guide.
CascadeFlow and CascadeFlow-compatible are enhanced versions of flow export to the SteelCentral. These versions allow automatic discovery and interface grouping for SteelHeads in a Riverbed SteelCentral NetProfiler or a SteelCentral Flow Gateway and support WAN and optimization reports in SteelCentral. For details, see the SteelCentral NetProfiler and NetExpress User Guide and the SteelCentral Flow Gateway User Guide.
Packet Source Interface
Select the interface to use as the source IP address of the flow packets (Primary, Aux, or MIP) from the drop-down list. NetFlow records sent from the SteelHead appear to be sent from the IP address of the selected interface.
LAN Address
Causes the TCP/IP addresses and ports reported for optimized flows to contain the original client and server IP addresses and not those of the SteelHead. The default setting displays the IP addresses of the original client and server without the IP address of the SteelHeads.
This setting is unavailable with NetFlow v9 and later, because the optimized flows are always sent out with both the original client server IP addresses and the IP addresses used by the SteelHead.
Capture Interface/Type
Specifies the traffic type to export to the flow collector. Select one of these types from the drop-down list:
• All—Exports both optimized and nonoptimized traffic.
• Optimized—Exports optimized traffic.
• Optimized—Exports optimized LAN or WAN traffic when WCCP is enabled.
• Passthrough—Exports pass-through traffic.
• None—Disables traffic flow export.
The default is All for LAN and WAN interfaces, for all four collectors. The default for the other interfaces (Primary, rios_lan, and rios_wan) is None. You can’t select a MIP interface.
Enable Filter
(CascadeFlow and NetFlow v9 only) Filter flow reports by IP and subnets or IP:ports included in the Filter list. When disabled, reports include all IP addresses and subnets.
To add or remove a flow collector
1. Under Flow Collectors, click Add a New Flow Collector.
To remove a collector, select it, and then click Remove Selected.
2. Adjust the settings to your needs.
3. Click Add.
4. Click Save to Disk to save your settings permanently.
Flow export in virtual in-path deployments
In virtual in-path deployments, such as WCCP or PBR, traffic arrives and leaves from the same WAN interface. When data is exported to a flow export collector, all traffic has the WAN interface index. This behavior is correct because the input interface is the same as the output interface.
For details about configuring flow export in a virtual in-path deployment, see
Configuring subnet side rules.
To distinguish between LAN-to-WAN and WAN-to-LAN traffic in virtual in-path deployments, see the SteelHead Deployment Guide.
Related topics
Troubleshooting
To troubleshoot your flow export settings:
• Make sure the port configuration matches on the SteelHead and the listening port of the collector.
• Ensure that you can reach the collector from the SteelHead (for example, –i aux 1.1.1.1 where 1.1.1.1 is the NetFlow collector and aux is the Packet Source Interface).
• Verify that your capture settings are on the correct interface and that traffic is flowing through it.


