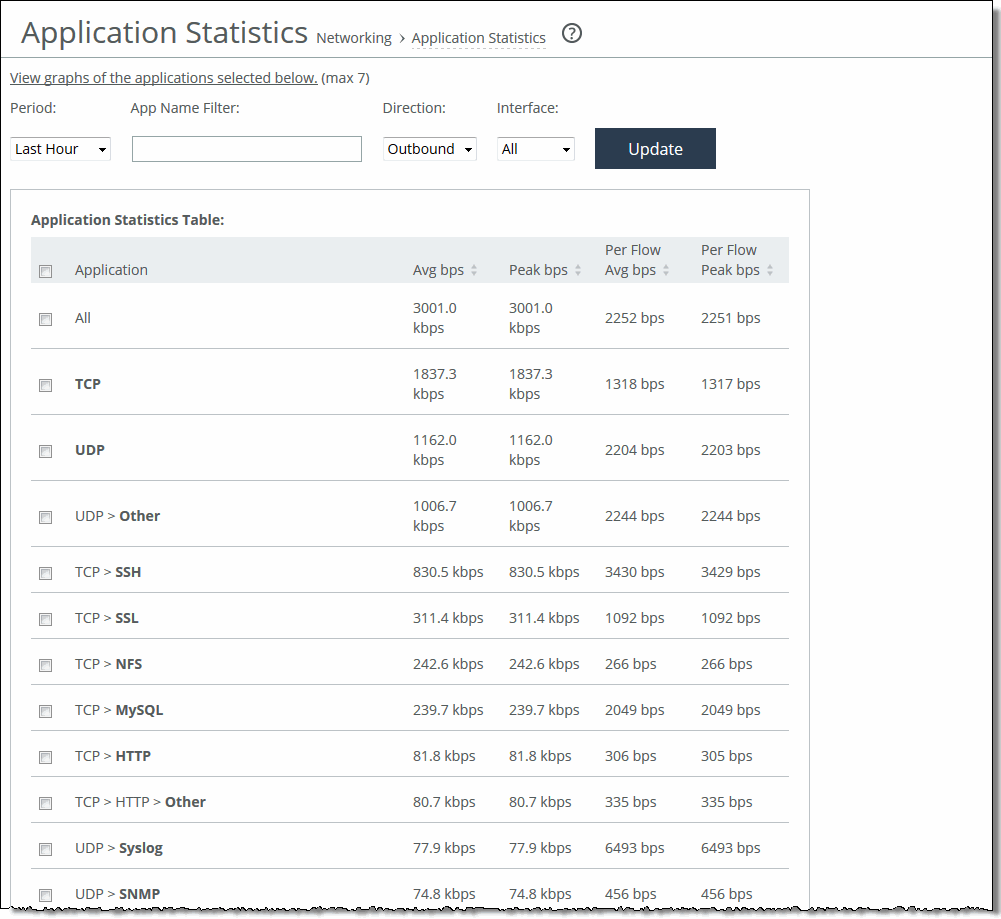
Application Statistics page 

Data series | Description |
Average bps | Displays the average data activity in all flows of an application in bits per second. The minimum sample granularity is 5 minutes. |
Per Flow Average bps | Displays the average trended throughput in all traffic flows of an application in bits per second. This data series indicates how bandwidth intensive an application is per user or flow. RiOS calculates the WAN average at each data point by taking the number of bytes transferred, converting that to bits, and then dividing by the granularity. For instance, if the system reports 100 bytes for a data point with a 10-second granularity, RiOS calculates: 100 bytes * 8 bits/byte / 10 seconds = 80 bps This calculation means that 80 bps was the average throughput over that 10-second period. |
Peak bps | Displays the peak data activity in bits per second. For larger granularity data points, this represents the largest 5 minute average within. For 5 minutes, this is the same as the average. |
Per flow Peak bps | Displays the peak trended data activity per traffic flow in bits per second. This peak is the largest per flow 5-minute bps within a larger sample. |

Control | Description |
Period | Select a period of Last 5 Minutes, Last Hour, Last Day, Last Week, Last Month, or Custom from the drop-down list. For Custom, enter the Start Time and End Time and click Go. Use the format YYYY/MM/DD HH:MM:SS. |
App Name Filter | Click a protocol or application name (for example, TCP, LDAP, SharePoint) to show only the selection. You can select only one filter at a time. For example, if the report is filtering on UDP and you click TCP, the report displays all TCP entries and clears the UDP filter. |
Direction | Select the traffic direction from the drop-down list. The default is outbound LAN > WAN traffic. |
Interface | Select an interface from the drop-down list. The default is all WAN and primary interfaces. |
Update | Click to update the chart without updating the application selection. |