Viewing Traffic Summary reports
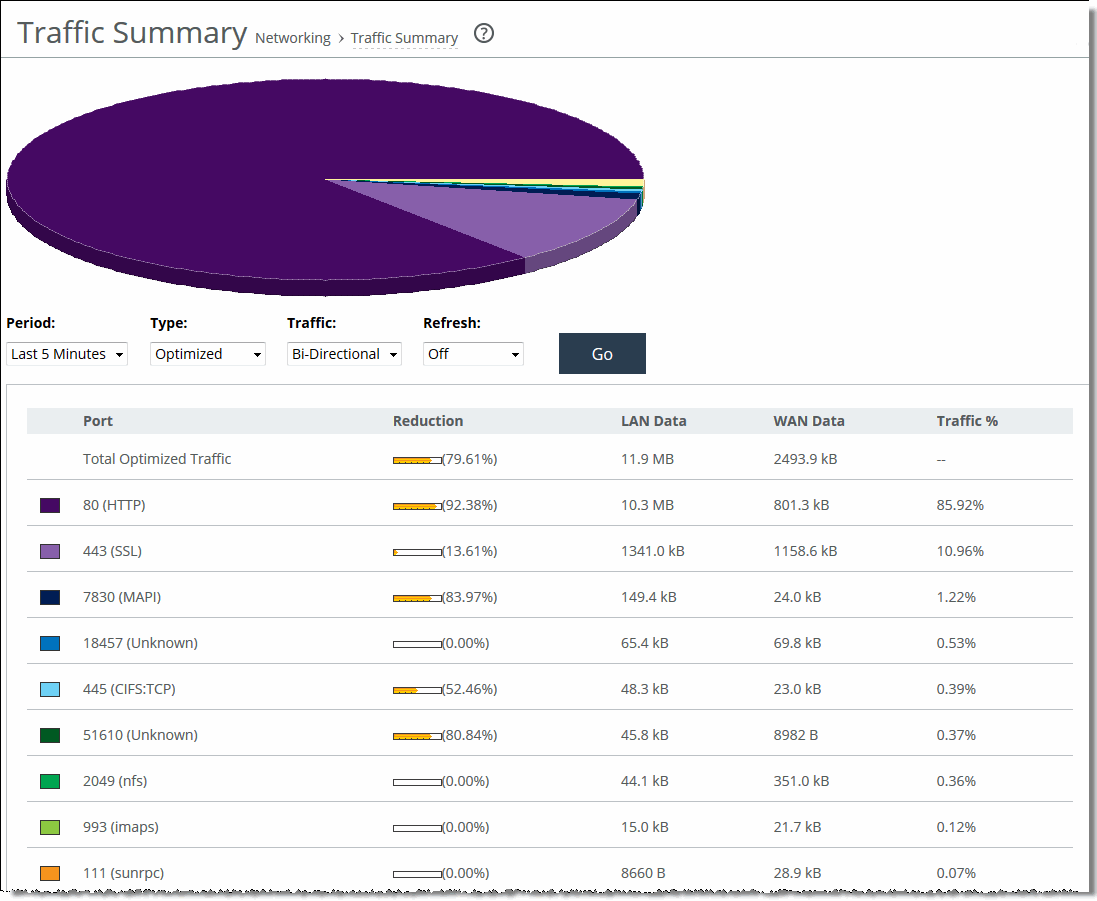
The Traffic Summary report provides a percentage breakdown of the amount of TCP traffic going through the system. For details about setting ports to be monitored, see
Configuring monitored ports.
The SteelHead automatically discovers all the ports in the system that have traffic. The discovered port and its label (if one exists) are added to the report. If a label doesn’t exist, an unknown label is added to the discovered port.
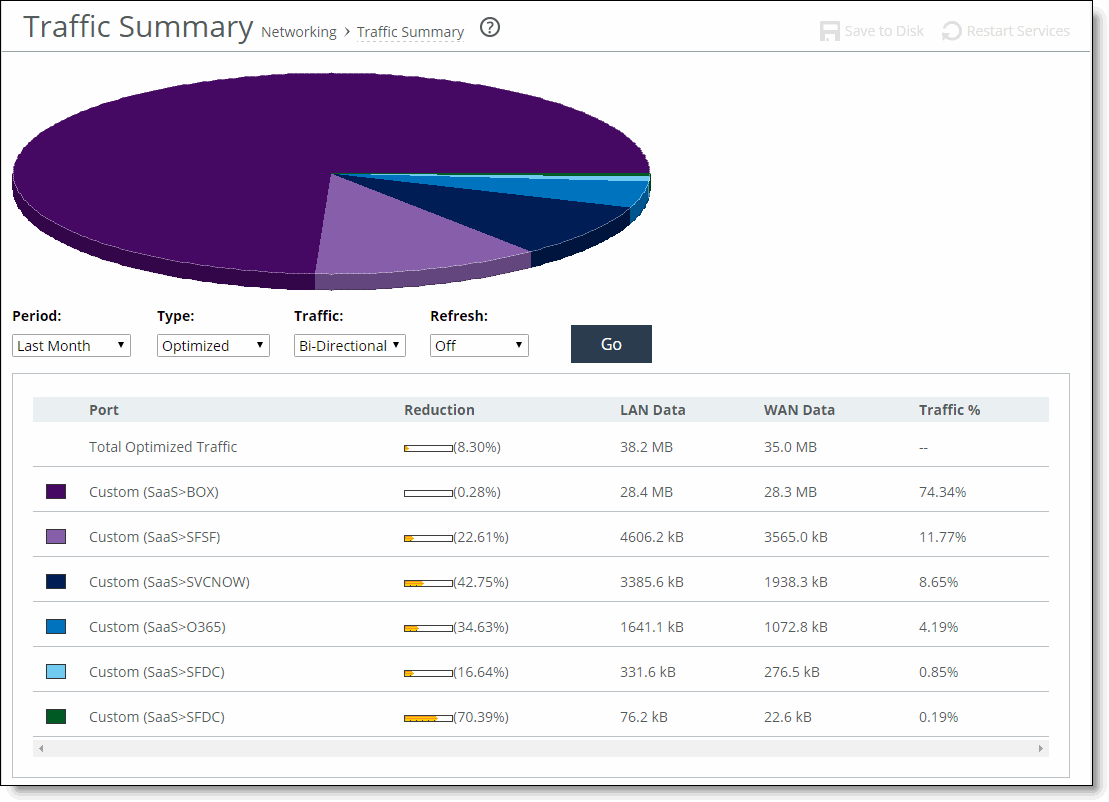
Starting with RiOS 9.5, you can view optimization statistics for SaaS applications. This report lists the optimized traffic by SaaS application instead of by port number, and the ID for the SaaS application is listed in the Port column. To configure SaaS applications for optimization by the SteelHead, see
Configuring the Legacy Cloud Accelerator and
Activating SaaS applications.
SaaS application statistics are not included with the overall statistics for port 443 and port 80.
When using a role-based management (RBM) user, ensure that the RBM user has at least Read-Only permissions for the Cloud Optimization role, or the user will not be able to view the SaaS application names.
To find the definition of the application ID that is listed in the Port column, open the Optimization > Cloud Accelerator page. The ID (for example, SFDC) and application name (for example, Salesforce.com) are listed in the Application ID and SaaS Application Control fields.
If you want to change the unknown label to a name representing the port, you must readd the port with a new label. All statistics for this new port label are preserved from the time the port was discovered.
The Traffic Summary report displays a maximum of 16 ports and pie slices for the traffic types comprising more than 0.005 percent of the total traffic (by destination port). When there are more than 16 ports, the report displays 15 individual ports and aggregates the remaining ports into the 16th slice. The 16th slice is always gray. Any ports aggregated into the 16th slice are also gray. Any traffic that comprises less than 0.005 percent of the total isn’t included in the Traffic Summary report, but is aggregated into the Bandwidth Optimization report.
The Traffic Summary report provides this table of statistics that describe data activity for the application and the time period you specify.
Column | Description |
Port | Displays the TCP/IP port number and application for each row of statistics. For SaaS applications, the word “Custom” and the application name is displayed instead of a port number. |
Reduction | Displays the amount of application data reduction. |
LAN Data | Displays the amount of application data on the LAN. |
WAN Data | Displays the amount of application data on the WAN. |
Traffic % | Calculates LAN-side data to indicate the percentage of the total traffic each port represents. |
What this report tells you
The Traffic Summary report answers these questions:
• How much data reduction has occurred?
• What was the percentage of the total traffic for each port?
• Which SaaS applications are being optimized? (RiOS 9.5 and later)
About report data
The Riverbed system reports on performance for periods up to one month. Due to performance and disk space considerations, the display granularity decreases with time passed since the data was sampled. The Traffic Summary report displays these data granularities:
• Last 1 hour's worth of data is available at 10-second granularity.
• Last 1 day's worth of data is available at 5-minute granularity.
• Last 1 week's worth of data is available at 1-hour granularity.
• Last 1 month's worth of data is available at 2-hour granularity.
To view the Traffic Summary report
1. Choose Reports > Networking: Traffic Summary to display the Traffic Summary page.
Traffic Summary page showing port numbers

Traffic Summary page showing SaaS applications

2. Use the controls to customize the report as described in this table.
Control | Description |
Period | Select a period of Last Minute, Last 5 Minutes, Last Hour, Last Day, Last Week, Last Month, or Custom from the drop-down list. For Custom, enter the Start Time and End Time and click Go. Use the following format: YYYY/MM/DD HH:MM:SS |
Type | Select a traffic type of Optimized, Pass Through, or Both from the drop-down list. |
Traffic | Select a traffic direction from the drop-down list: • Bi-Directional—traffic flowing in both directions • WAN-to-LAN—inbound traffic flowing from the WAN to the LAN • LAN-to-WAN—outbound traffic flowing from the LAN to the WAN. |
Refresh | Select a refresh rate from the drop-down list: • To refresh the report every 10 seconds, select 10 seconds. • To refresh the report every 30 seconds, select 30 seconds. • To refresh the report every 60 seconds, select 60 seconds. • To turn refresh off, click Off. |
Go | Displays the report. |
