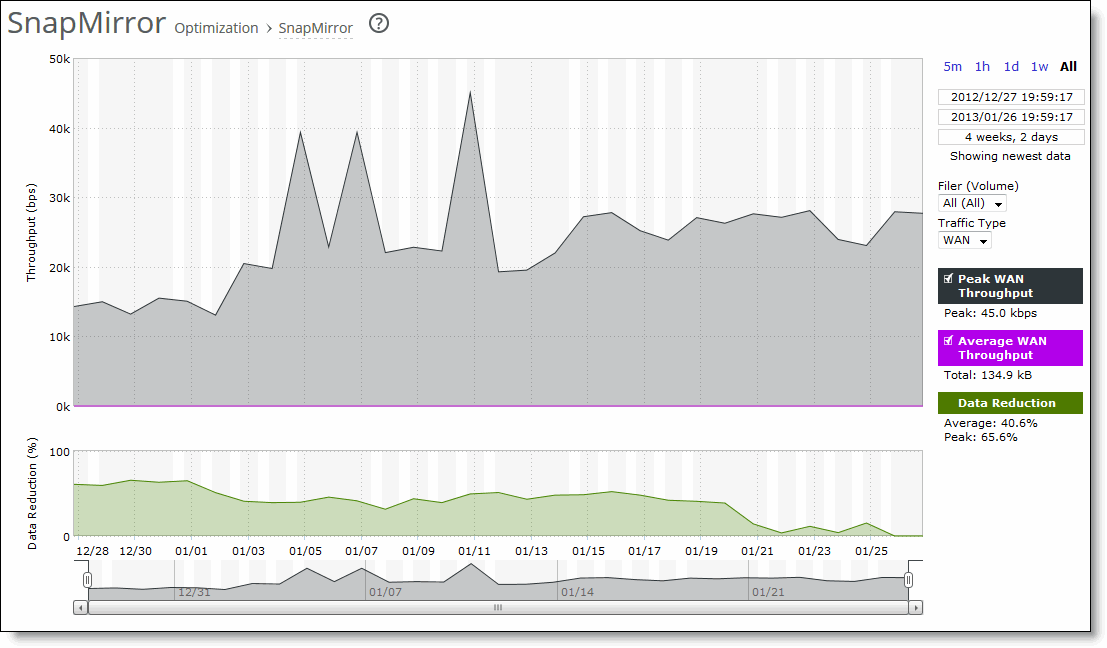
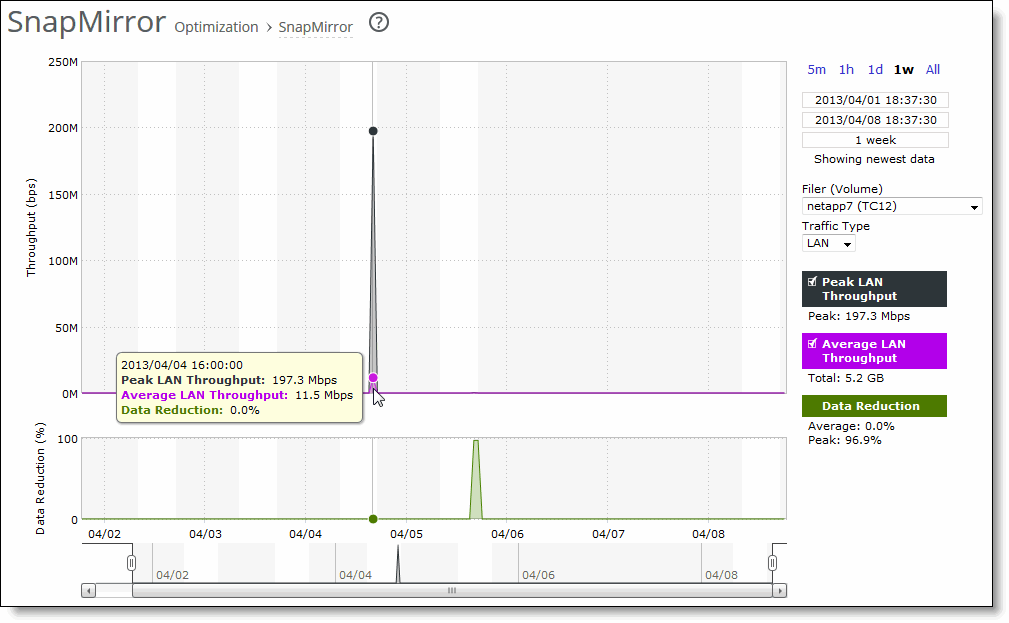
SnapMirror page Displaying All Filers

Data series | Description |
Peak LAN/WAN Throughput | Displays the peak LAN/WAN data activity. The system stores peak statistics as bytes transferred over the LAN, but calculates the normal throughput using a granularity of 10 seconds. |
Average LAN/WAN Throughput | Displays the average LAN/WAN data activity. The system stores non-peak statistics as the number of bytes transferred over the LAN/WAN, and calculates the throughput by converting bytes to bits and then dividing the result by the granularity. For instance, if the system reports 100 bytes for a data point with a 10-second granularity, RiOS calculates: 100 bytes * 8 bits/byte / 10 seconds = 80 bps This calculation means that 80 bps was the average throughput over that 10-second period. The total throughput shows the data amount transferred during the displayed time interval. |
Data Reduction | Specifies the percentage of total decrease in overall data transmitted (when viewing all SnapMirror filers). The system calculates data reduction as (total LAN data - total WAN data) / total LAN data. You can use data reduction information to fine-tune the optimization settings for a filer, a filer and a volume, or a filer, volume, and qtree. |


Control | Description |
Time interval | Select a report time interval of 5 minutes (5m), 1 hour (1h), 1 day (1d), 1 week (1w), All, or type a custom date. All includes statistics for the last 30 days. Time intervals that don’t apply to a particular report are dimmed. For a custom time interval, enter the start time and end time using the format YYYY/MM/DD HH:MM:SS. You can view the newest data and see data points as they’re added to the chart dynamically. To display the newest data, click Show newest data. |
Filer (Volume) | Select a filer, a filer and a volume, or a filer, volume, and qtree to view detailed statistics on that filer, along with volume and qtree information when applicable. Select all to view statistics on all filers. The SteelHead automatically identifies and summarizes information by filer, volume, and qtrees based on the SnapMirror traffic seen by the SteelHead. Peak lines appear after one hour for filer detail reports. |
Traffic Type | Select either LAN or WAN to display the amount of data transmitted over the LAN/WAN during the selected time period. |