About the SnapMirror report
The SnapMirror report displays how much benefit SnapMirror optimization is providing for a given filer (or all filers) and traffic type in the time period specified. You view the SnapMirror report under Reports > Optimization: SnapMirror. You can use this report to view optimization outcomes for not just a filer, but also all volumes for a single filer, or a single filer for a single volume or qtree. You can drill down to specific optimization statistics for a volume or a qtree. Time Interval, Filer (Volume), Traffic Type, and Appliance options are available to customize the report.
SnapMirror captures and reports only traffic flowing in the LAN-to-WAN direction.
For information about navigating and customizing reports, see
About navigating and customizing reports.SnapMirror report
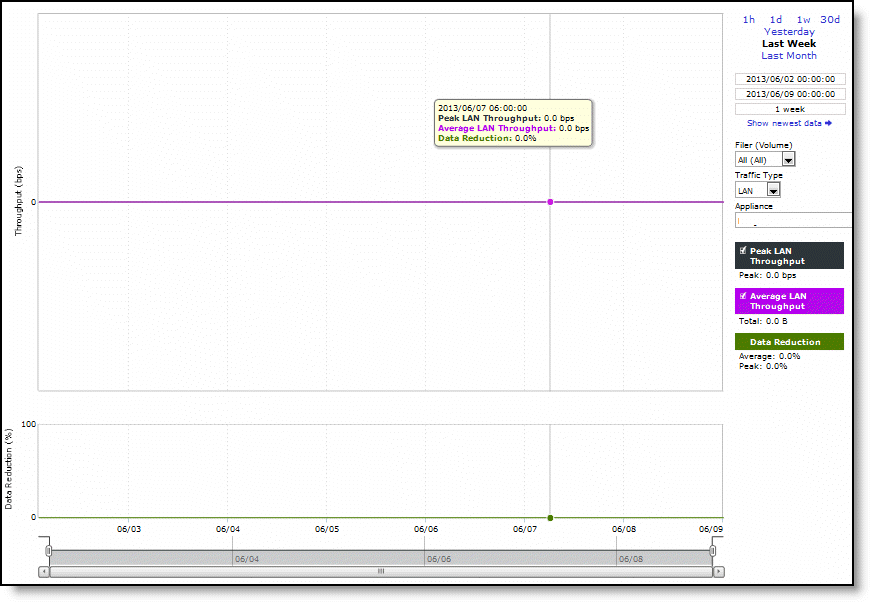
The SnapMirror report contains this information:
Peak LAN/WAN Throughput
Displays the peak LAN/WAN data activity. The system stores peak statistics in terms of bytes transferred over the LAN, but calculates the normal throughput using a granularity of 10 seconds.
Average LAN/WAN Throughput
Displays the average LAN/WAN data activity. The system stores nonpeak statistics as the number of bytes transferred over the LAN/WAN, and calculates the throughput by converting bytes to bits and then dividing the result by the granularity. For instance, if the system reports 100 bytes for a data point with a 10-second granularity, RiOS calculates:
100 bytes * 8 bits/byte / 10 seconds = 80 bps
This means that 80 bps was the average throughput over that 10-second period.
The total throughput shows the data amount transferred during the displayed time interval.
Data Reduction
Displays the percentage of total decrease in overall data transmitted (when viewing all SnapMirror filers). The system calculates data reduction as (total LAN data - total WAN data) / total LAN data.