About navigating and customizing reports
Time-series reports are designed to make data exploration easier by presenting information in a chronological layout that offers contextual insight. Reports can appear in either a single-pane or dual-pane format. In dual-pane layouts, both panes are synchronized along the x-axis, and each pane supports two y-axes—one on the left and one on the right. The plot area is the central space where data visualizations appear. Most reports use simple line graphs, but area graphs are used when appropriate. Area graphs include two types: layered series, which appear with transparent colors and overlap visually, and stacked area series, which use opaque colors to represent data components that sum to a meaningful total.
Typical report with plot area (1), control panel (2), and navigator (3)
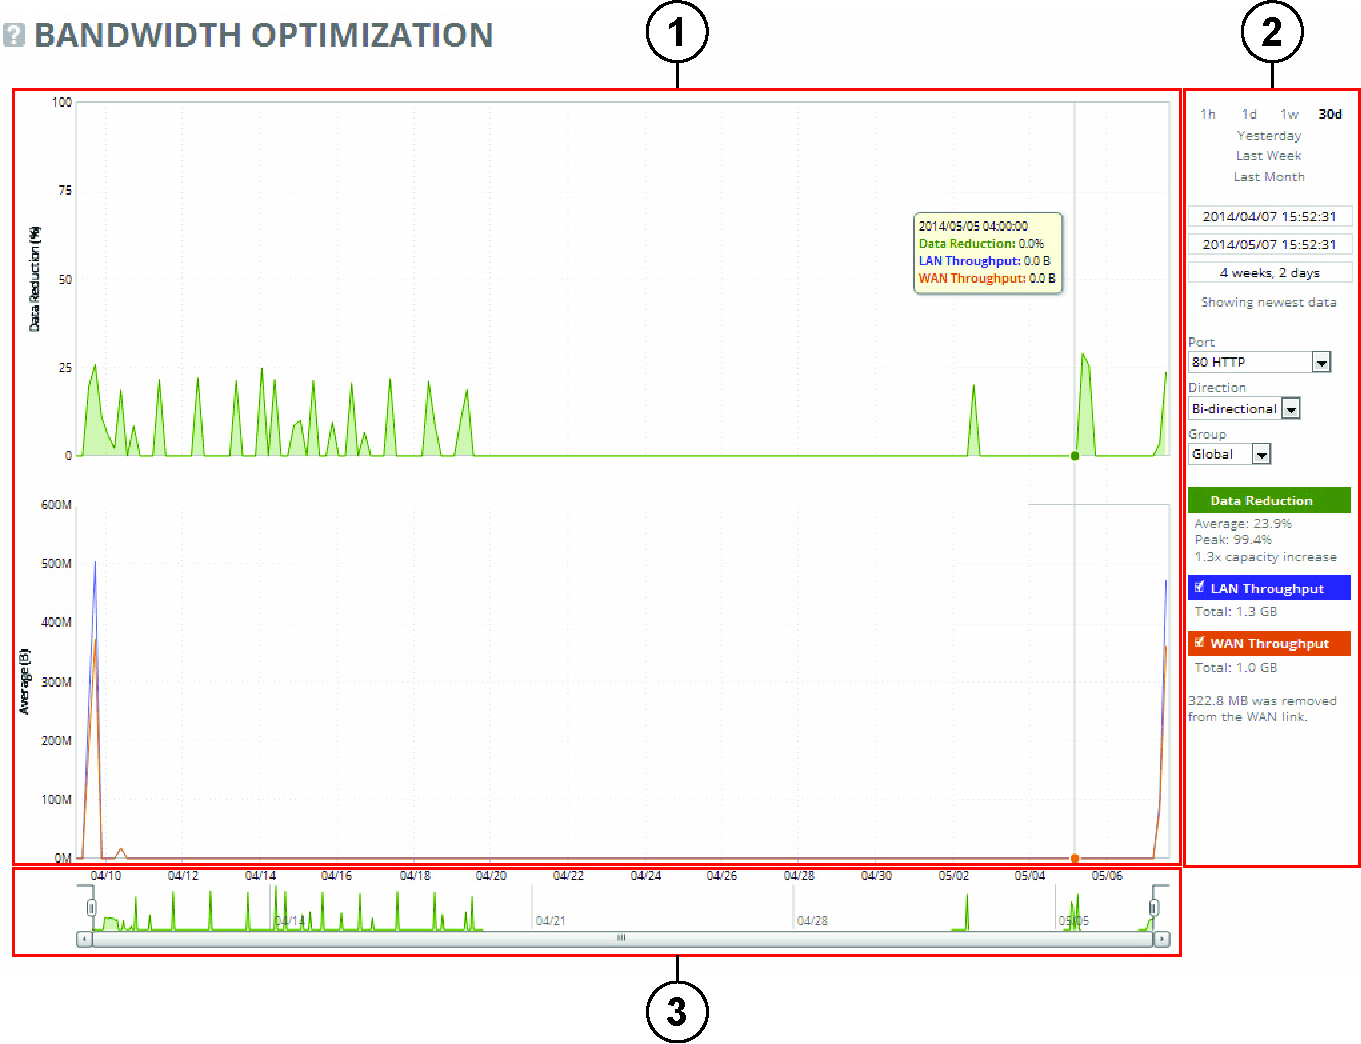
You can mouse over a specific data point to see what the y values and exact time stamp were in relation to peaks.
The control panel allows users to configure chart display options, including how much data is shown, visual properties, and the inclusion of summary statistics. Available time intervals include 1 hour, 1 day, 1 week, 30 days, Yesterday, Last Week, and Last Month. The currently active interval appears in bold, and any link representing a larger time span than the available data appears dimmed. Below the interval links, chart window controls offer precise management of the visible data range. These include fields for the chart’s start time, end time, and duration. When the chart window is attached to the most recent data, it auto-refreshes every 10 seconds—useful for monitoring live changes. If detached, a link labeled “Show newest data” allows users to reattach the window. All text fields validate inputs immediately and update the chart when changes are applied.
Custom controls appear below the chart window settings. These are report-specific and trigger a full data reload when altered. While data is reloading, the control panel becomes temporarily inactive, and an “updating” message appears in the chart area. The chart legend, found alongside the plot, displays the names and colors of each data series. Users can toggle the visibility of individual series using check boxes. The legend also shows live-updating statistics based on the current chart window, including both individual and composite values derived from multiple series.
Above the scroll bar is the navigator, a smaller display showing one data series. It provides a quick overview of the dataset and allows users to adjust the visible range by dragging or clicking. The chart window can be resized here, with a minimum size of five minutes. The display in the navigator may differ from the main chart, particularly if the selected series differs from more prominent ones shown in the main view.
All user-specific settings, including the chart window and control panel configurations, are saved automatically and persist even after logging out or closing the browser. Settings are stored per user, and a warning appears if multiple users are logged in, as preferences may be overwritten. The system remembers the most recent chart window and applies it to other reports.
While data can be retained and visualized for up to one month, the level of detail decreases as time passes due to performance and storage considerations.
When a report display includes the total classes, the data series appear as translucent; selected classes appear as opaque. The navigator shadows the total sent series. When the report display includes selected classes and remote sites, the navigator shadows the first nonempty sent series. A data series can be empty if you create a QoS class but it hasn’t seen any traffic yet.
Selecting a parent class displays its child classes. For example, the report for an HTTP class with two child classes named WebApp1 and WebApp2 displays statistics for HTTP, WebApp1, and WebApp2.
When a selected class has descendant classes, the report aggregates the statistics for the entire tree of classes. It displays the aggregated tree statistics as belonging to the selected class.