About the HTTP report
The HTTP report displays the hit rates for HTTP optimization for the time period specified. You view the HTTP report under Reports > Optimization: HTTP. Time Interval and Group options are available to customize the report.
HTTP optimization is unavailable in cloud appliances models. This feature may become available in future releases of those models.
For information about navigating and customizing reports, see
About navigating and customizing reports.HTTP report
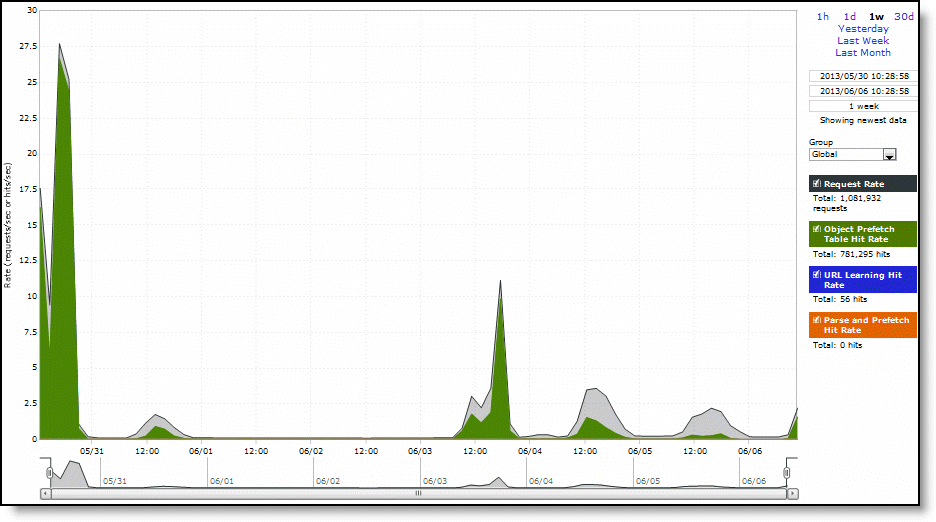
The HTTP report graph displays these statistics that summarize HTTP data activity:
Request Rate
Displays the rate of HTTP objects, URLs, and object prefetch requests.
Object Prefetch Table Hit Rate
Displays the hit rate of stored object prefetches per second. The SteelHead stores object prefetches from HTTP GET requests for cascading style sheets, static images, and Java scripts in the Object Prefetch Table.
URL Learning Hit Rate
Displays the hit rate of found base requests and follow-on requests per second. The SteelHead learns associations between a base request and a follow-on request. Instead of saving each object transaction, the SteelHead saves only the request URL of object transactions in a Knowledge Base and then generates related transactions from the list.
Parse and Prefetch Hit Rate
Displays the hit rate of found and prefetched embedded objects per second. The SteelHead determines that objects are going to be requested for a given web page and prefetches them so that they’re readily available when the client makes its requests.
The navigator shadows the object prefetch table hit rate series.