About the Dashboard
When you log in, the Dashboard appears. The Dashboard indicates system health and the system’s hostname in the upper-left corner. System health can be Healthy, Degraded, Critical, or Disabled.
The Dashboard home page (bandwidth optimization report with aggregated statistics)
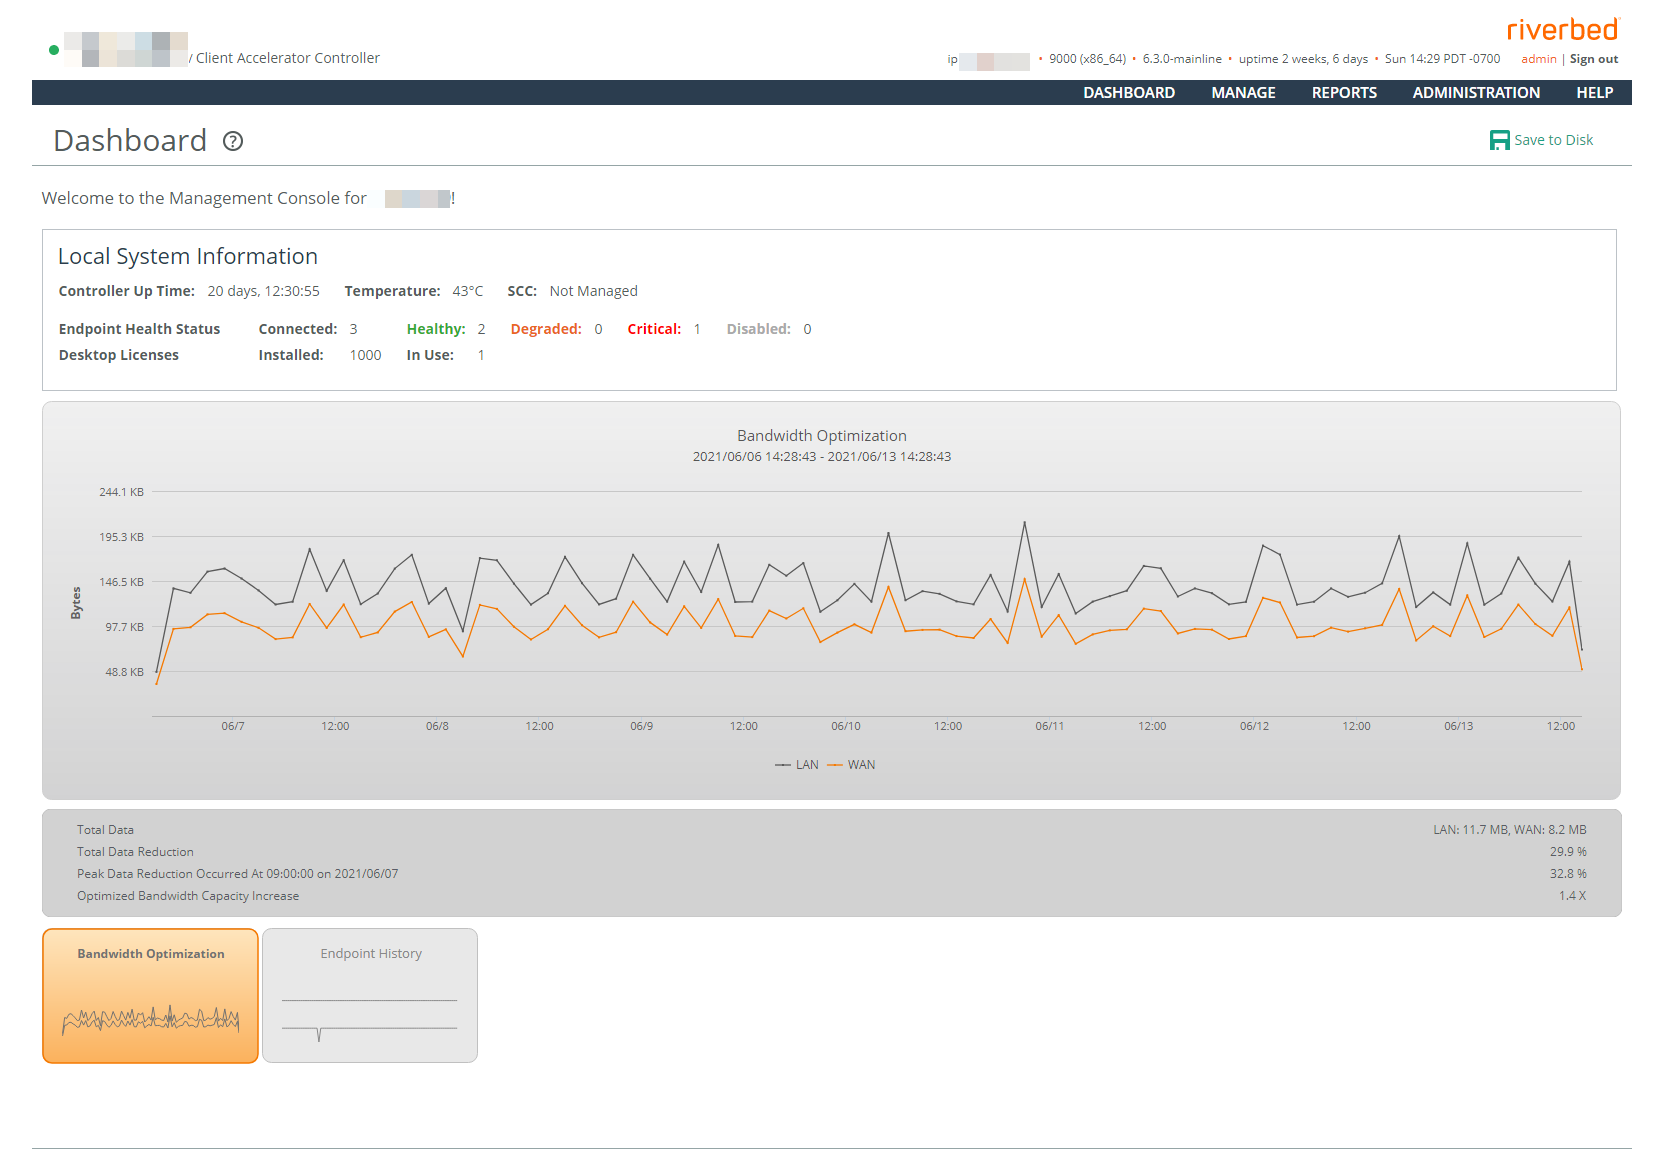
Also displayed is information about the local system, up-time, endpoint health status, and licenses. If the controller is part of a cluster, the Dashboard displays cluster-wide connection information that lists the number of controllers in the cluster, installed and free licenses, connections and licensed connections, and the status of the clients in the cluster (healthy, degraded, critical, and disabled). If you have set aggregated statistics in the Cluster page, the Dashboard displays aggregated statistics across cluster members for the selected report. If the controller is part of a cluster and you have not set aggregated statistics, the report only shows data from the current controller. For details, see
About Controller Clusters.You’ll also see these two helpful reports:
• Bandwidth Optimization—Summarizes the throughput or total data transmitted by all clients over the WAN and the LAN in the last week. This graph also shows the number of desktop licenses installed and in use.
• Endpoint History—Displays the endpoints that are connected to the controller and the licensed endpoints. By default, endpoint data for the past week is shown. This graph also shows the history of desktop endpoints.
You can print Management Console pages and reports using the print option on your web browser.
A red outline around a control indicates that the field is required. You must specify a valid entry for all of the required controls on a page before submitting the changes to the system.