macOS endpoint status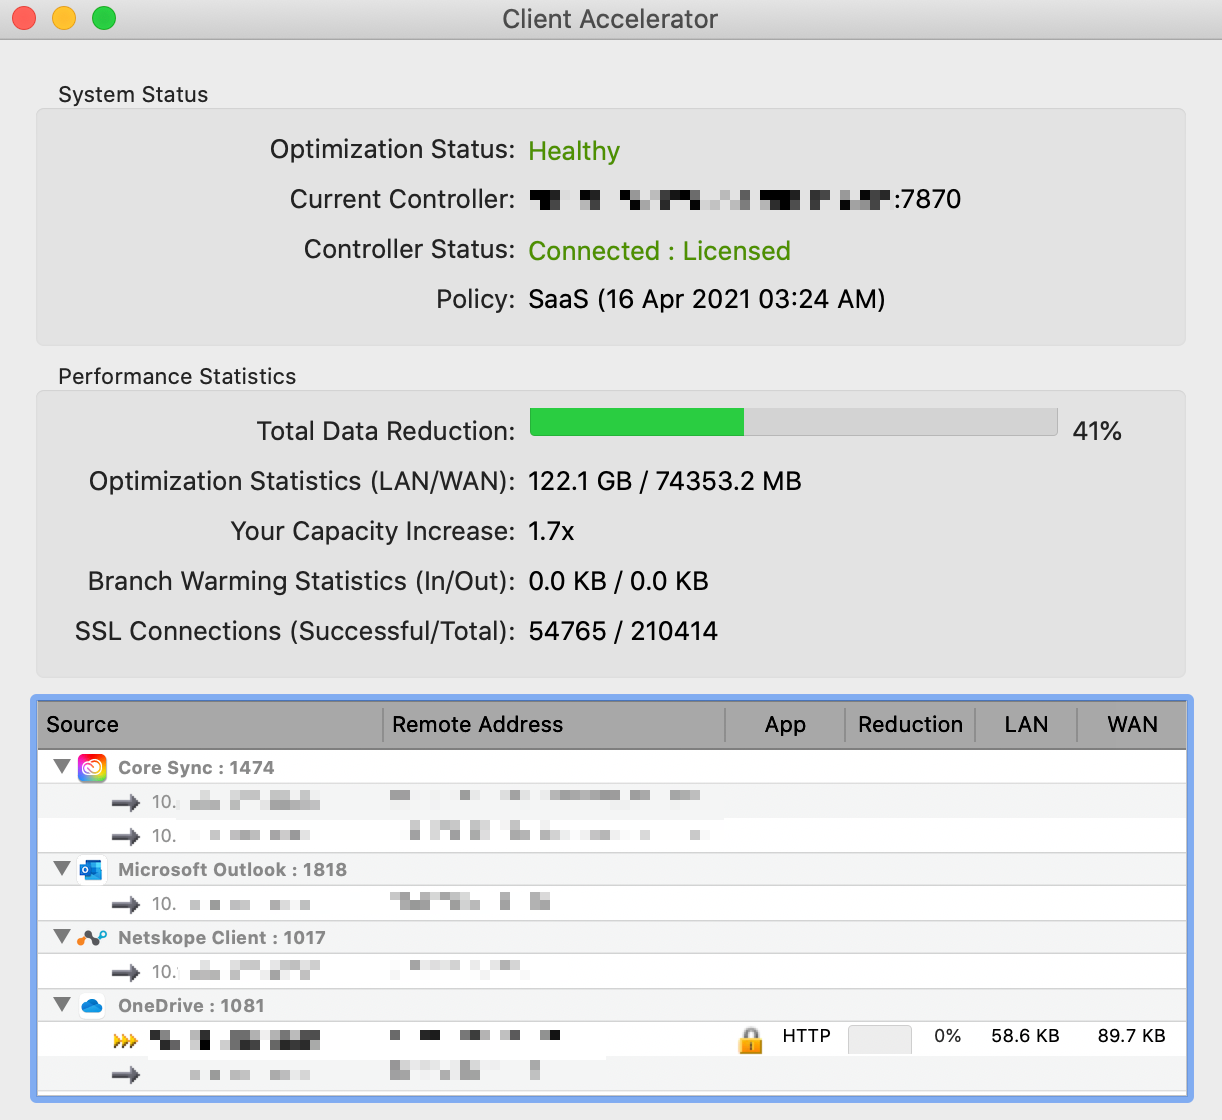
Function | Control | Description |
System Status | Optimization Status | Displays the current state of the system. The system can be in one of these states: • Initializing—Indicates that the optimization service is starting. • Healthy—Indicates that all systems are functioning properly. • Critical—Indicates that the optimization service is not running. Contact your system administrator. • Disabled—Indicates that the optimization service is turned off. |
Current Controller | Displays the controller hostname or IP address and the port that the client connects to. • Warning—Indicates that the optimization status is running, but there are some issues. Contact your system administrator. | |
Controller Status | Displays whether the service is currently Connected, Not Connected, Licensed, or Not Licensed. | |
Policy | Displays the policy currently running on the client. | |
Performance Statistics | Total Data Reduction | Displays the percent data reduction since the optimization service has been running. |
Optimization Statistics (LAN/WAN) | Displays the total amount of optimized data exchanged with peer SteelHead (for LAN/WAN). | |
Your Capacity Increase | Specifies the performance improvement as a result of data optimization. | |
Branch Warming Statistics (In/Out) | Displays the branch warming statistics. | |
SSL Connections (Successful/Total) | Displays the number of successful SSL connections. | |
Connection List | Displays the different connections. Control-click a connection and select Detect SteelHeads to find and display SteelHeads along the network path to a specified destination server. |
Yellow arrows | Displays Established (Optimized) connection. | |
Green arrow |  | Displays Established (Branch Mode) connection. |
Blue arrow | Displays Established (Branch Warming) connection. | |
Gray arrow | Displays Established (Pass-through) connection. | |
Red arrow |  | Displays Established (Optimized) connection with optimization error |
Lock icon |  | Indicates secure inner channel connections. |
Function | Control | Description |
View Log | View your current log file. | Click View Log to view your current log file. For assistance, contact your system administrator. |
Generate Sysdump | Upload system dump to your Administrator. | Click Upload System Dump to upload your system dump file to the controller. Your system administrator uses the dump file to troubleshoot your system. For assistance, contact your system administrator. |
Generate TCP Trace | Generate a TCP trace and send it to your administrator. | Click Generate to generate a TCP dump for the specified amount of time (seconds or minutes). The TCP dump is automatically sent to Client Accelerator where a system administrator can view it in the Reports tab. Use this option to troubleshoot the client system. For assistance, contact your system administrator. |
Detect SteelHeads | Find and display SteelHeads along the network path to a specified destination server. | Click Detect SteelHeads to find and display SteelHeads along the network path to a specified destination server. |
Restart Client Accelerator | Restart your Client Accelerator. | Click Restart to restart the service. This option restarts the optimization service and is a first step for troubleshooting the optimization service. |
Reset Statistics | Reset the cumulative historical statistics. | Click Reset Stats to reset the cumulative historical statistics. |
Function | Control | Description |
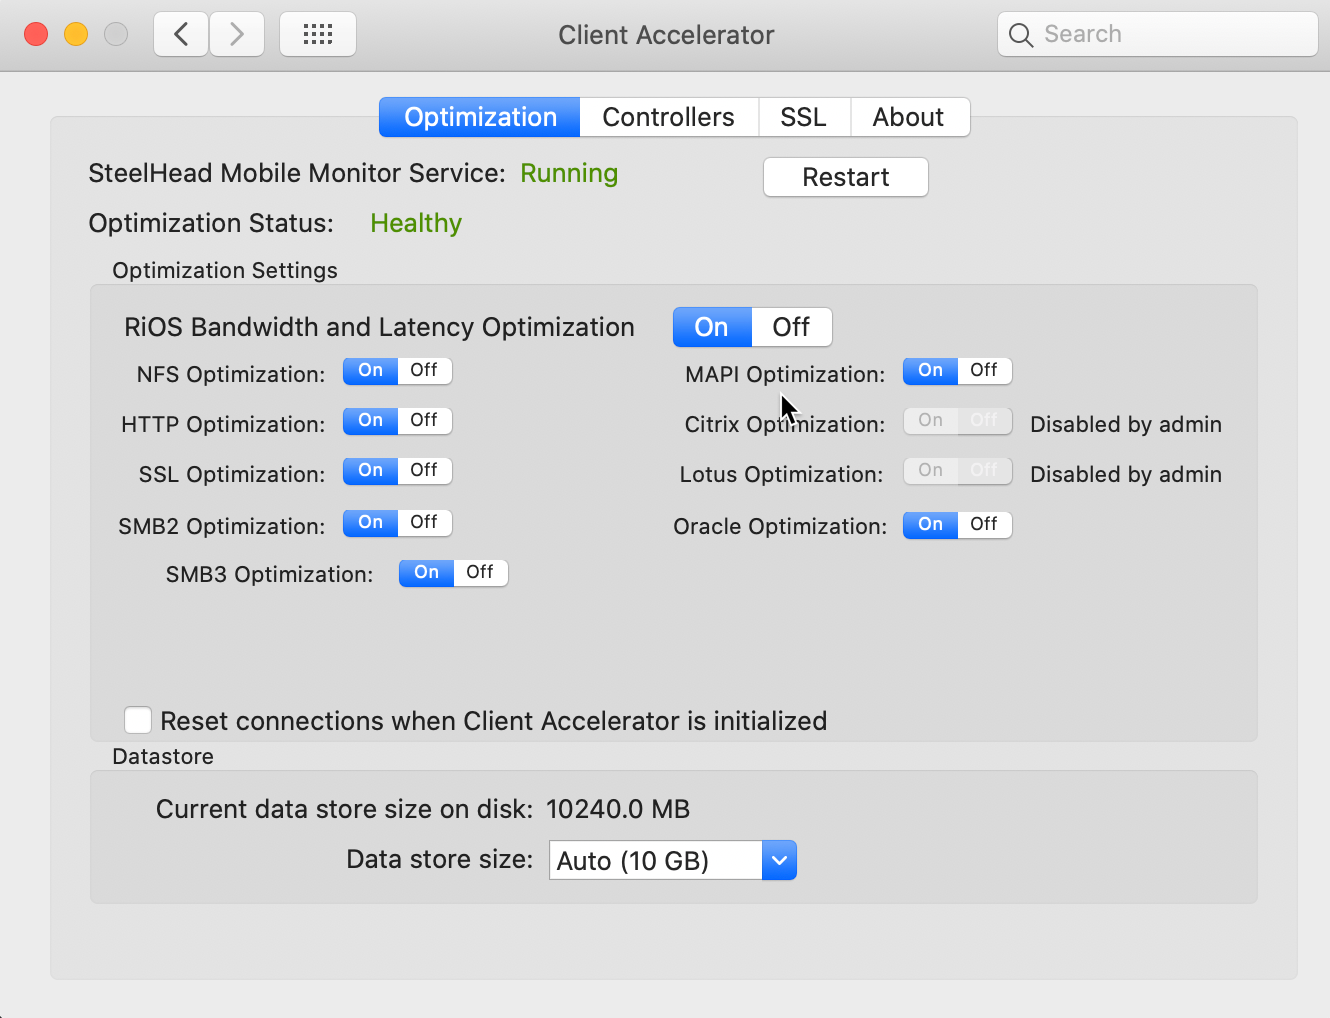
Client Accelerator Monitor Service | Indicates if the service is running or not running. | |
Restart | Click to restart the Client Accelerator Service. | |
Optimization Status | Displays the current state of the system. The Client Accelerator system can be in one of these states: • Initializing—Indicates that the optimization service is starting. • Healthy—Indicates that all systems are functioning properly. • Critical—Indicates that the optimization service is not running. Contact your system administrator. • Disabled—Indicates that the optimization service is turned off. | |
Optimization Settings | RiOS Bandwidth and Latency Optimization | Select this option to enable RiOS bandwidth optimization on the client. When enabled, all dependent check boxes appear dimmed. You can also enable and disable client optimization from the Client Accelerator icon in the system tray. |
NFS Optimization | Select this option to optimize NFS. | |
HTTP Optimization | Select this option to optimize HTTP. | |
Reset connections when initialized | Resets existing nonoptimized connections when the optimization service is restarted. | |
Data Store | Current data store size on disk | Specifies the current data store size on disk. |
Data store size | Specifies the amount of disk space allocated to the data store. |
Control | Description |
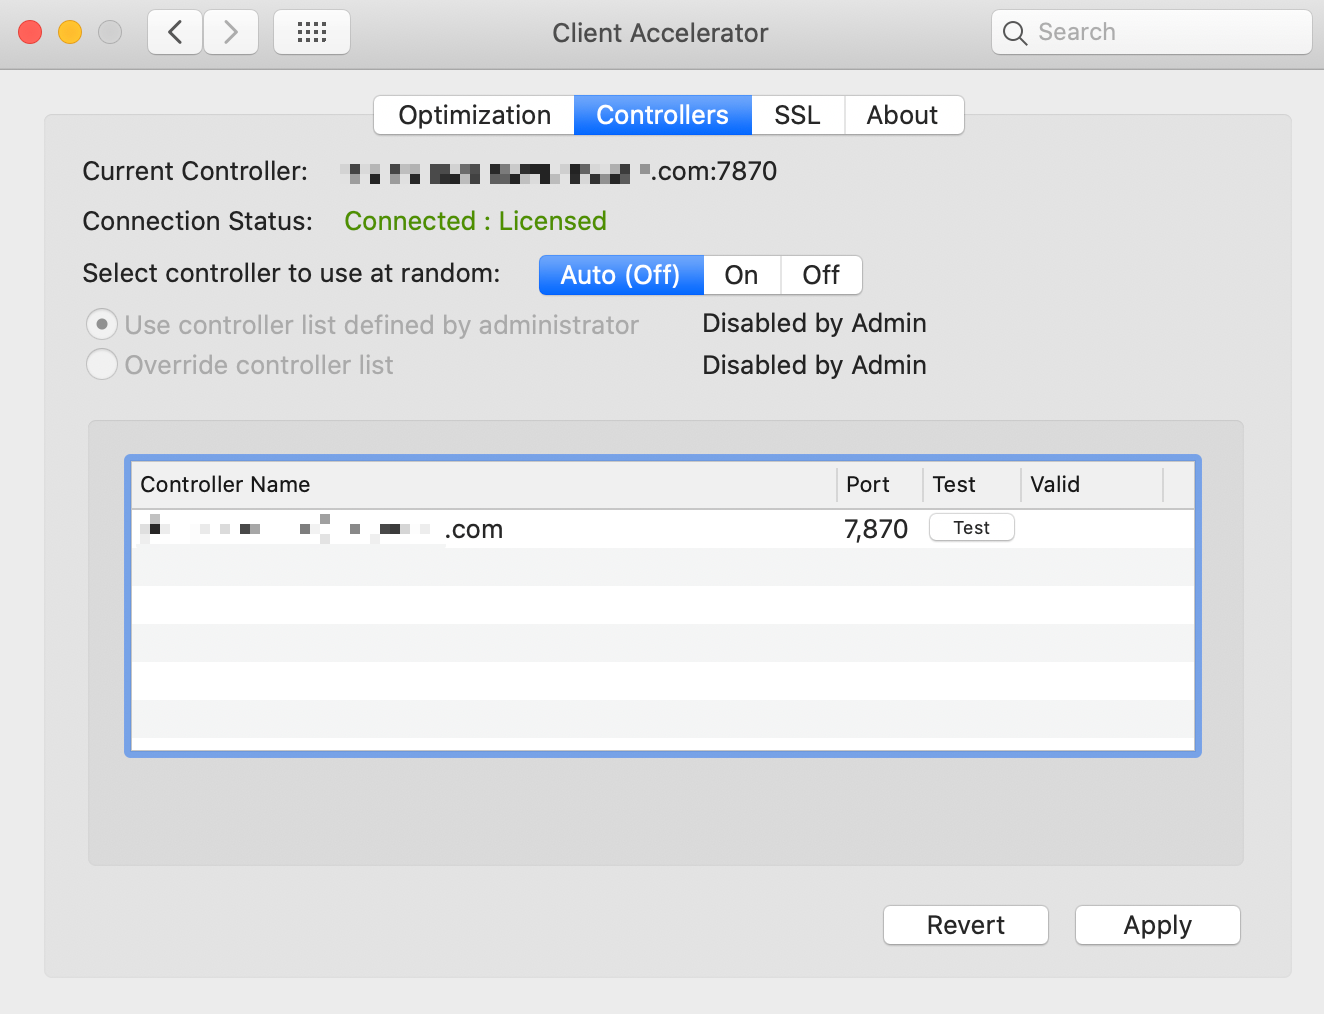
Current Controller | Specifies the controller hostname or IP address, and the port that the controller connects to. |
Connection Status | Displays the current connection status. The connection status can be in one of these states: • Connected—Indicates that the endpoint is connected to a controller but is not consuming a license. This condition may indicate, for instance, that the service in SSL Simplification mode or is not currently optimizing any connections. • Connected: Licensed—Indicates that the endpoint is connected to a controller and is consuming a license. • Connected: Denied License—Indicates that the Client Accelerator endpoint is connected to a controller but is unable to obtain a license. • Not Connected—Indicates that the endpoint is not connected to a controller. |
Select controller to use at random | If there is more than one endpoint in the list, the controller randomly connects to one of them. Use this option if you want to distribute Client Accelerator connections. This control has these options: – Auto—Enables or disables random selection of controllers as defined by the administrator in the current policy. – On—Specifies random selection of controllers. – Off—Specifies the first controller on the list. If this connection fails, the next controller on the list is selected, and so on. |
Use controller list defined by administrator | Connect to a controller listed by the system administrator in the current policy. |
Override controller list | Does not restrict the controller list to the system administrator-set specifications in the current policy. When Override controller list is selected, these additional controls are activated: • +—Click + to add a controller to the list; click - to remove one. • Test—Verifies that the user can connect to the selected controller. • Arrow keys—Use the arrows to the right of the list to change the priority order of the controllers the client connects to. The priority list is used only if Select Controller at Random is disabled. To modify a controller on the list, double-click the controller in the list. Directly editing the list is only possible when the Override controller list is selected. |
Revert | Click Revert to undo changes made to the controller configuration. |
Apply | Click Apply to save your configurations. |
Function | Control | Description |
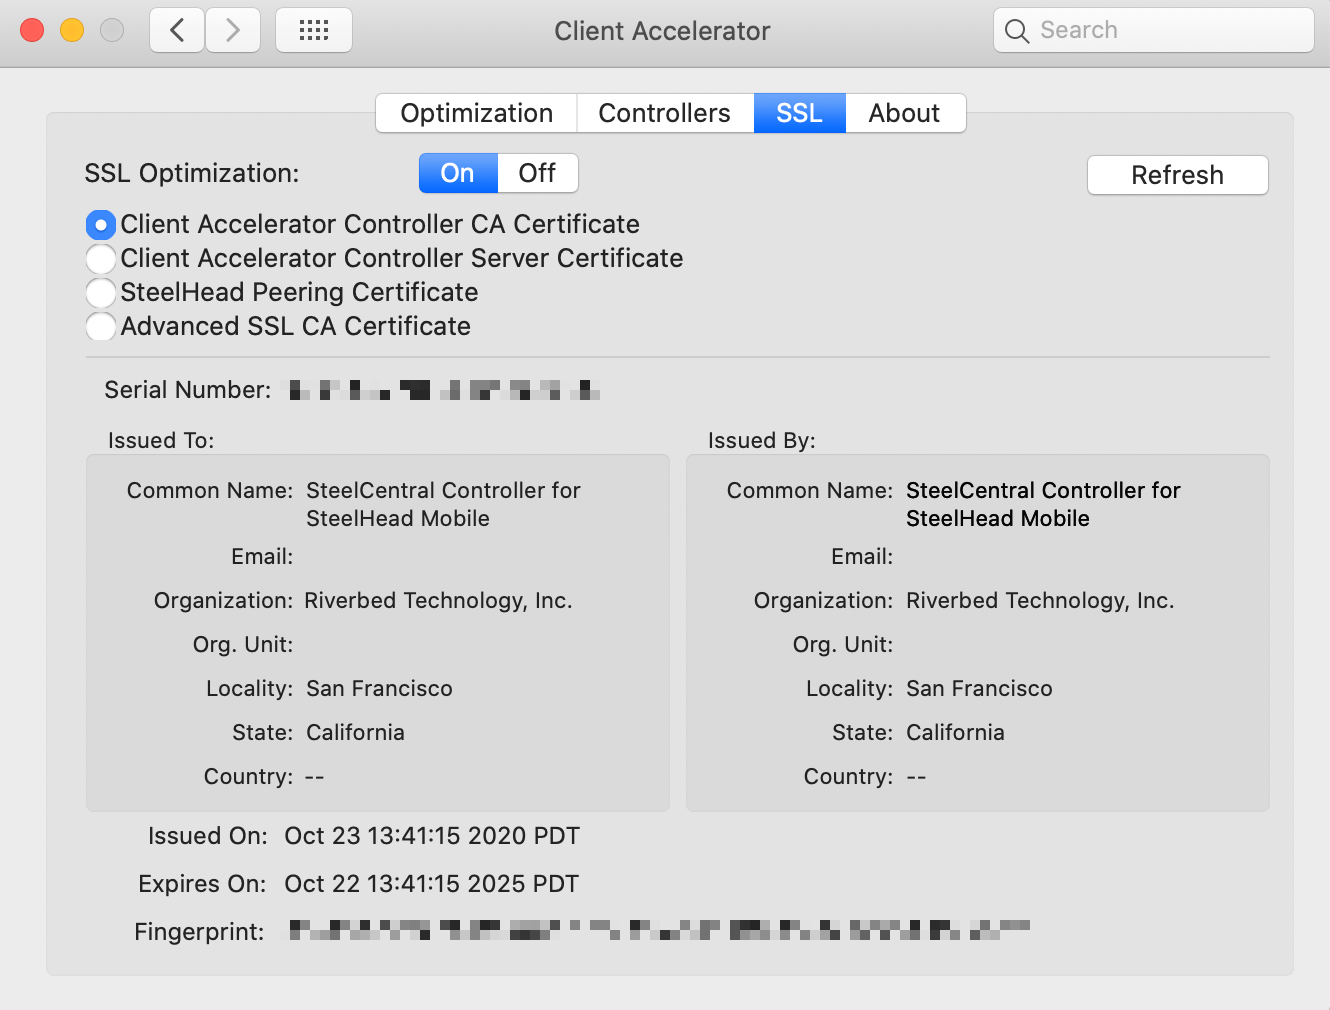
SSL optimization | Click On or Off to enable or disable SSL optimization. | |
Refresh | Click to refresh the CA information. | |
Certificates | This list of certificates is displayed: • Client Accelerator Controller CA Certificate • Client Accelerator Controller Server Certificate • SteelHead Peering Certificate—Regenerates when you click Regenerate while the optimization is enabled. This button is dimmed when optimization on the client is disabled or when a controller is not connected. • Advanced SSL CA Certificate | |
Certificate Details | Displays this information based on the certificate option selected above: • Serial Number—Displays the serial number (Issued To, only). • Issued To/Issued By—Displays this information: – Common Name—Displays the common name of the certificate authority. – Organization—Displays the organization name (for example, the company). – Org. Unit—Displays the organizational unit within the organization. – Locality—Displays the city. – State—Displays the state. – Country—Displays the country (2-letter code only). • Issued On—Displays the date the certificate was issued. • Expires On—Displays the date the certificate expires. • Fingerprint—Displays the fingerprint. |