Figure: Setting Logging
Control | Description |
Minimum Severity | Select the minimum severity level for the system log messages. The log contains all messages with this severity level or higher. Select one of these levels from the drop-down list: • Emergency - The system is unusable; action must be taken immediately. • Alert - Action must be taken immediately. • Critical - Conditions that affect the functionality of the SteelHead. • Error - Conditions that probably affect the functionality of the SteelHead. • Warning - Conditions that could affect the functionality of the SteelHead, such as authentication failures. • Notice - Normal but significant conditions, such as a configuration change. This is the default setting. • Info - Informational messages that provide general information about system operations. Note: This control applies to the system log only. It does not apply to the user log. |
Maximum Number of Log Files | Specify the maximum number of logs to store. The default value is 10. |
Lines Per Log Page | Specify the number of lines per log page. The default value is 100. |
Rotate Based On | Specifies the rotation option: • Time - Select Day, Week, or Month from the drop-down list. The default setting is Day. • Disk Space - Specify how much disk space, in megabytes, the log uses before it rotates. The default value is 16 MB. Note: The log file size is checked at 10-minute intervals. If there is an unusually large amount of logging activity, it is possible for a log file to grow larger than the set disk space limit in that period of time. |
Apply | Applies your setting to the running configuration. |
 .
.Control | Description |
Add a New Log Server | Displays the controls for configuring new log servers. |
Server IP or Hostname | Specify the server IP address. |
Minimum Severity | Select the minimum severity level for the log messages. The log contains all messages with this severity level or higher. Select one of these levels from the drop-down list: • Emergency - The system is unusable; action must be taken immediately. • Alert - Action must be taken immediately. • Critical - Conditions that affect the functionality of the SteelHead. • Error - Conditions that probably affect the functionality of the SteelHead. • Warning - Conditions that could affect the functionality of the SteelHead, such as authentication failures. • Notice - Normal but significant conditions, such as a configuration change. This is the default setting. • Info - Informational messages that provide general information about system operations. |
Add | Adds the server to the list. |
Remove Selected | Select the check box next to the name and click Remove Selected. |
Control | Description |
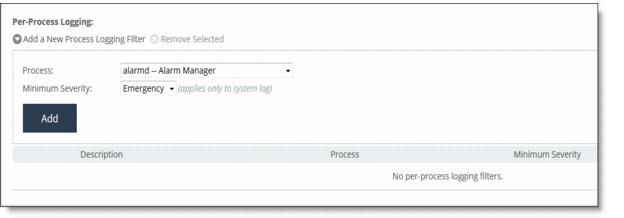
Add a New Process Logging Filter | Displays the controls for adding a process level logging filter. |
Process | Select a process to include in the log from the drop-down list: • alarmd - Alarm control and management. • cifs - CIFS Optimization. • cmcfc - CMC automatic registration utility. • rgp - SCC connector, which handles SCC appliance communication. • rgpd - SCC client daemon, the connection manager. • cli - Command-line interface. • mgmtd - Device control and management, which directs the entire device management system. It handles message passing between various management daemons, managing system configuration and general application of system configuration on the hardware underneath through the Hardware Abstraction Layer Daemon (HALD). • http - HTTP optimization. • hald - Hardware Abstraction Layer Daemon, which handles access to the hardware. • notes - Lotus Notes optimization. • mapi - MAPI optimization. • nfs - NFS optimization. • pm - Process Manager, which handles launching of internal system daemons and keeps them up and running. • sched - Process Scheduler, which handles one-time scheduled events. • virtwrapperd - VSP VMWare interface. • vspd - VSP Watchdog. • statsd - Statistics Collector, which handles queries and storage of system statistics. • wdt - Watchdog Timer, the motherboard watchdog daemon. • webasd - Web Application Process, which handles the web user interface. • domain auth - Windows Domain Authentication. |
Minimum Severity | Select the minimum severity level for the log messages. The log contains all messages with this severity level or higher. Select one of these levels from the drop-down list: • Emergency - The system is unusable; action must be taken immediately. • Alert - Action must be taken immediately. • Critical - Conditions that affect the functionality of the SteelHead. • Error - Conditions that probably affect the functionality of the SteelHead. • Warning - Conditions that could affect the functionality of the SteelHead, such authentication failures. • Notice - Normal but significant conditions, such as a configuration change. • Info - Informational messages that provide general information about system operations. |
Add | Adds the filter to the list. The process now logs at the selected severity and higher level. |
Remove Selected | Select the check box next to the name and click Remove Selected to remove the filter. |