Figure: SnapMirror Report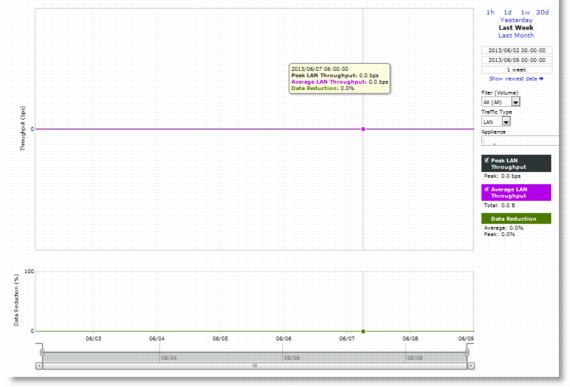
Field | Description |
Peak LAN/WAN Throughput | Displays the peak LAN/WAN data activity. The system stores peak statistics in terms of bytes transferred over the LAN, but calculates the normal throughput using a granularity of 10 seconds. |
Average LAN/WAN Throughput | Displays the average LAN/WAN data activity. The system stores nonpeak statistics as the number of bytes transferred over the LAN/WAN, and calculates the throughput by converting bytes to bits and then dividing the result by the granularity. For instance, if the system reports 100 bytes for a data point with a 10-second granularity, RiOS calculates: 100 bytes * 8 bits/byte / 10 seconds = 80 bps This means that 80 bps was the average throughput over that 10-second period. The total throughput shows the data amount transferred during the displayed time interval. |
Data Reduction | Specifies the percentage of total decrease in overall data transmitted (when viewing all SnapMirror filers). The system calculates data reduction as (total LAN data - total WAN data) / total LAN data. |
Control | Description |
Time Interval | Select a report time interval of 1 hour (1h), 1 day (1d), 1 week (1w), 30 days (30d), yesterday, last week, or last month. Time intervals that do not apply to a particular report are dimmed. For a custom time interval, enter the start time and end time using the format YYYY/MM/DD HH:MM:SS. Because the system aggregates data on the hour, request hourly time intervals. For example, setting a time interval to 08:30:00 to 09:30:00 from 2 days ago does not create a data display, whereas setting a time interval to 08:00:00 to 09:00:00 from 2 days ago will display data. When you request a custom time interval to view data beyond the aggregated granularity, the data is not visible because the system is no longer storing the data. For example, the following custom time intervals do not return data because the system automatically aggregates data older than 7 days into 2-hour data points: • Setting a 1-hour time period that occurred 2 weeks ago. • Setting a 75-minute time period that occurred more than 1 week ago. You can quickly see the newest data and see data points as they are added to the chart dynamically. To display the newest data, click Show newest data. |
Filer (Volume) | Select a filer from the drop-down list to view detailed statistics on that filer or select all to view statistics on all filers. You can use data reduction information to fine-tune the optimization settings for that filer. The SteelHead automatically identifies and summarizes information by filer based on the SnapMirror traffic seen by the appliance. Peak lines appear after one hour for filer detail reports. When viewing all volumes for a single filer, the report stacks the throughput series because the sum (total throughput of all volumes) is meaningful. When there are more volumes than colors, the report reuses the colors, starting again from the beginning of the list. |
Traffic Type | Select either LAN or WAN to display the amount of data transmitted over the LAN/WAN during the selected time period. |
Appliance | Select an appliance from the drop-down list. |