Viewing SRDF Reports
The SRDF report presents information regarding optimized throughput and data reduction for EMC's Symmetrix Remote Data Facility (SRDF) protocol. The report measures only LAN-side traffic on an encoding appliance. You can view a summary of performance statistics for all optimized SRDF traffic, as well as drill into metrics for a specific EMC Symmetrix array or an individual remote data facility (RDF) group within an array.
For details about operating report controls, see
Overview.
Note: You can also check the total optimized SRDF traffic throughput by viewing the Reports > Optimization: Optimized Throughput report.
The SRDF report contains the following information.
Data Series | Description |
Data Reduction | Specifies the percentage of total decrease in overall data transmitted (when viewing all Symmetrix RDF groups). |
WAN/LAN Throughput | Specifies the total throughput transmitted over the WAN and LAN. |
When the report display includes all Symmetrix RDF group or a single RDF group for a single Symmetrix ID, the navigator shadows the LAN/WAN throughput series. When the report display includes all RDF groups for a single Symmetrix ID, navigator shadows the group 1 LAN/WAN throughput series.
What This Report Tells You
The SRDF report answers these questions:
• How much total SRDF traffic is processing over time?
• How much data reduction is being delivered overall?
• How much data reduction is being delivered for individual RDF groups?
• that Symmetrix array is generating the most SRDF traffic?
• How are SRDF traffic patterns changing over time?
About Report Graphs
Use the mouse to hover over a specific data point to see the y values and exact time stamp were in relation to peaks.
About Report Data
The Riverbed system reports for periods up to one month. Due to performance and disk space considerations, data representation in reports for periods longer than the latest five minutes are interpolated between data points obtained by aggregating more than one 10-second sample. The display granularity decreases with time passed since data was sampled.
For detailed information about data grouping, see
Data Grouping.
To view the SRDF report
1. Choose Reports > Optimization: SRDF to display the SRDF page.
Figure: SRDF Report
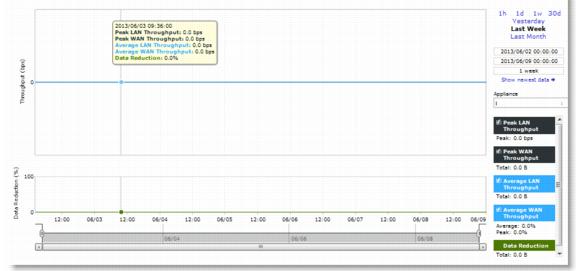
2. Use the controls to customize the report as described in this table.
Control | Description |
Time Interval | Select a report time interval of 1 hour (1h), 1 day (1d), 1 week (1w), 30 days (30d), yesterday, last week, or last month. Time intervals that do not apply to a particular report are dimmed. For a custom time interval, enter the start time and end time using the format YYYY/MM/DD HH:MM:SS. Because the system aggregates data on the hour, request hourly time intervals. For example, setting a time interval to 08:30:00 to 09:30:00 from 2 days ago does not create a data display, whereas setting a time interval to 08:00:00 to 09:00:00 from 2 days ago will display data. When you request a custom time interval to view data beyond the aggregated granularity, the data is not visible because the system is no longer storing the data. For example, the following custom time intervals do not return data because the system automatically aggregates data older than 7 days into 2-hour data points: • Setting a 1-hour time period that occurred 2 weeks ago. • Setting a 75-minute time period that occurred more than 1 week ago. You can quickly see the newest data and see data points as they are added to the chart dynamically. To display the newest data, click Show newest data. |
Appliance | Select an appliance from the drop-down list. |