Figure: CPU Utilization Report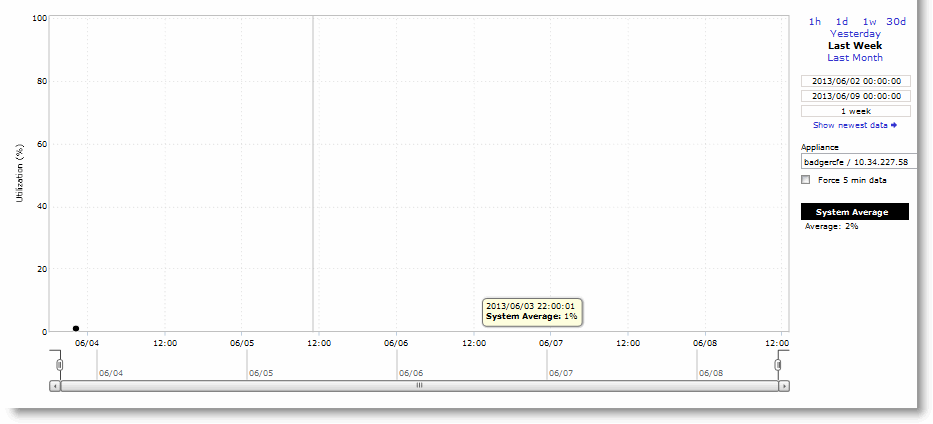
Control | Description |
Time Interval | Select a report time interval of 1 hour (1h), 1 day (1d), 1 week (1w), 30 days (30d), yesterday, last week, or last month. Time intervals that do not apply to a particular report are dimmed. For a custom time interval, enter the start time and end time using the format YYYY/MM/DD HH:MM:SS. You can quickly see the newest data and see data points as they are added to the chart dynamically. To display the newest data, click Show newest data. |
Appliance | Select an appliance from the drop-down list. |
Force best granularity | Select the check box to force the data. |
Control | Description |
Export To | Select either the Email or URL option from the drop-down list. |
Email Addresses | (Only displays when Email is selected.) Specify the email address of the recipient. |
Email Subject | (Only displays when Email is selected.) Specify the subject. |
Destination URL | (Only displays when URL is selected.) Specify the URL. |
Format | Select HTML, CSV, or PDF from the drop-down list. |
Per Appliance Report | Enables appliance report settings. Note: Generates graphs per appliance for HTML/PDF reports. Note: Generates one CSV per appliance for CSV reports. |
Export Now | Select Export Now and click Export to start the export immediately. |
Schedule Export | Select Schedule Export and specify the start date, time, and frequency of the export. Use this format: YYYY/MM/DD HH:MM:SS |
Export | Click Export to export the configuration. |
Printable view | Displays the print menu. |