Figure: Connection Pooling Report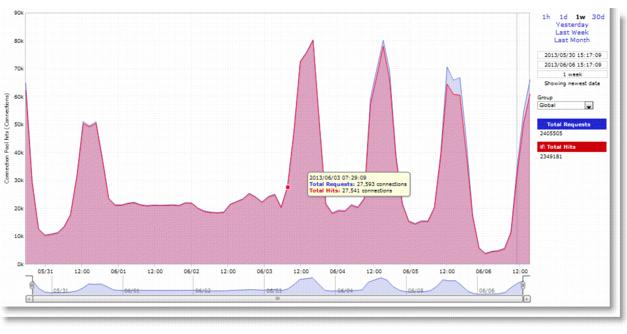
Field | Description |
Total Requests | Specifies the total number of requests for connections to peer appliances. |
Total Hits | Specifies the total number of successful connections and connections that are serviced by already existing inner channel connections. |
Connection Pool hits (Connections) | Specifies the total number of successful connections and connections that are serviced by already existing inner channel connections. The connection pool holds many idle TCP connections up to the maximum pool size. When a client requests a new connection to a previously visited server, the pool manager checks the pool for unused connections, returns one if available, and then replenishes the pool with another idle connection. |
Control | Description |
Time Interval | Select a report time interval of 1 hour (1h), 1 day (1d), 1 week (1w), 30 days (30d), yesterday, last week, or last month. Time intervals that do not apply to a particular report are dimmed. For a custom time interval, enter the start time and end time using the format YYYY/MM/DD HH:MM:SS. You can quickly see the newest data and see data points as they are added to the chart dynamically. To display the newest data, click Show newest data. |
Group | Select the group from the drop-down list. |