Viewing Top Talkers Reports
The Top Talkers report displays the top talking hosts on a per-port basis for the time period specified. The traffic flows that generate the heaviest use of WAN bandwidth are known as the Top Talkers. This report provides WAN visibility for traffic analysis, security monitoring, accounting, load balancing, and capacity planning. It can include both optimized and pass-through traffic.
A traffic flow consists of data sent and received from a first single IP address and port number to a second single IP address and port number over the same protocol. Only traffic flows that start in the selected time period are shown in the report.
The Top Talkers report doesn’t include IPv6 traffic.
Note: The Top Talkers report includes bytes used for packet headers and is an approximation based on various assumptions.
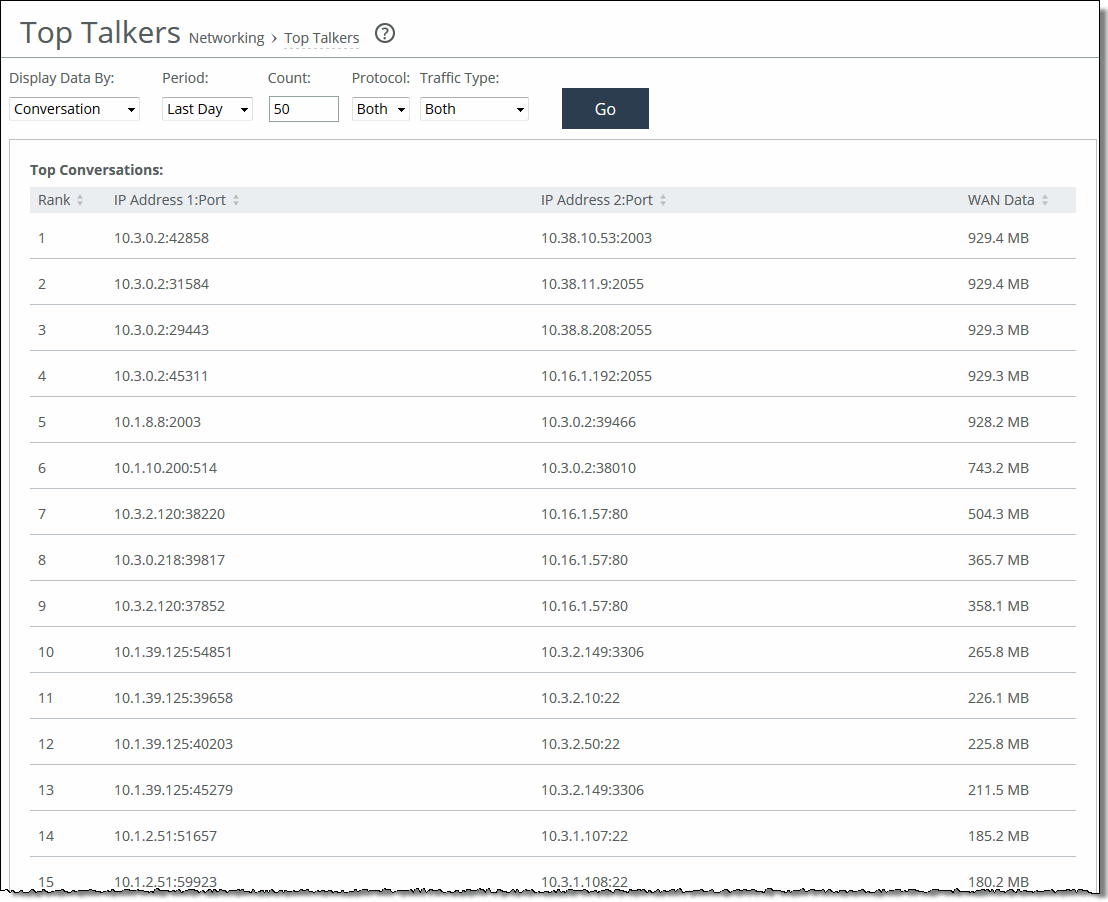
The Top Talkers report contains this table of statistics that summarize Top Talker activity.
Column | Description |
Rank | Displays the relative position of the traffic flow WAN bandwidth use. |
<Sender> IP Address 1:Port | Displays the first IP address and port for the connection. |
<Receiver> IP Address 2:Port | Displays the second IP address and port for the connection. |
Byte Count | Displays the total number of bytes sent and received by the first IP address. |
You can export this report in CSV format in the Export report. The CSV format allows you to easily import the statistics into spreadsheets and databases. You can open the CSV file in any text editor. For details, see
Exporting Performance Statistics.
What This Report Tells You
The Top Talkers report answers this question:
• Who were the top talking hosts on a per-port basis?
About Report Data
The Riverbed system reports on performance for periods up to one month. Due to performance and disk space considerations, the display granularity decreases with time passed since the data was sampled. The data is collected at a 5-minute granularity for the entire month.
To view the Top Talkers report
1. Choose Reports > Networking: Top Talkers to display the Top Talkers page.
Figure: Top Talkers Page

2. Use the controls to customize the report as described in this table.
Control | Description |
Chart | Select the report display from the drop-down list: By Conversation, By Sender, By Receiver, By Host, or By Application Port. The default setting is By Conversation. |
Period | You can view the traffic statistics for the past hour, the past 24 hours, or all available hours. All is the default setting, which displays statistics for the entire duration the SteelHead has gathered statistics. This duration can be up to 2 days, depending on how long the service has been up and the traffic volume. Select All, Last Hour, or Last Day from the drop-down list. The default setting is All. Note: Top Talker statistics aren’t persistent between service restarts. |
Count | Specify how many top pairs of IP addresses and ports with the highest total traffic (sent and received) appear in the report. Each pair shows the number of bytes and packets sent and received at IP address 1. The default value is 50. Note: You can export the complete list of top talkers to a file in CSV format using the Export report. |
Protocol | Select Both, TCP, or UDP from the drop-down list. The default value is Both. |
Traffic Type | Select Both, Optimized, or Passthrough from the drop-down list. The default value is Both. |
Go | Displays the report. |
Note: The Top Talkers data doesn’t exactly match the Traffic Summary data, the Bandwidth Optimization data, or specific connection data that appears when you select a particular connection in the Current Connections report. This variation is due to packet headers, packet retransmits, and other TCP/IP effects that flow export collectors see, but RiOS doesn’t. Consequently, the reports are proportional but not equivalent.
Note: Select a Top Talkers report column heading to sort the column in ascending or descending order.


