Network Visibility
This topic describes how to view network devices and users in SCM.
A clear picture of your network
Do you know exactly what’s in your network, even if it’s not passing through a gateway? Are you constantly dealing with users bringing in new devices? Are contractors doing work in your offices or your network room? Do you know what devices are consuming the most traffic?
Visibility is crucial to security. You absolutely can’t protect what you don’t know about. With SCM, you always have a clear picture of your network. By deploying a centrally managed system of products designed from the ground up to work together, you are able to see everything.
SteelConnect Manager provides the Visibility page where you can read logs, view a history of the DHCP server IP address assignments, see if and where traffic was blocked, and also generate user reports.
For an alternative way to see network details, see
SteelCentral Insights for SteelConnect overview.
Viewing network devices and users
SCM allows, but does not force, management of multiple network devices. A device is anything with a MAC address. A device differs from a SteelConnect appliance, which can be a gateway, switch, or access point that connects to SCM.
SCM automatically detects new devices. You’ll know which devices are connected to your company, networkwide, in real time. You’ll instantly be made aware of new devices, and you’ll be able to see where each device goes and who it belongs to.
Complete device management is the foundation for policy controls, because it enables you to apply policy rules to devices instead of IP networks or zones. See
Viewing devices.
Network visibility provides this information to manage network workflow:
•An activity log by user and application
•DHCP address assignment
•IP address by user
•IP address by device
•User location and Wi-Fi information
•Full visibility into what’s occurring in the network, in real time
•Any blocked connections
•A list of unknown, detected devices with their OS, vendor, and owner information, if it’s available
To view unregistered devices
•Choose Devices > Unregistered.
The console shows all the unregistered devices. You can then configure and assign devices to users or groups of users.
To view an inventory of all registered devices on the network
1. Choose Devices.
The Registered Devices overview page displays all registered devices along with their status as reported within the last five minutes. For the most accurate device status, select the device and select the Info tab.
2. Click a device to view its user, location, IP address, and so on.
To view all network users
•Choose Users.
•You can search by name to view all devices owned by a particular user.
•You can allow users to add their own devices that use a predefined and preapproved security policy.
Viewing a traffic timeline
To view a traffic timeline
1. Choose Visibility > Traffic Timeline.
The traffic timeline provides network visibility
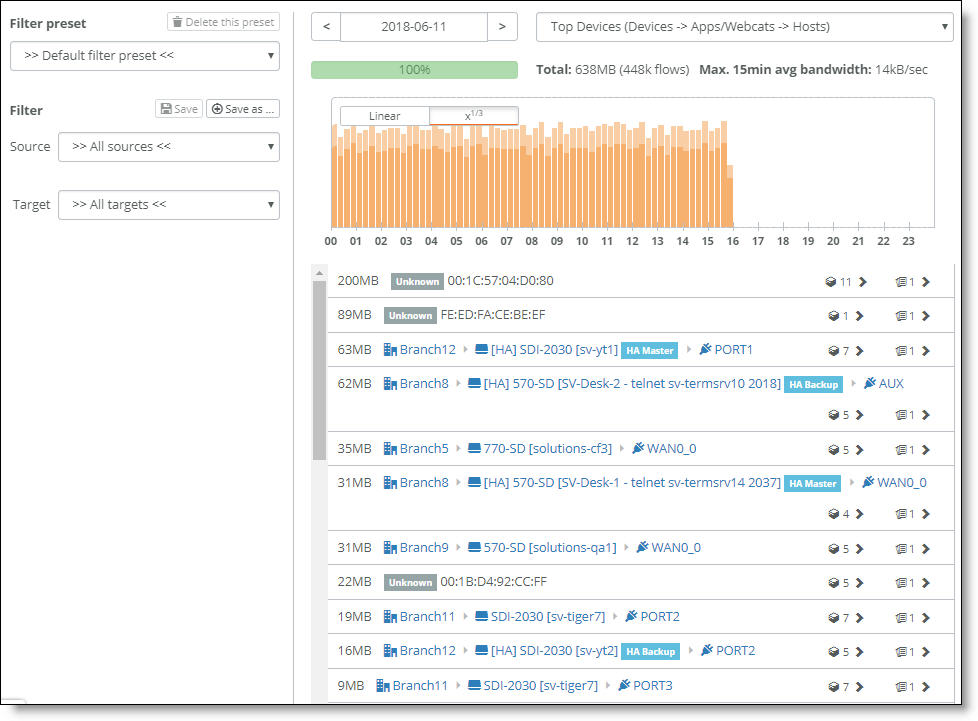
The timeline shows you everything that happened today in the network for a particular site or companywide.
2. Filter to view all the traffic for your headquarters, all the devices, and all the hosts accessed during the day.
3. To view activity by application groups, such as all social networking activity, choose the group: for example, Social Networking.
4. To view a certain slice of the day to identify the cause of traffic spikes or other anomalies, click the traffic activity graph.
Click and drag the mouse to select multiple slices.
Viewing the event log
You can use the event log to track a number of events occurring across a network; for example, you can track exactly which user has done what at what time, or you can monitor the link state for online appliances. The event log reports on events approximately every 5 seconds.
The event log does not receive events while an appliance is offline.
To view configuration changes
•Select Visibility > Event Log.
The event log tracks administrator activity and appliance link state
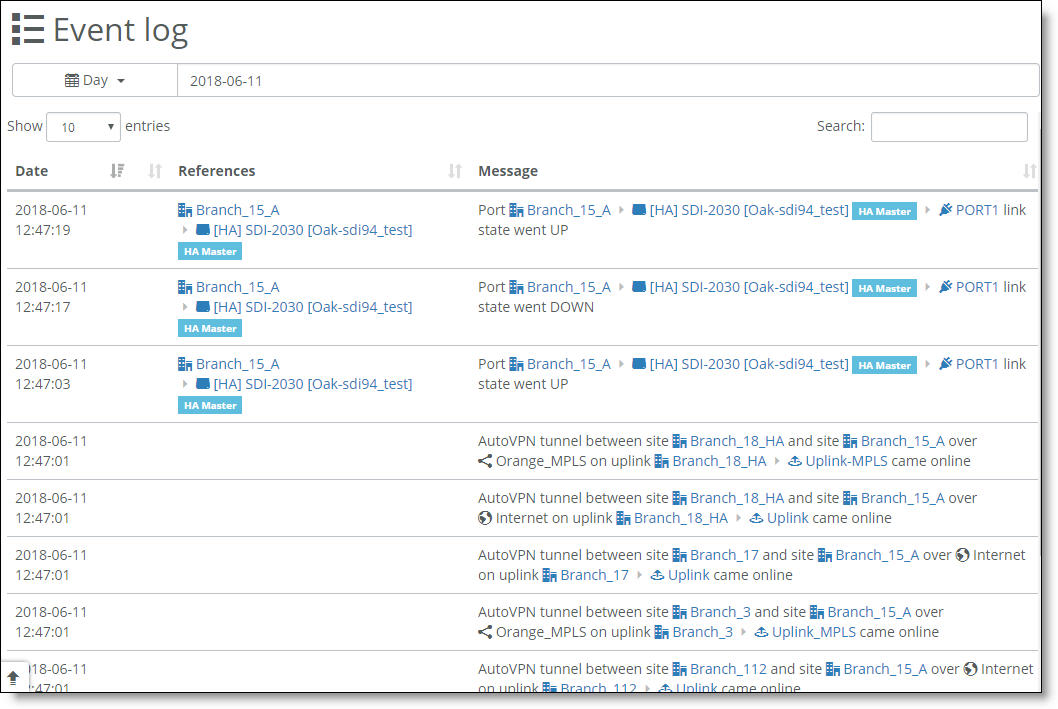
A log displays all activity performed by system administrators in any office and in any location. The event log conveys a lot of information about events SCM is detecting. The best way to narrow the log is to use the search field.
Because a tunnel is always bidirectional, the log message “AutoVPN tunnel between X and Y came online” also means the tunnel between Y and X came online.
Viewing site status
The Troubleshooting page shows all sites belonging to an organization. You can use this page to troubleshoot a gateway.
To view gateway status
1. Select Visibility > Troubleshooting.
Gateway troubleshooting
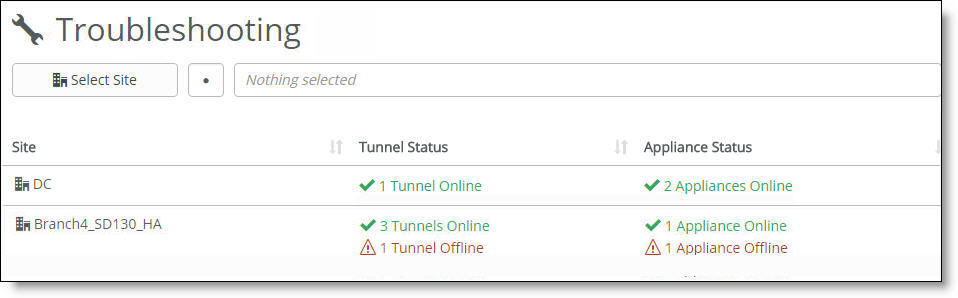
2. Select at least one site.
•Click the search selector for a list of sites and select a site from the list.
3. Select the Gateways tab.
Gateways by site
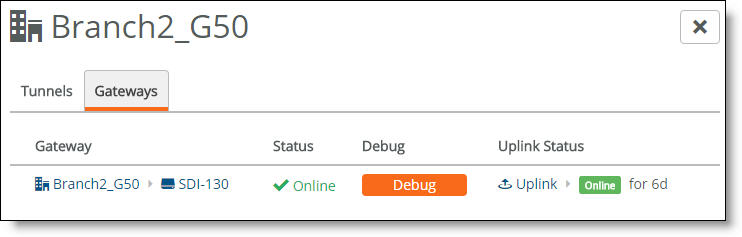
The page lists all gateways for a particular site.
You can select a gateway to pinpoint any issues or click the Debug button to request and view a Support package. If the gateways are online with no problems, select any uplinks that might be the source of the problem. If all gateways and uplinks are online, the Tunnels tab displays the tunnels.
Clicking the
Debug button displays the appliance Debug tab. For details, see
Support package.
4. Select the Tunnels tab.
Viewing WAN path status
The WAN Paths page shows all VPN tunnels created by SCM. You can sort details on the tunnels per WAN, per destination, per source, or any combination.
To view WAN path status
1. Select Visibility > WAN Paths.
2. Select at least one category: source site, destination site, or WAN.
•Click the search selector for a list of sites or WANs and select an item from the list.
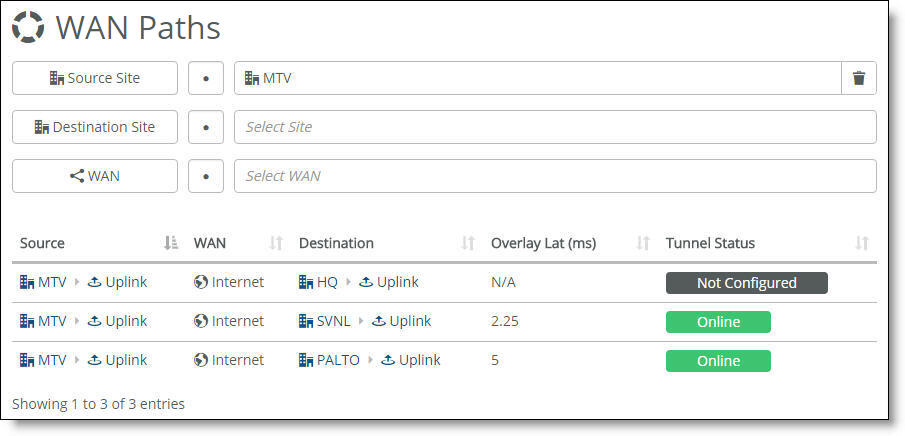
The WAN path status page shows the paths that have been established between uplinks and other sites. The display varies depending on the category you filter. It shows this information:
•Source - Includes the site and uplink.
•WAN - Includes the WAN that sites use to communicate with each other.
•Destination - Includes the site and uplink.
•Overlay Lat (ms) - Displays the overlay latency in milliseconds. N/A means that the overlay has not been created (the configuration has not been pushed to create the path).
•Tunnel Status - Displays the overlay tunnel status.
–Online - Tunnel is up and running. Click Online to view the path quality metrics, similar to what you see on the dashboard map.
–Click the double arrows in the right edge of each column heading to sort by that column or to toggle the ascending/descending order of the tunnel.
–Not Configured - Tunnel is not up (the configuration isn’t created yet).
WAN path status
For a hub-and-spoke network topology configured with a master site connected to leaf nodes, the WAN Paths page shows only the tunnels between the master site and the leaf nodes. It doesn’t show leaf-to-leaf nodes. However, a master site shows all of the tunnels to its leaf nodes along with any other nodes in the topology that haven’t been configured as a master or a leaf.