Configuring Metric Polling
Metric Polling is the periodic collection of performance data from network devices by means of the Simple Network Management Protocol (SNMP) or by Windows Management Instrumentation (WMI).
If the device is SNMP v1- or v2c-enabled, NetIM must be configured with that device's SNMP read-only community string. If the device is SNMP v3-enabled, NetIM must be configured with that device’s SNMP v3 credentials.If the device is a WMI-enabled Windows server or personal computer, NetIM must be configured with that device’s WMI credentials.
NetIM uses polling profiles to control the type of data that is polled from each device. A polling profile specifies:
• A set of metrics that should be collected
• A set of interfaces from which those metrics should be collected
• How often metrics should be collected
A polling profile can be associated with one or more network devices.
Polling profiles can be user-defined, as explained in
Using the Polling wizard to create, clone, edit or delete Polling Profiles. However, NetIM automatically assigns a default polling profile to every device that does not have a user-defined profile.
This section contains the following topics on configuring metric polling:
Related topics
Enabling/disabling background polling
Background polling is a global setting that controls whether NetIM attempts to poll. No polling takes place if background polling is disabled.
By default, background polling is enabled.
Enabling background polling is not the same as enabling metric polling for specific devices.
For information on how to enable to disable background polling, see
Configuring the IP Detection Service.
Configuring metric polling during setup
To enable polling to monitor availability and performance metrics on newly discovered devices when setting up NetIM, select Yes on the Configure Automatic Polling screen of the Basic Setup wizard.
If you select No, you can enable or disable polling for individual devices in the Device Manager. See
Manually enabling or disabling metric polling.
This setting affects all newly discovered devices. Be aware that polling adds traffic to your network.
Manually enabling or disabling metric polling
This section describes how to manually enable or disable metric polling. You may want to do this under the following circumstances:
• You want to selectively poll devices.
• You do not want to automatically poll all newly discovered devices.
To manually configure polling
1. Log in to the UI as admin.
3. Choose Configure > Device Manager.
The Device Manager screen appears, as follows:
Device Manager screen

4. Select a device or devices of interest. by clicking in the box next to the device entry. The entry turns blue.
5. On the action menu, choose General > Edit.
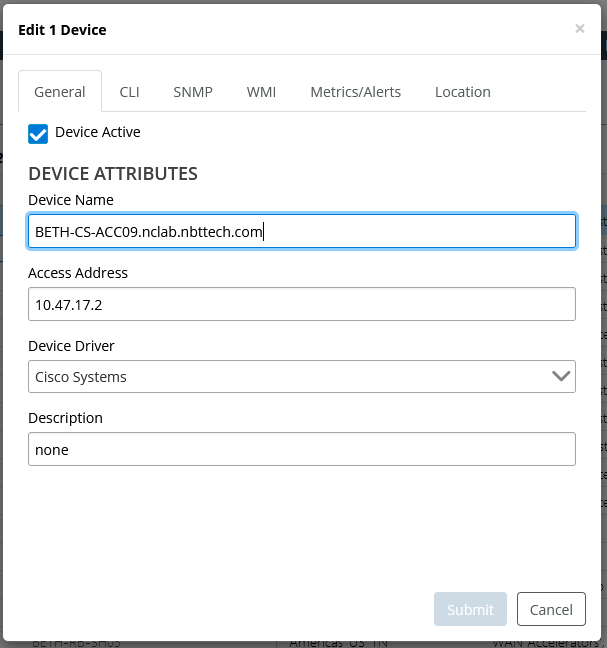
The following screen appears:
Edit Device pop-up

If you are editing more than one device entry and a check box in the Edit Devices dialog box is gray (not black), it means that the highlighted device entries are a mix of enabled and disabled check boxes and the Edit Devices dialog box displays the state based on the setting of the first highlighted device. If it appears as enabled and you want to enable it for all highlighted devices, you must first clear the check box, then reselect the check box to enable it for all highlighted devices.
6. To enable metric polling:
– On the General tab, ensure that Device Active is selected.
– On the SNMP tab, ensure that SNMP Collection Active is selected.
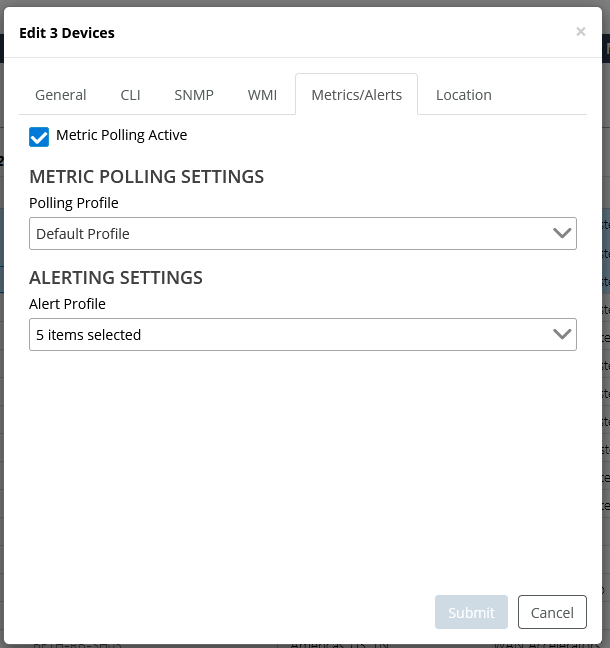
– On the Metrics/Alerts tab, ensure that Metric Polling Active is selected and that a polling profile is selected from the drop-down menu.
7. To disable metric polling for selected device(s):
– On the Metrics/Alerts tab, clear Metric Polling Active.
8. Click Submit to record your changes.
Using the Polling wizard to create, clone, edit or delete Polling Profiles
Use the Polling wizard to manage polling profiles. A Polling Profile consists of the following elements:
• A set of performance metrics that should be polled from network devices
• The frequency at which metrics are polled, which can be set per metric
• A filter that specifies interfaces from which metrics in this profile should be collected
The Polling wizard guides you through the creation of a Polling Profile and the assignment of that Profile to one or more network devices.
To access the Polling wizard, choose Configure > Polling.
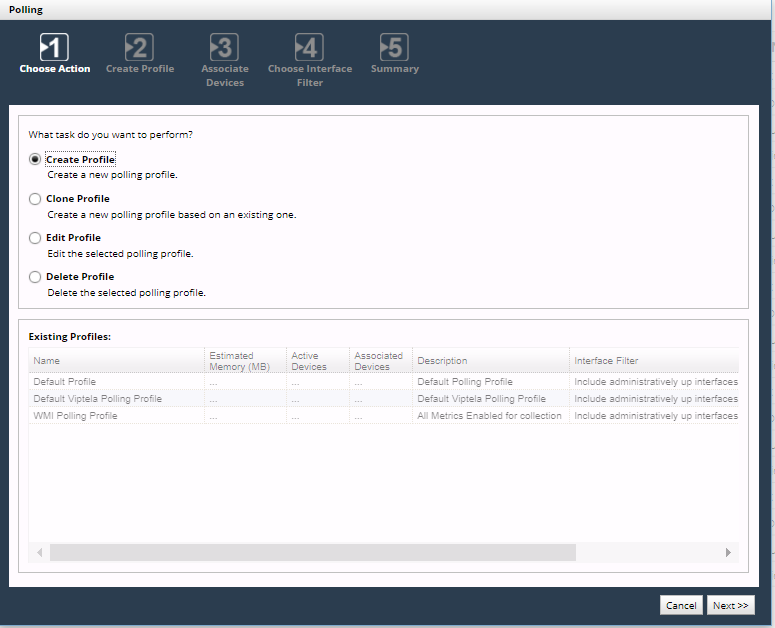
The following screen appears:
Polling pop-up

The screens you see depend on your workflow, but the wizard always starts with the Choose Action screen.
Using the Choose Action screen
1. On the Choose Action screen, select Create Profile and click Next.
The Create Profile screen appears.
2. Select Clone Profile, Edit Profile, or Delete Profile, highlight the row of the existing profile you want to clone, edit, or delete, and click Next.
The Default profile cannot be deleted. If you delete a profile that is assigned to one or more devices, the Default profile is automatically assigned to those devices in place of the deleted profile.
Using the Create Profile, Clone Profile, and Edit Profile screens
These screens allows you to create, clone, or edit a polling profile, which can then be assigned to a device to override the default polling profile created for all devices.
NetIM automatically assigns a default polling profile to every device that does not have a user-defined profile.
A device can use only one profile at a time. To see the profile that is currently assigned to a device, look at the Polling Profile column in the Device Manager.
For information about the metrics that can be included in a polling profile, see
Built-In Metrics and
Metric Classes by Vendor/Device Type.
On the Create Profile, Clone Profile, or Edit Profile screens, enter or reenter the following information for this profile:
• Profile Name (must be unique).
• Profile Description (optional).
• Node Polling Failure Tolerance—Specifies the number of consecutive polling failures that cause this device to be excluded from polling. When this threshold is reached, NetIM takes these actions:
– Stops trying to poll any metric class from the device (except the Device Status and Reachability class). When Device Status and Reachability indicates that the device is accessible again, full polling resumes.
– Counts the failure against devices dropped from polling, which in turn sends an event to the Events Dashboard.
• Metric groups and classes (metric classes to be polled and the polling frequency for each).
Expand the tree, and select metric classes to be polled and the polling frequency for each. You see different metrics for different types of devices.
If a particular metric is configured to be polled by both SNMP and WMI, it is polled by WMI only. For example, the CPU Utilization metric can be provided by both SNMP and WMI. If configured to be collected from a Windows server by both SNMP and WMI, it will be collected by WMI only. WMI-specific metrics continue to be polled by WMI, and SNMP-specific metrics continue to be polled by SNMP. To force CPU Utilization to be collected by SNMP in this case, clear the Collect WMI check box on that device in the Device Manager.
When finished, click
Next; the Associate Devices screen appears. See
Using the Associate Devices screen.
Using the Associate Devices screen
On the Associate Devices screen, set or change the set of devices to which this Polling Profile applies.
A device can be associated with only one profile at a time. If you assign this profile to a device that already has a profile, this profile replaces the other one for that device.
The names of all non-empty device Groups appear in the Devices panel on the left. To limit the set of devices that are selectable, highlight one or more Group names, or click All to be able to select from all known devices. For information about how devices become members of Groups, see
Configuring Groups.
When finished, click
Next. The Choose Interface Filter screen appears. See
Using the Choose Interface Filter screen.
Using the Choose Interface Filter screen
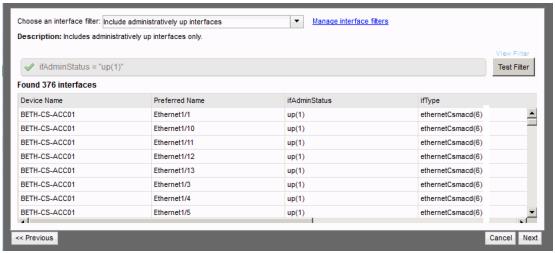
Choose Interface Filter screen

An interface filter specifies the set of interfaces to which this Polling Profile applies.
Every Polling Profile offers the following system-defined interface filters, plus the custom filters that you have already defined.
• Include All Interfaces—Includes all interfaces.
• Include administratively up interfaces—Includes administratively up interfaces only (those configured as enabled or up).
• Include administratively up and operationally up interfaces—Includes administratively up and operationally up interfaces only (those that are actually up).
• Include connected interfaces—Polls all interfaces which have a link incident to them in the NetIM model.
• Exclude all interfaces—Filters out all a device’s interfaces from being polled.
• Include connected interfaces—Includes only those interfaces that are known to be connected to another.
On the Choose Interface Filter screen, do one of the following:
• Pick any system-defined or user-defined interface filter from the drop-down list, click
Test Filter to see the set of interfaces that pass that filter, click
Next, and go to the Summary screen. See
Using the Summary screen.
The Test Filter button generates a list of the currently known interfaces that pass the filter. At runtime, the set of interfaces may be different.
Using the Manage Interface Filters screen
On the Manage Interface Filters screen, do one of the following:
• Select Create an Interface Filter and click Next.
• Select Clone an Interface Filter, Edit an Interface Filter, or Delete an Interface Filter, highlight the row of the existing filter you want to manage, and click Next.
The default Interface Filters cannot be edited or deleted.
Using the Interface Filter Details screen
An interface filter limits the action of a profile to the interfaces whose descriptive properties match a Boolean expression. The expression is evaluated from left to right by typical mathematical convention.
On the Interface Filter Details screen, you will create or edit an interface filter in either of two modes:
• Basic Filter—Allows you to assemble a logical expression by clicking property names and operators. See
Working with Basic Filters.
Using the Summary screen
The Summary screen consists of four sections:
• Poller status—A reminder of whether the poller is currently enabled.
• Profile—Settings that apply to this polling profile.
• Metric Classes to Poll—A list of the metric classes chosen on the Create Profile, Clone Profile, or Edit Profile screen
• Associated Devices—A list of the devices chosen on the Associate Devices screen.
On the Summary screen, review the configuration of this polling profile, and then do one of the following:
• Click Previous to make changes on a previous screen.
• Click Cancel to close the Polling wizard without saving the profile.
• Click Finish to save the profile and close the Polling wizard.
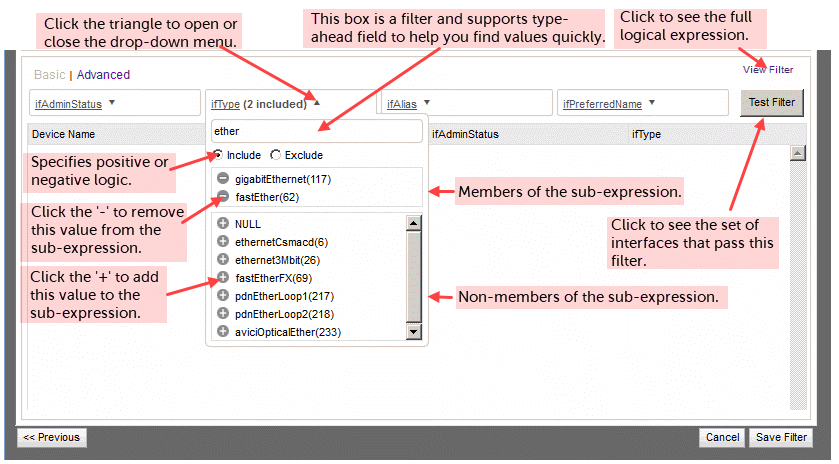
Working with Basic Filters
In a Basic Filter, you can create one sub-expression for each of the following properties of an interface.
• ifAdminStatus, which can be NULL, up(1), down(2), or testing(3).
• ifType, which can be NULL, unknown(0), other(1), plus about 250 other industry-standard interface type names.
• ifAlias, which can be EMPTY or NULL, or any string in the ifAlias property of a device.
• ifPreferredName, which can be EMPTY or NULL, or any string in the ifPreferredName property of a device.
In a Basic Filter, multiple values for one field are ORed. For example, in the ifType field, picking fastEther(62) and gigabitEthernet(117) results in ifType in("fastEther(62)", "gigabitEthernet(117)"), which is logically equivalent to (ifType = fastEther(62)) OR (ifType = fastEther(62)).
In a Basic Filter, all sub-expressions are automatically ANDed, resulting in a full expression such as: ifAdminStatus in("up(1)") AND ifType in("fastEther(62)", "gigabitEthernet(117)")
The parenthesized suffixes, like “(62)” and “(117)”, are industry-standard codes that are of interest to advanced users.
Basic Filter screen

Working with Advanced Filters
This section includes the following topics:
Rules for Advanced Filters
To create or edit an Advanced Filter, click the Filter field, and then devise a logical expression using the keywords and operators that appear in the Usage panel. To test the behavior of any logical expression, click Test Filter.
The definitions and rules for an Advanced Filter are:
• A Field is an attribute of an object in the network model. The fields that function in an Interface Filter are listed in the Usage panel. Each field type accepts different operators and allows comparisons against different value types.
• A Value is a user input. In the logical expression ‘ifType = <ethernet>’, where <ethernet> is a value.
– The rules for string values are:
Quotations are required if the value contains spaces or any other reserved characters. We recommend you wrap all values in double quotations to avoid confusion.
If the value contains a double quotation character, it must be preceded by ‘\’. For example, ifAlias ~ “foo\”bar\”” matches all interfaces whose ifAlias attribute contains “foo”bar””
In general, string fields support NULL and EMPTY value types with the EQUALS, NOT EQUALS, IN, and NOT IN operators. However, certain fields do not support these special types. This is due to the unique storage requirements for specific fields.
The rules for integer values are:
In general, integer fields support the NULL value type with the EQUALS, NOT EQUALS, IN, and NOT IN operators. However, certain fields do not support these special types. This is due to the unique storage requirements for specific fields.
If not a NULL value type, then the value must be convertible to an integer.
Integer value types must not be wrapped in quotation marks. Only the number itself is permitted.
– The rules for Boolean values are:
Boolean values can be only one of TRUE, FALSE, or NULL if applicable.
• Expressions evaluated by “=”, “!=”, “~”, “!~”, and regexp are case-insensitive. Value are case-sensitive. For example, ifType = foo is equivalent to iftype = foo. But ifType = foo is not equivalent to ifType = FOO.
• Keywords and Logical Operators
– A Keyword is a reserved value. The keyword NULL represents a null value. NULL can be used to find values for which the value has never been set.
– The keyword EMPTY represents an empty value. EMPTY matches empty contents in an attribute. This is a convenience keyword that can improve query readability.
– Use the AND and OR operators to connect logical expressions.
A String Operator compares the similarity of strings.
=—Tests for exact matches of string data, including the NULL and EMPTY types.
!=—Tests for inequality of string data, including the NULL and EMPTY types.
~—Performs a case-sensitive ‘contains’ check. Does not support NULL or EMPTY types.
!~—Performs a ‘negative contains’ check. Does not support NULL or EMPTY types.
in—A shorthand operator for performing an EQUALS on many values. The values within the in clause are ORed together.
not in—A shorthand operator for performing a NOT EQUALS on many values. The values within the not in clause are ANDed together.
regexp—Treats the value as a POSIX regular expression. For more information on regular expression support, see: http://www.postgresql.org/docs/9.2/static/functions-matching.html#POSIX-SYNTAX-DETAILS
not regexp—Treats the value as a POSIX regular expression. It is the inverse of the REGEXP operator.
• An Integer Operator compares the value of integers.
=—Tests for exact matches of integer data, including the NULL type.
!=—Performs negative matches against integer data, including the NULL type.
<—Performs a less than check. Does not support NULL or EMPTY types.
<=—Performs a less than or equal to check. Does not support NULL or EMPTY types.
>—Performs a greater than check. Does not support NULL or EMPTY types.
>=—Performs a greater than or equal to check. Does not support NULL or EMPTY types.
in—A shorthand operator for performing an EQUALS on many values.
not in is essentially a shorthand operator for performing a NOT EQUALS on many values.
• A Boolean Operator compares the truth of statements.
=—Tests for exact matches of Boolean data, including the NULL type.
!=—Tests for negative matches of Boolean data, including the NULL type.
• Reserved Characters
The presence of a reserved character in a value is interpreted differently depending on the operator. For example, ifAlias = ".*foo.*" filters by ifAlias values that contain the string literal ".*foo.*."
ifAlias regexp ".*foo.*" filters by ifAlias values that contain "foo" anywhere in the ifAlias value.
This is because of the regexp operator.
When any reserved character appears in a value, enclose the value with double quotation marks. The reserved characters are:
space
(—Is used for grouping and ordering within logical statements.
)—Is used for grouping and ordering within logical statements.
+—For use with the REGEXP and NOT REGEXP operators.
.—For use with the REGEXP and NOT REGEXP operators.
,—For use with the IN and NOT IN operators.
?—For use with the REGEXP and NOT REGEXP operators.
|—For use with the REGEXP and NOT REGEXP operators.
*—For use with the REGEXP and NOT REGEXP operators.
/—For use with the REGEXP and NOT REGEXP operators.
%—(for future use)
^—For use with the REGEXP and NOT REGEXP operators.
$—For use with the REGEXP and NOT REGEXP operators.
#—(for future use)
@—(for future use)
[—For use with the REGEXP and NOT REGEXP operators.
]—For use with the REGEXP and NOT REGEXP operators.
Tips for creating advanced filters
• We recommend you enclose all string values in double quotation marks. It reduces the chance for error if you subsequently change the value or operator.
• Evaluation of “contains” and regexp expressions is case-insensitive by default. For case-sensitive evaluation, use the regexp string operator. To cause case-sensitive evaluation, prefix the value with "(?c)"
• Click Test Filter to view interface results only when the network model is relatively static. If adapters that update the model are currently running, your interface filter results may change without any changes to the query itself.
Examples of advanced filters
• Search for all interfaces that have the word uplink in their ifDescr or their ifAlias fields, where the interface type is ethernet.
(ifDescr ~ uplink or ifAlias ~ uplink) and ifType = "ethernetCsmacd(6)"
• Search for all interfaces that have the word uplink in their ifDescr or their ifAlias fields (case-sensitive), where the interface type is not ethernet.
(ifDescr regexp "(?c).*uplink.*" or ifAlias regexp "(?c).*uplink.*") and ifType = "ethernetCsmacd(6)"
• Search (case-insensitive) for all interfaces whose ifAlias field starts with the word LAN.
ifAlias regexp "^LAN"
• Search (case-sensitive) for all interfaces whose ifAlias field starts with the word LAN.
ifAlias regexp "(?c)^LAN"
• Search for all interfaces whose ifDescr field contains the text test \ link.
ifDescr ~ "test \"link\""
Assigning a polling profile to devices
You can assign a polling profile to devices in two ways:
• Manually, as described in the following procedure.
To manually assign a polling profile to a device
1. Log in as a user with administrative privilege.
2. Choose Configure > Device Manager. The following screen appears:
Device Manager screen

3. Highlight one or more device entries that you want to modify.
4. On the action menu, choose General > Edit.
The following screen appears:
Edit Device pop-up

5. Select the Metrics/Alerts tab. The following screen appears:
Metrics/Alerts pop-up

6. Select a polling profile from the pull-down menu.
7. To confirm your choice, click Submit.
Polling overrides
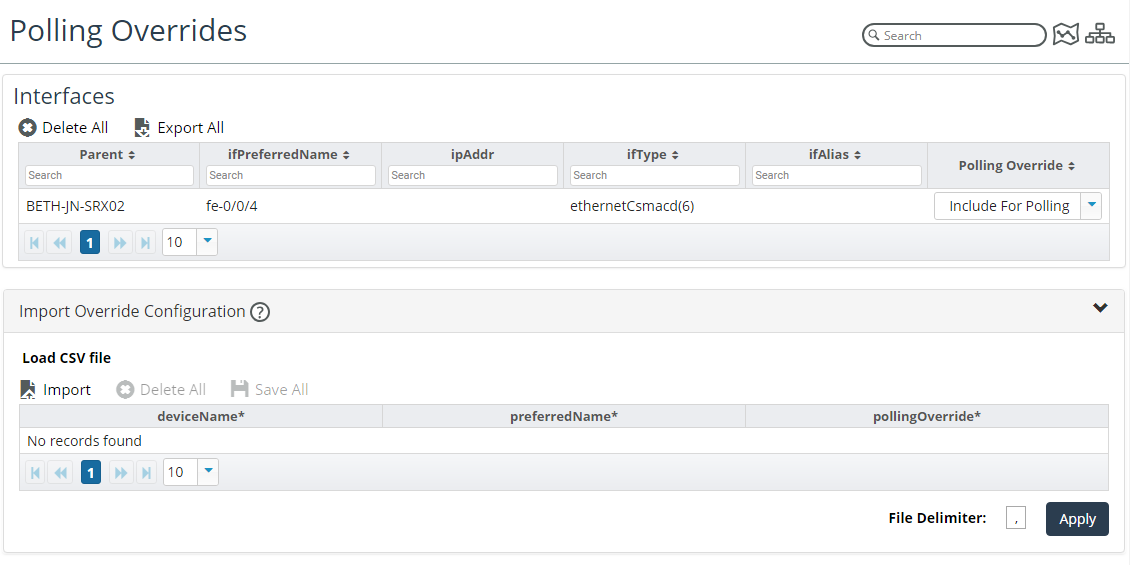
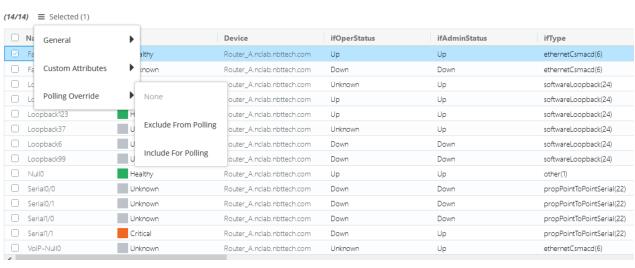
Polling overrides provides high-granularity control over whether to poll individual interfaces. The polling override is the highest priority control over whether an interface will be polled by the NetIM poller (provided the NetIM poller has sufficient resources). The interface polling override supports three states:
• None—The polling profile’s interface filter will decide if it will be polled by the NetIM poller.
• Exclude from polling—The interface will never be polled.
• Include for polling—The interface will always be polled provided the NetIM poller has sufficient resources
Interface polling overrides can be accessed and controlled from various pages in the NetIM WebUI. For global control over polling overrides, use the Polling Overrides page.
To access the Polling Overrides page, choose Configure > All Settings > Monitor > Polling Overrides. The following screen appears:
Polling Overrides screen

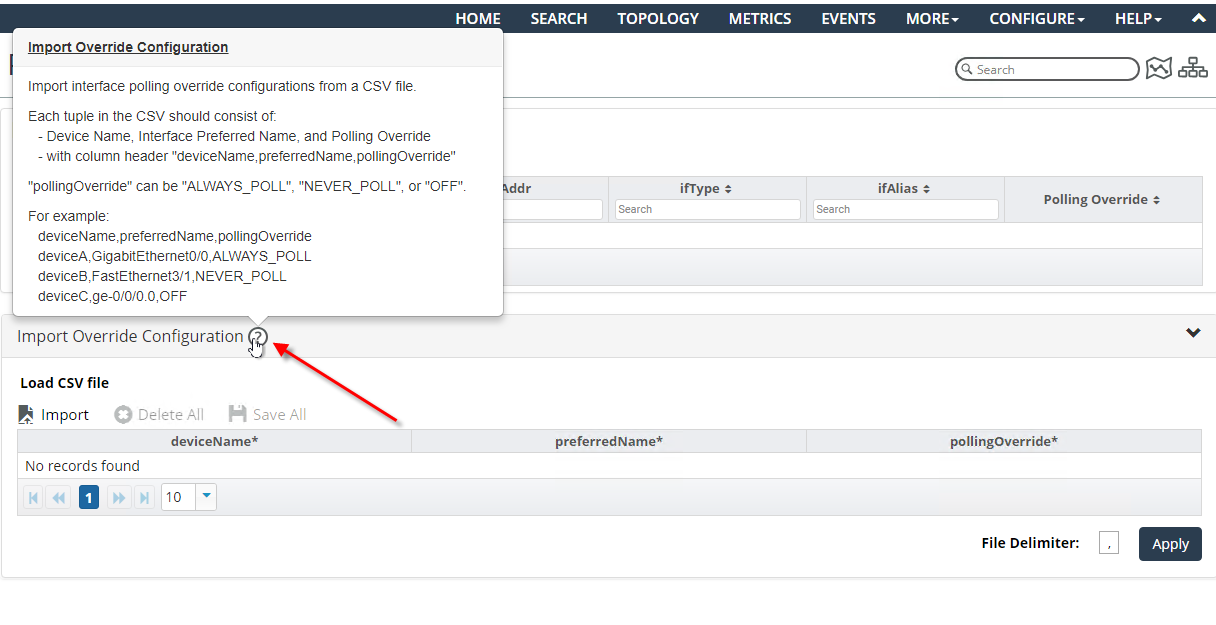
The Polling Overrides CSV format is provided with-the contextual mouse over help, as shown in the following screen, and consists of:
• Header
• Device Name
• Interface Preferred Name
• Polling Override Value
Must be one of the following: ALWAYS_POLL, NEVER_POLL, OFF
Polling Overrides CSV formatting

You can also access and control interface polling overrides associated with a device’s interfaces from the Device page > Browse tab > Interfaces table, as shown in the following screen:
Interfaces table

The Interface page also provides the capability to view and edit an interface’s polling override value, as shown in the following screen:
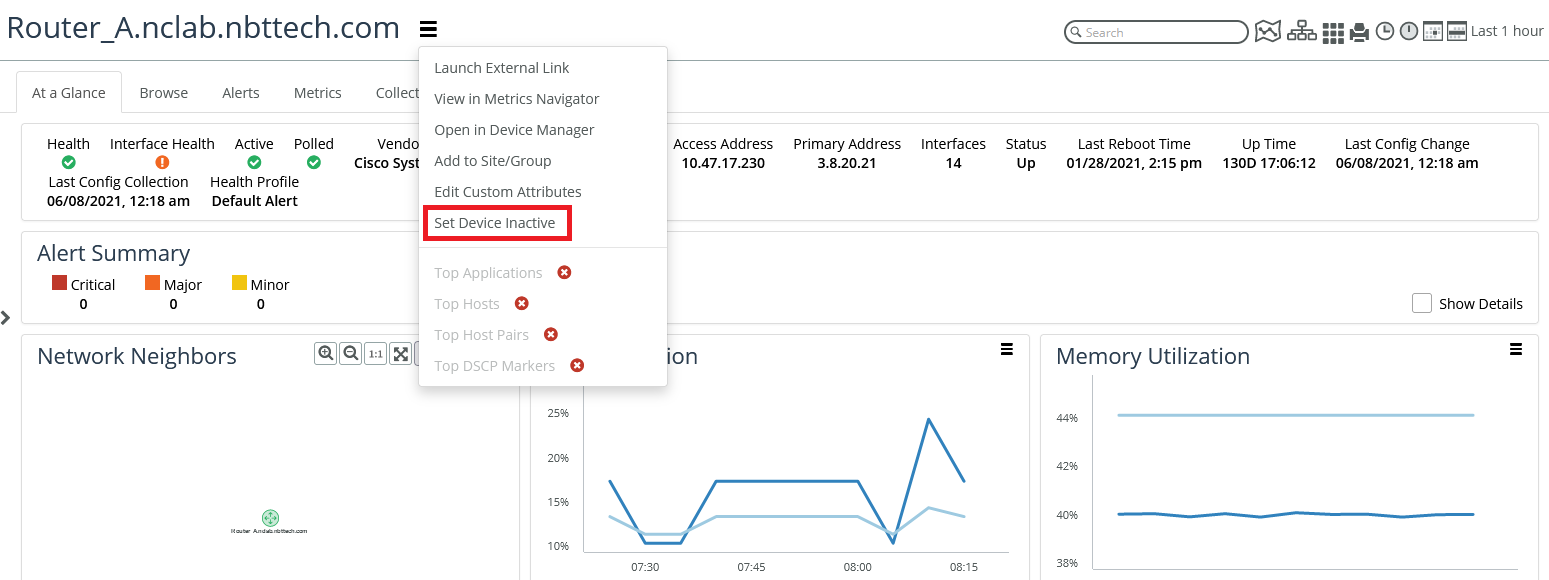
Set devices as inactive

Interface polling control use cases
Used together, polling profile interface filters and interface polling overrides provide a powerful means to control interface polling and achieve your interface polling requirements. A few examples are provided as follows:
• “Just poll my access switch uplinks”
– Create a group with just your access switches in it
– Create a polling profile for the access switch group with the “Exclude all interfaces” filter
– Import an “always poll” CSV containing the access switch uplink ports
• “I have a spreadsheet of the interfaces I want to poll”
– Create a polling profile with the “Exclude all interfaces” filter
– Import an “always poll” C
– SV containing the ports you want to poll
• “I want to poll all my adminUp interfaces except for a few”
– Create a polling profile with the “Poll Admin Up Interfaces” filter
– Import a “never poll” CSV
Monitoring device status and availability
NetIM’s poller provides the ability to contact devices to determine the device status (up or down), and then compute availability (the percent of time that a device has been up) based on the device status. The device status and availability metrics can be applied to any device, not just SNMP-manageable devices.
There may be devices in your network for which you would like to monitor device status and availability but not detailed performance metrics. When this is the case, see
Using the Polling wizard to create, clone, edit or delete Polling Profiles to create a polling profile that contains only the Device Status and Availability metrics, and then apply that polling profile to appropriate devices.
When determining device status, the poller attempts to contact the device using SNMP and ICMP Ping. (If NetCollector is running on Linux, the poller uses SNMP and TCP Ping.)
The poller uses several device status samples to compute device availability. The polling frequency defined in your polling profile determines the frequency for polling device status, and then device availability is computed as listed in the following table.
Polling frequency | Number of completed polling cycles before device availability is computed | Time window over which device availability is computed |
1 minute | 5 | 5 minutes |
5 minutes | 3 | 15 minutes |
10 minutes | 3 | 30 minutes |
15 minutes | 4 | 60 minutes |
30 minutes | 2 | 60 minutes |
60 minutes | 1 | 60 minutes |
WMI collection and metric polling
In version 2.3.0, NetIM restored Windows Metrics support to the NetIM 2.x product line. Metric classes supported in NetIM 1.x are supported in NetIM version 2.3.0 and higher. The Windows Metrics Poller supports the following metric classes:
• CPU Utilization
• Memory Usage
• Host Disk Usage
• Host Memory Usage
• Host Software Performance and Status
• Host System Statistics
• Interface Errors & Discards
– Interface Status
– Interface Utilization & Throughput
– Domain Controller
– IIS Webservice
– Microsoft Message Queuing
– SQL Server
– Windows Services
– Windows System
– SharePoint ASP.NET
– SharePoint SQL Databases
– SharePoint SQL Statistics
– SharePoint SQL Locks
– SharePoint SQL Latches
– SharePoint SQL Plan Cache
– SharePoint Search
– SharePoint Search Indexer
NetIM uses PowerShell remoting to collect Windows system model attributes and poll Windows metrics. This is different from the technology used to poll for Windows metrics and model attributes in NetIM 1.x, but the data is the same.
We estimate you should be able to poll approximately 300 Windows servers at 5-minute polling granularity with a single NetIM worker. This is an estimate and “your mileage may vary” in terms of scalability of each WMI poller service.
WMI prerequisite checklist
To ensure you are successful in Windows system attribute collection and metrics polling, use the following checklist.
These prerequisites are covered in detail in the next section.
• Remote Windows systems you are polling must support PowerShell 5.1.x or later.
• Remote Windows systems you are polling must support PowerShell remoting.
• A user must be created/added to the remote management user group for performing the Windows Metrics Collection and Polling. The user must also be in the Distributed COM Users group, Remote Management Users group, and in the Performance Monitor Users group.
If you are polling the Windows Services metric class, you must provide access to the data.
WMI prerequisites
For successful Windows Metric polling, your Windows systems must comply with the-following prerequisites:
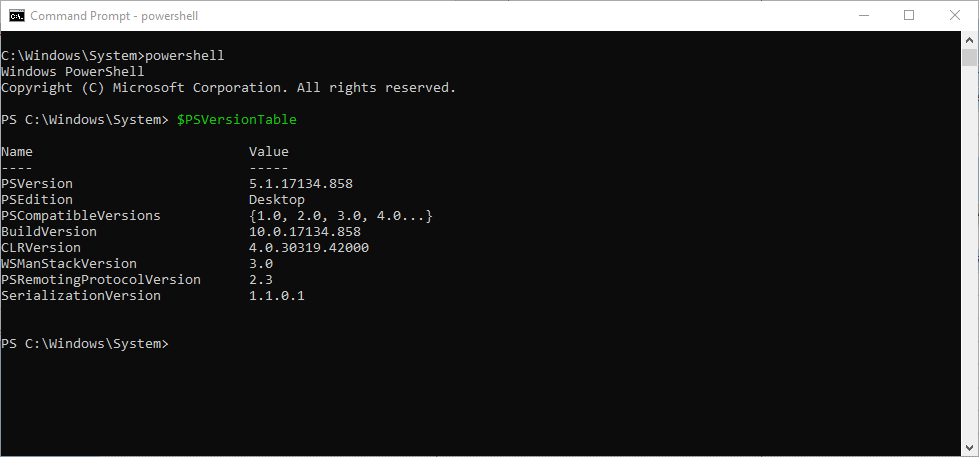
1. Check the version of PowerShell running on the target Windows systems that you will be polling.
– Enter the PowerShell command line, as follows:
C:\WINDOWS\system32> powershell
– Check the PowerShell Version by entering the following command:
PS C:\WINDOWS\system32> $PSVersionTable
PowerShell version check

– Make sure that PowerShell version 5.1.x or greater is installed. In the unlikely event that the PowerShell version is not at least 5.1, get the appropriate installer and upgrade the PowerShell from Microsoft at
Installing Windows PowerShell. 2. Enable remoting in PowerShell, by entering the following command:
PS C:\WINDOWS\system32> Enable-PSRemoting -SkipNetworkProfileCheck -Force
3. Configure and restart the WinRM, by entering the following command:
PS C:\WINDOWS\system32> winrm quickconfig
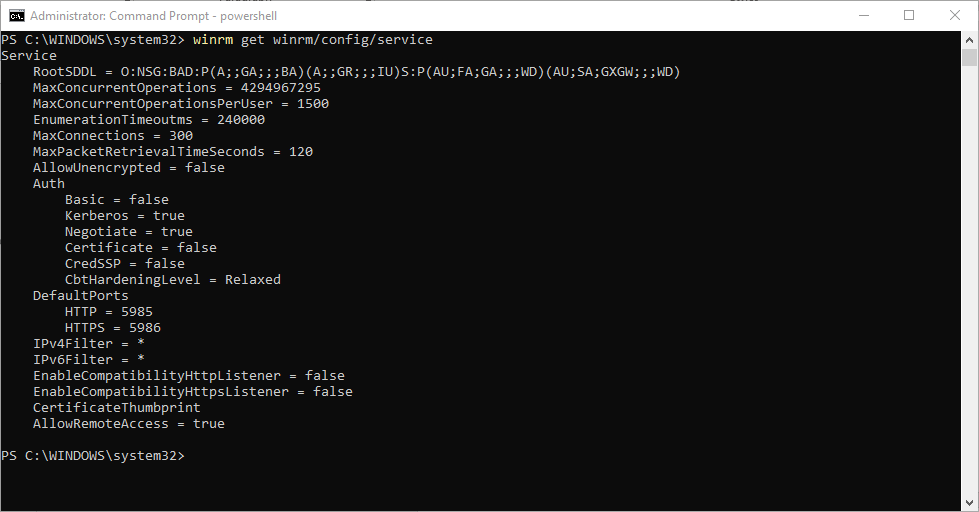
4. Check the WinRM service settings, by entering the following command:
PS C:\WINDOWS\system32> winrm get winrm/config/service
WinRM service settings check

5. Add a user (in other words, wmiuser) to the remote management user group for performing the WMI collection and Polling, by entering the following command:
PS C:\WINDOWS\system32> Add-LocalGroupMember -Group "Remote Management Users" -Member "wmiuser"
The user needs to be in the Distributed COM Users group, Remote Management Users group and in the Performance Monitor Users group. If the Windows user is setup as domain user, then skip the next steps.
If the user is configured as a local user on the computer, them make sure to add the DWORD property LocalAccountTokenFilterPolicy in the following path and set it to 1 using regedit or using the following command in the PowerShell:
PS C:\WINDOWS\system32> New-ItemProperty -Name LocalAccountTokenFilterPolicy `-Path HKLM:\SOFTWARE\Microsoft\Windows\CurrentVersion\Policies\System ` -PropertyType DWord -Value 1
6. (Optional) If you plan to collect the Windows Services metric class (Win32_Service) you must execute a supplementary command on the remote target system to allow access to and collection of the metric class.
Run from a command prompt with administrator privilege (do not run from powershell):
sc sdset SCMANAGER D:(A;;CCLCRPRC;;;AU)(A;;CCLCRPWPRC;;;SY)(A;;KA;;;BA)S:(AU;FA;KA;;;WD)(AU;OIIOFA;GA;;;WD)
7. (Recommended) By default, some Windows systems may be configured with only 512 MB for PowerShell sessions. To avoid out-of-memory issues during collection and polling, ensure that the Windows systems are configured to have at least 1 GB of memory (2 GB recommended) for MaxMemoryPerShellMB. You can check the current settings by running this command within PowerShell:
winrm get winrm/config
To adjust the memory allocated per shell, perform the following steps within a PowerShell session:
– Set-Item WSMan:\localhost\Shell\MaxMemoryPerShellMB 2048
– Set-Item WSMan:\localhost\Plugin\Microsoft.PowerShell\Quotas\MaxMemoryPerShellMB 2048
– get-Item WSMan:\localhost\Plugin\Microsoft.PowerShell\Quotas\MaxMemoryPerShellMB
– Restart-Service winrm
– winrm get winrm/config
Resolving issues with PowerShell remoting and Windows metrics
To confirm that you can perform PowerShell remoting from NetIM core and workers to collect a class of Windows metrics, run the following commands in the PowerShell:
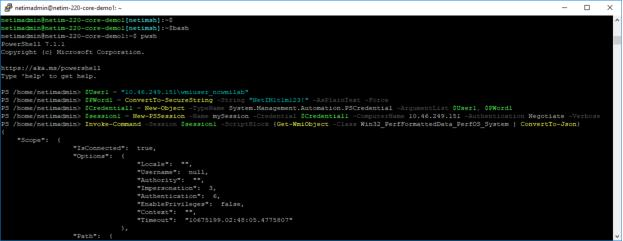
Log in to the NetIM core or a NetIM worker as netimadmin (the default password is also netimadmin) and invoke the PowerShell CLI by first entering the bash shell and then entering pwsh, as shown in the following screen:
PowerShell CLI command

Execute the following commands from NetIM core or a worker to confirm that PowerShell remoting works to a chosen target Windows system:
$User1 = "<host_ip_address>\<wmiuser>"
$PWord1 = ConvertTo-SecureString -String "<wmiuser_pwd>" -AsPlainText -Force
$Credential1 = New-Object -TypeName System.Management.Automation.PSCredential -ArgumentList $User1, $PWord1
$session1 = New-PSSession -Name mySession -Credential $Credential1 -ComputerName <host_ip_address> -Authentication Negotiate -Verbose
Invoke-Command -Session $session1 -ScriptBlock {Get-WmiObject -Class Win32_PerfFormattedData_PerfOS_System | ConvertTo-Json}
As an example, we performed these commands in our lab:
$User1 = "11.46.249.1\wmiuser_ncwmilab"
$PWord1 = ConvertTo-SecureString -String "NetIM1t1m123?" -AsPlainText -Force
$Credential1 = New-Object -TypeName System.Management.Automation.PSCredential -ArgumentList $User1, $PWord1
$session1 = New-PSSession -Name mySession -Credential $Credential1 -ComputerName 11.46.249.1 -Authentication Negotiate -Verbose
Invoke-Command -Session $session1 -ScriptBlock {Get-WmiObject -Class Win32_PerfFormattedData_PerfOS_System | ConvertTo-Json}
Invoke-Command -Session $session1 -ScriptBlock {Get-WmiObject -Class Win32_PerfFormattedData_PerfOS_System}
PowerShell confirmation

You can also use NetIM GUI-based WMITEST utility for troubleshooting. The WMITEST tool is akin to NetIM’s SNMP MIBBROWSER test tool but geared toward Windows system attributes and metrics.
To use the WMITEST tool
1. Log in to NetIM core as netimadmin/ netimadmin (default) and start xrdp, as follows:
[netimsh]:~$ start xrdp
2. RDP into the NetIM core as netimadmin/ netimadmin.
3. Launch the WMITEST tool from a terminal window, as follows:
[netimsh]:~$ app.sh WMITEST
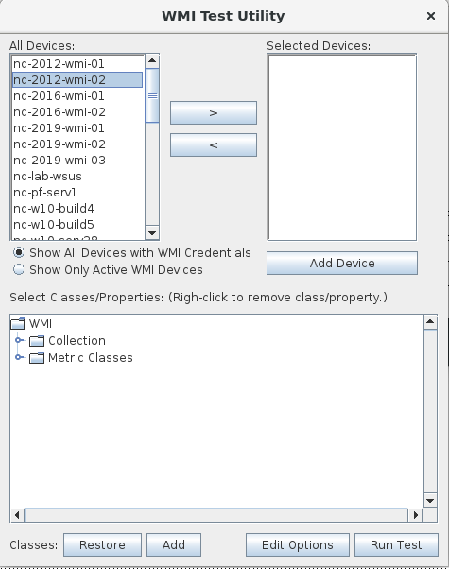
The WMITEST utility GUI window appears, as shown in the following screen.
WMI Test Utility pop-up

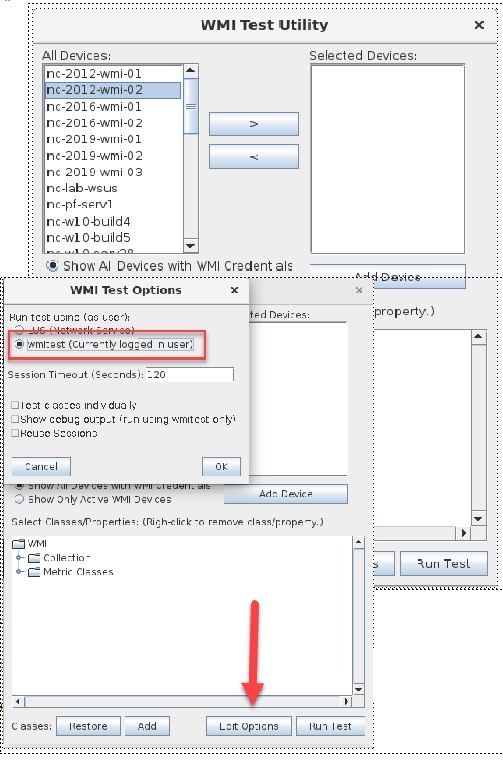
4. Click Edit Options.
5. Select wmitest (Currently logged in user).
6. Click OK to save your selections.
wmitest option

7. Select a device from the list or add a new device. The list is populated from Device Manager.
8. Click Run Test.
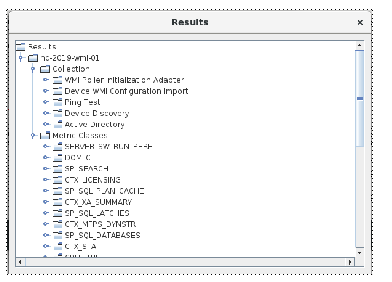
A progress Indicator appears, until the Results window displays so you can browse the results, as follows:
Results pop-up

For more information on resolving additional issues with WMI, see
Troubleshooting WMI.
Adding devices for WMI polling and attribute collection
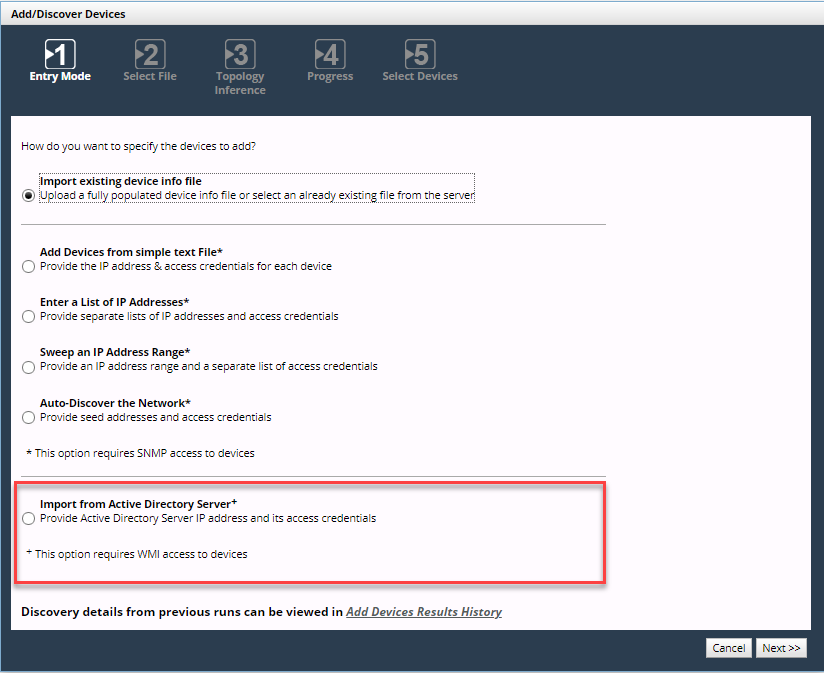
You can add Windows systems for collection and polling in many of the same ways you add devices for SNMP polling and collection and CLI (Command Line Interface) collection. Add devices using the Configure > Add/Discover Devices wizard, as follows:
Add/Discover Devices pop-up

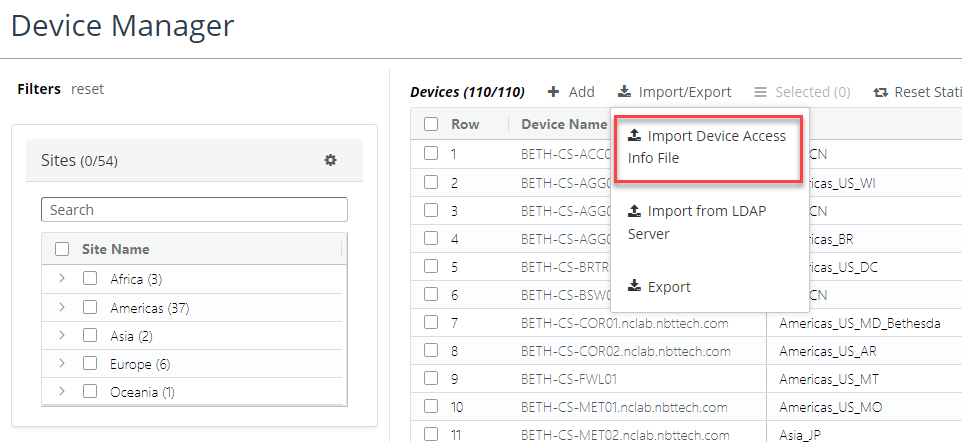
• Add device using Device Manager’s “Import Device Access Info File”, as follows:
Import device access info file

The Device Access Info File’s file format has a format like the following:
File format

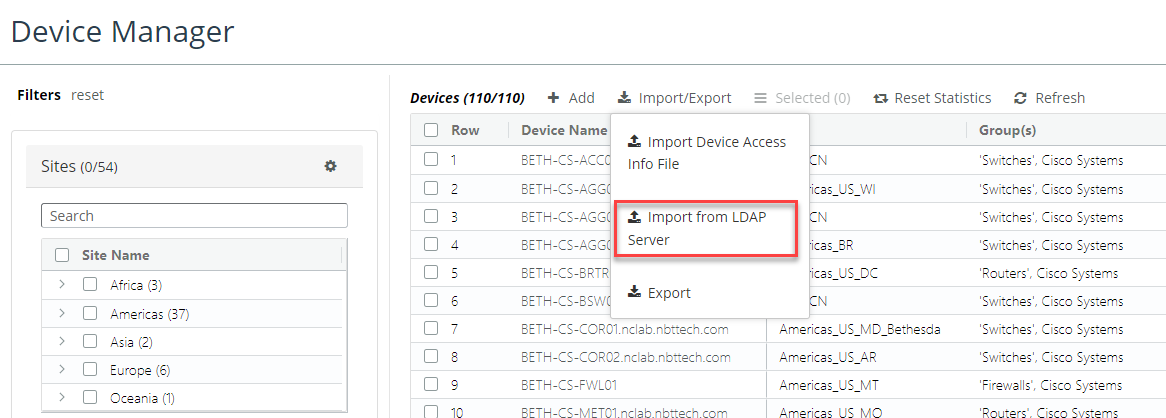
• Add devices using Device Manager’s “Import from LDAP Server”, as follows:
Import from LDAP server

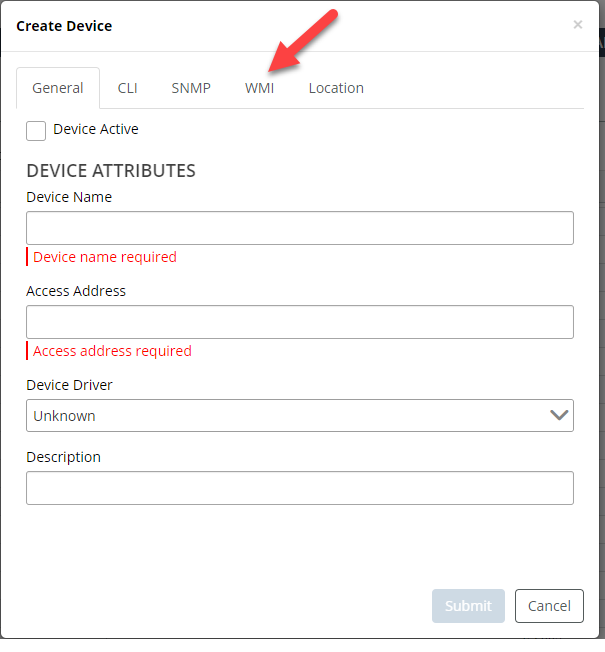
• Add an individual device using-the Device Manager’s “Create Device”, as follows:
Create Device pop-up

Monitoring Windows model collection and metrics polling
Similar to NetIM 1.x, collection and polling can be monitored from within the Device Manager for individual device collection and within dedicated collection and polling status for summary and details.
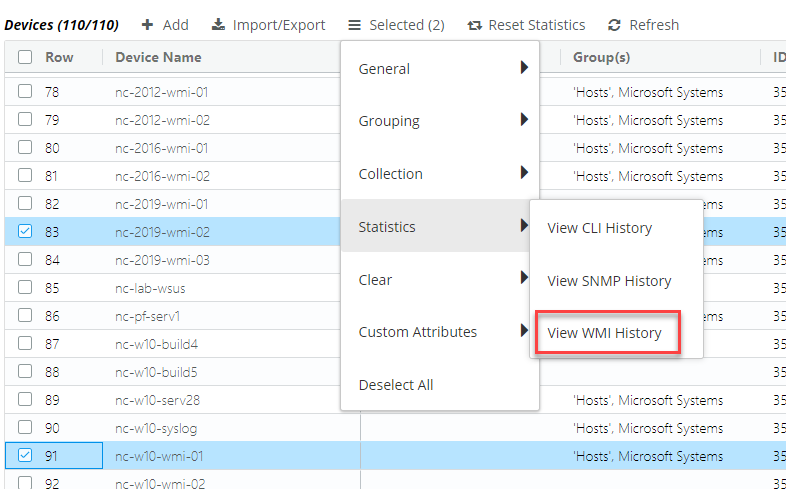
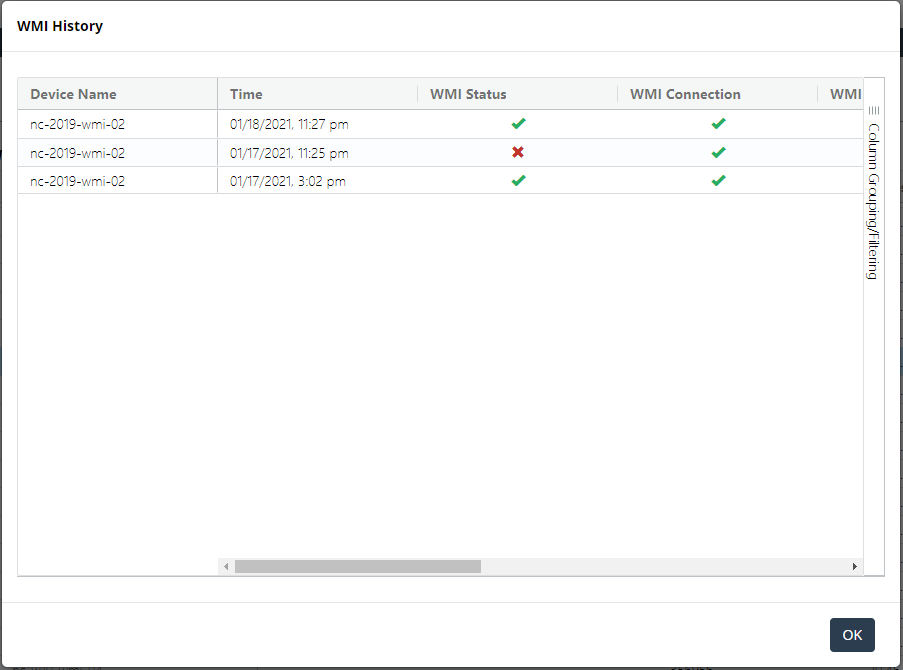
The Device Manager provides detailed collection status for each device from the Statistics > View WMI History option, as follows:
View WMI History icon

WMI History pop-up

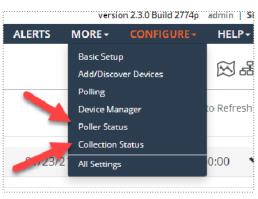
The dedicated pages for collection and polling are updated to include Windows collection and polling status. The collection and polling status pages are accessed as follows:
Poller Status and Collection Status icons
