Overview of the Management Console
This chapter provides an overview of the Management Console. The Management Console makes managing your SteelHead simpler through a web browser interface. It includes these topics:
This chapter assumes you have installed and configured the SteelHead. For details, see the SteelHead Installation and Configuration Guide.
This chapter also assumes you are familiar with the various deployment options available to you. For details, see the SteelHead Deployment Guide.
Prerequisites
This section provides information about product dependencies and compatibility. It includes this information:
Hardware and software dependencies
This table summarizes the hardware and software requirements for the SteelHead.
Riverbed Component | Hardware and software requirements |
SteelHead | 19-inch (483-mm) two-post or four-post rack. |
SteelHead Management Console, SteelCentral Controller for SteelHead | The Management Console supports the latest versions of Chrome, Firefox, and Microsoft Internet Explorer. JavaScript and cookies must be enabled in your web browser. |
SCC compatibility
To manage SteelHead 9.9.2 appliances, you need to use SCC 9.9.2. Earlier versions of the SCC don’t support SteelHead 9.9.2 appliances. For details about SCC compatibility across versions, see the SteelCentral Controller for SteelHead Installation Guide.

The ESX SteelHead-c supports SCC.
Ethernet network compatibility
The SteelHead supports these networking standards. A SteelHead with a Gigabit Ethernet card supports jumbo frames on in-path and primary ports.
Ethernet Standard | IEEE Standard |
Ethernet Logical Link Control (LLC) | IEEE 802.2 - 1998 |
Fast Ethernet 100BASE-TX | IEEE 802.3 - 2008 |
Gigabit Ethernet over Copper 1000BASE-T (All copper interfaces are autosensing for speed and duplex.) | IEEE 802.3 - 2008 |
Gigabit Ethernet over Fiber 1000BASE-SX (LC connector) | IEEE 802.3 - 2008 |
Gigabit Ethernet over Fiber 1000BASE-LX | IEEE 802.3 - 2008 |
Gigabit Ethernet over Fiber 10GBASE-LR Single Mode | IEEE 802.3 - 2008 |
Gigabit Ethernet over 10GBASE-SR Multimode | IEEE 802.3 - 2008 |
Gigabit Ethernet over 40GBASE-SR Multimode | IEEE 802.3 - 2008 |
Gigabit Ethernet over 40GBASE-LR Multimode | IEEE 802.3 - 2008 |
The SteelHead ports support these connection types and speeds.
Port | Speed |
Primary (PRI) | 10/100/1000BASE-T, autonegotiating |
Auxiliary (AUX) | 10/100/1000BASE-T, autonegotiating |
LAN | 10/100/1000BASE-T or 1000BASE-SX or 1000BASE-LX or 10GBASE-LR or 10GBASE-SR, and 40GBASE-LR or 40GBASE-SR depending on configuration |
WAN | 10/100/1000BASE-T or 1000BASE-SX or 1000BASE-LX or 10GBASE-LR or 10GBASE-SR, and 40GBASE-LR or 40GBASE-SR depending on configuration |
Data Interfaces (ethX_Y) | 10/100/1000BASE-T, autonegotiating |
The SteelHead supports VLAN Tagging (IEEE 802.3 - 2008). It does not support the Inter-Switch Link (ISL) protocol.
The SteelHead autonegotiates speed and duplex mode for all data rates and supports full duplex mode and flow control (IEEE 802.3 – 2008). The 10GBASE and 40GBASE NICs don’t autonegotiate speed and duplex.
SNMP-based management compatibility
This product supports a proprietary Riverbed MIB accessible through SNMP. SNMPv1 (RFCs 1155, 1157, 1212, and 1215), SNMPv2c (RFCs 1901, 2578, 2579, 2580, 3416, 3417, and 3418), and SNMPv3 are supported, although some MIB items might only be accessible through SNMPv2 and SNMPv3.
SNMP support enables the product to be integrated into network management systems such as Hewlett-Packard OpenView Network Node Manager, BMC Patrol, and other SNMP-based network management tools.
Using the Management Console
This section describes how to connect to and navigate in the Management Console. If you prefer, you can use the CLI to perform configuring and monitoring tasks. For details, see the Riverbed Command-Line Interface Reference Manual.
Connecting to the Management Console
To connect to the Management Console you must know the URL and administrator password that you assigned in the configuration wizard of the SteelHead. For details, see the SteelHead Installation and Configuration Guide.
To connect to the Management Console
1. Specify the URL for the Management Console in the location box of your web browser:
<protocol>://<host>.<domain>
The <protocol> variable is http or https. HTTPS uses the SSL protocol to ensure a secure environment. When you connect using HTTPS, the system prompts you to inspect and verify the SSL certificate. This is a self-signed certificate that provides encrypted web connections to the Management Console. The system re-creates the certificate when you change the appliance hostname or when the certificate expires.
The secure vault doesn’t protect the self-signed certificate used with HTTPS connections.
The <host> variable is the hostname you assigned to the SteelHead primary interface in the configuration wizard. If your DNS server maps that IP address to a name, you can specify the DNS name.
The <domain> variable is the full domain name for the appliance.
Alternatively, you can specify the IP address instead of the host and domain name.
The Management Console appears, displaying the Sign in page.
Sign in page
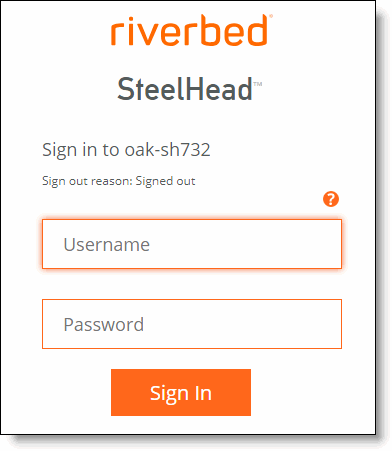
2. In the Username text box, specify the user login: admin, monitor, a login from a RADIUS or TACACS+ database, or any local accounts created using the Role-Based Accounts feature. The default login is admin. For details about role-based accounts, see
Managing user permissions.
Users with administrator (admin) privileges may configure and administer the SteelHead. Users with monitor (monitor) privileges may view the SteelHead reports, view the user logs, and change their own password. A monitor user can’t make configuration changes.
3. In the Password text box, specify the password you assigned in the configuration wizard of the SteelHead. (The SteelHead ships with the default password: password.)
4. Click Sign In to display the Dashboard.
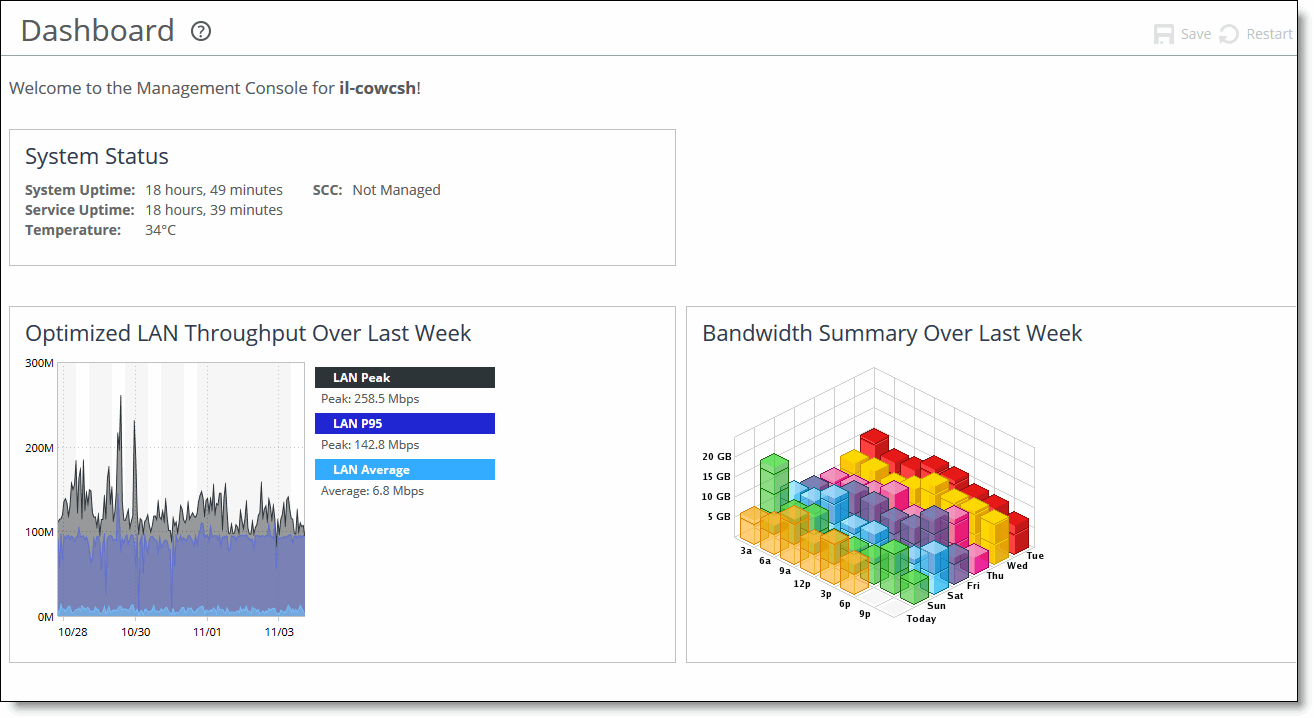
The Dashboard
The Dashboard displays the system health status icon and the system hostname in the upper-left corner. Hover the mouse over the health status icon to view the system health state: Healthy, Admission Control, Degraded, or Critical.
The middle of the page displays the system up time, service up time, temperature, and the SCC hostname (if you have one in your network).
The Dashboard also displays these reports:
•Optimized LAN Throughput Over Last Week - Summarizes the throughput or total optimized data transmitted for all applications in the last week. Includes the LAN peak performance in megabits per second, the 95th Percentile WAN throughput increase calculated as 95p LAN / 95p WAN. The Dashboard also includes the LAN average.
•Bandwidth Summary Over Last Week - Provides a three-dimensional view of traffic patterns (byte counts) over the last week. Each column represents the number of bytes, the time of day, and the day of the week. For example, the report might display that there were 4 GB of WAN traffic from 12 P.M. to 3 P.M. on Wednesday of the prior week.
The Dashboard
Navigating in the Management Console
You navigate to the tools and reports available to you in the Management Console using cascading menus.
To display cascading menus
1. Select the Networking, Optimization, Reports, and Administration menus to display the menu items by category. For example, select Networking to display the menu items in these categories: Networking, Networking Services, Topology, App Definitions, and Network Integration. The menu item that is currently active is highlighted.
2. To go to a page, slide your cursor down to the menu item you want to display and select it.
Saving your configuration
As you apply page settings, the system applies the values to the running configuration. Most Management Console configuration pages include an Apply button for you to commit your changes. When you click Apply, the Management Console updates the running configuration. Your changes are only written to disk when you save your configuration.
To save your changes, click Save to Disk.
A red outline around a control indicates that the field is required. You must specify a valid entry for all of the required controls on a page before submitting the changes to the system.
Restarting the optimization service
The optimization service is a daemon that executes in the background, performing required operations.
Some configuration settings apply to the optimization service. When you change settings for features that depend on the optimization service, you must restart the service for the changes to take effect.
To restart the service, click
Restart Services or choose Administration > Maintenance: Services and then restart the service from the Services page. For details, see
Starting and stopping the optimization service.
Signing out
Click Sign out in the upper-right corner of the page to sign out of the current session.
Printing pages and reports
You can print Management Console pages and reports using the print option on your web browser.
To print pages and reports
•Choose File > Print in your web browser to open the Print dialog box.
Getting help
The Help page provides these options:
•Online Help - View browser-based online help.
•Technical Support - View links and contact information for Riverbed Support.
•Appliance Details - View appliance information such as model number, hardware revision type, and serial number currently installed on the appliance.
•Software Version(s) - View the RiOS version and build number.
•MIB Files - View Riverbed and appliance MIB files in text format.
Displaying online help
The Management Console provides page-level help for the appliance.
To display online help in the Management Console
•Click the question mark (?) icon next to the page title. The help for the page appears in a new browser window.
Downloading documentation
The Riverbed Support site contains PDF versions of the SteelHead User Guides and the Riverbed Command-Line Interface Reference Manual.
To download the PDF versions of the user’s guide or command-line interface reference manual
1. Select Help in the menu bar to display the Help page.
The Support site appears.
3. Select the product name.
4. Select the product version from the Display Version drop-down list.
5. Select PDF or HTML next to the document name to download the document.
Next steps
This table describes a basic approach to configuring the SteelHead.
Task | Reference |
1. Become familiar with basic and advanced deployment types. | SteelHead Deployment Guide |
2. Make decisions about where to deploy SteelHeads, and what features to use. | Riverbed Professional Services |
3. Install appliances and optional interface cards. | SteelHead Installation and Configuration Guide Network and Storage Card Installation Guide |
4. Configure optimization traffic with in-path rules. | |
5. Enable optimization features related to your deployment. | |
6. Define your applications, QoS profiles, and view of all available networks for use with application-level Quality of Service (QoS) and WAN path selection. | |
7. Distribute administrative responsibility by configuring secure access for other administrators, monitor users, or other types of users you choose to create. | |
8. Modify default system administration settings. | |
9. Modify host and network settings you initially set with the installation wizard. | |
10. Save your configuration changes and restart services as necessary. | |
11. View logs and reports to verify your deployment. | |
12. Troubleshoot (if necessary). | SteelHead Deployment Guide |