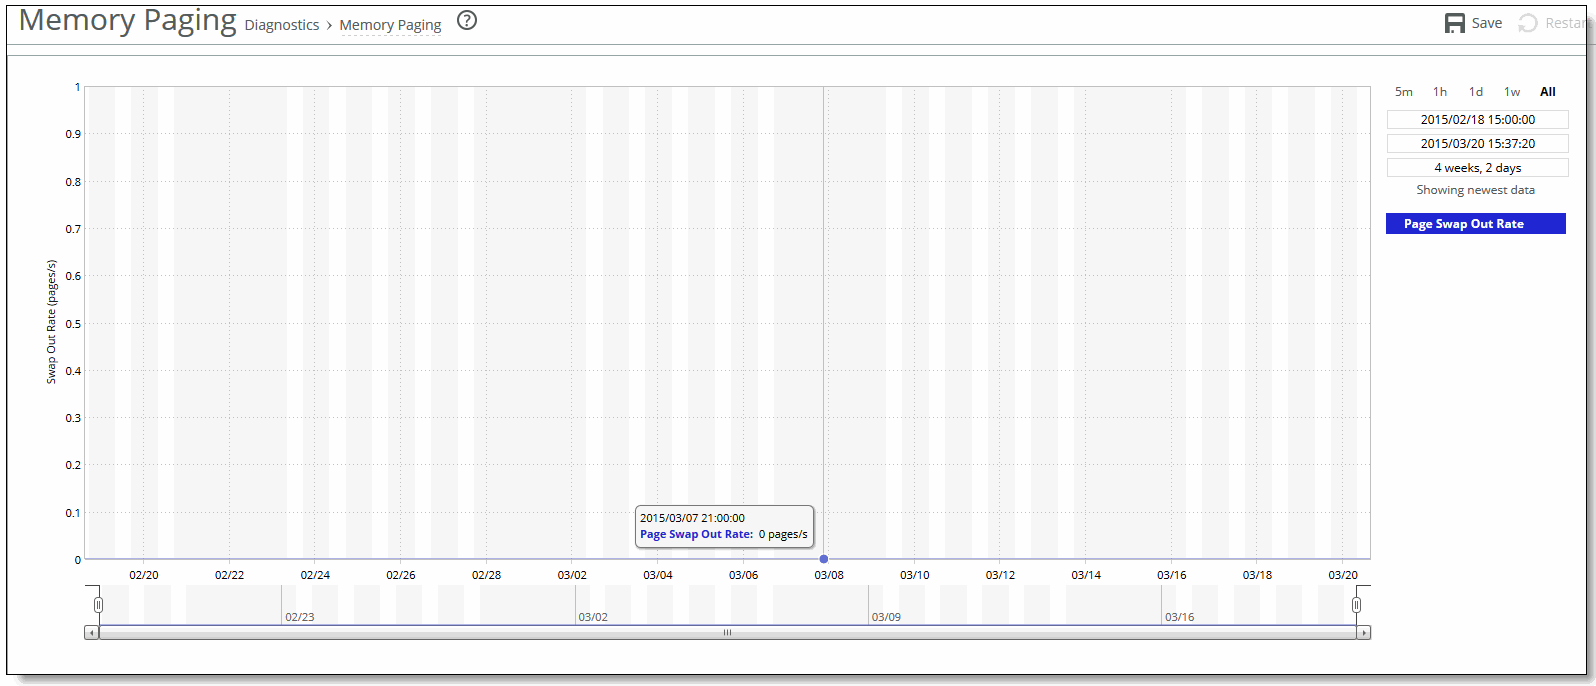
Figure: Memory Paging Page

Data Series | Descriptions |
Page Swap Out Rate | Specifies the total number of pages swapped per second. If 100 pages are swapped approximately every two hours, the SteelHead appliance is functioning properly. If thousands of pages are swapped every few minutes, contact Riverbed Support at https://support.riverbed.com. |

Field | Description |
Time Interval | Select a report time interval of 5 minutes (5m), 1 hour (1h), 1 day (1d), 1 week (1w), All, or type a custom date. All includes statistics for the last 30 days. Time intervals that do not apply to a particular report are dimmed. For a custom time interval, enter the start time and end time using the following format: yyyy/mm/dd hh:mm:ss You can quickly see the newest data and see data points as they are added to the chart dynamically. To display the newest data, click Show newest data. |