Verification and Troubleshooting
This section describes common satellite deployment problems and solutions. This section includes the following topics:
Analyzing Connection Optimization InformationAnalyzing Packets for Discovery Probe StrippingUnderstanding the Health of the Satellite SignalPotential Under Performance Due to Short Bottleneck BufferPotential Performance Impact of Loss at the Start of FlowVariance in SCPS PerformanceAnalyzing Connection Optimization Information
After you configure the SteelHead transport settings, you can verify if the solution is working as expected. You can determine which transport optimization method a connection is using on the Current Connections page in the Management Console and the CLI. This section includes the following:
Using the SteelHead Management Console to Investigate Connection DetailsUsing the Riverbed command-line interface to Investigate Connection DetailsUsing the SteelHead Management Console to Investigate Connection Details
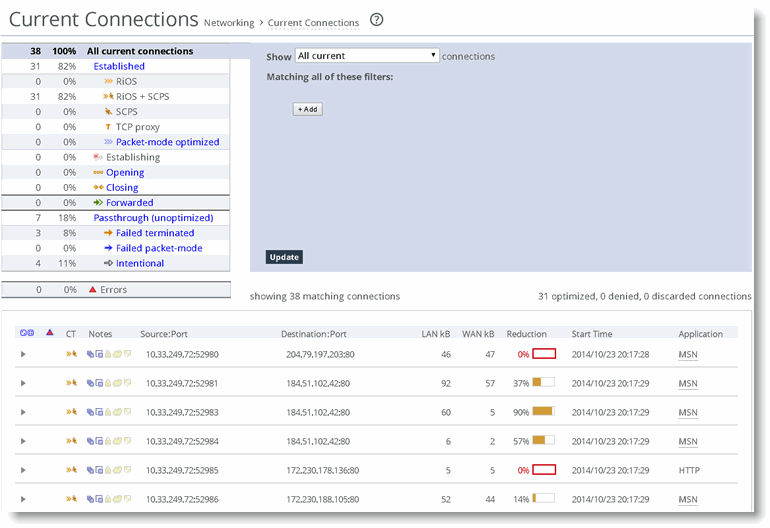
The Current Connections page in the Management Console provides extensive information about flows observed by the SteelHead. You can efficiently determine various information about flows using this report. To see the details for a flow, including transport settings, click the magnifying glass icon next to a specific connection.
Figure 15‑8. Current Connections

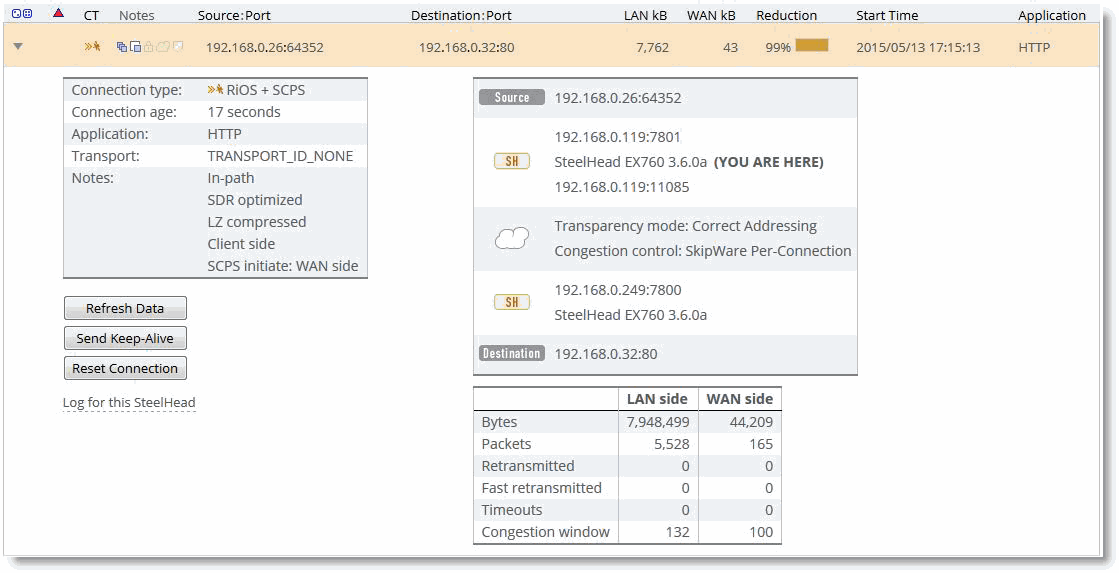
Figure 15‑9 shows the details of a specific connection. This flow is optimized and the Congestion control indicates SCPS per connection, which confirms it is using SCPS. The SCPS Initiate is set to WAN, which indicates that this SteelHead is on the client side of this session. If the SCPS Terminate is WAN, then this SteelHead is the server side for the flow. The SCPS Initiate and Terminate cannot both read WAN, because a TCP flow can be initiated only in a single direction. The WAN Congestion Control indicates the transport setting.
Figure 15‑9. Connection Information

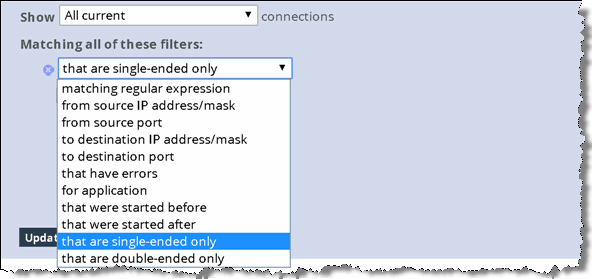
If the current connections report has a lot of flows, you can filter your view. To see only single-ended optimization flows, show All current connections, add a filter, and in the drop-down list select
that are single-ended only as shown in
Figure 15‑10.
Figure 15‑10. Filtering Flow View

Using the Riverbed command-line interface to Investigate Connection Details
The CLI provides extensive information about flows observed by the SteelHead. The show connections command provides a summary list of the connections flowing through a SteelHead. You can use this command with SCPS to quickly see which flows are optimized (O), single-ended optimized (S), and which flows are pass-through (P, PI, PU). Singled-ended optimized flows are included in the established optimized flow total of the show connections command. If you want more detail, use the show connections optimized full command. See the following examples for details.
SH # show connections
T Source Destination App Rdn Since
--------------------------------------------------------------------------------
SO 192.168.139.129:49588 172.16.2.100:80 TCP 0% 2013/07/01 05:26:03
SO 192.168.139.129:49589 172.16.2.100:80 TCP 0% 2013/07/01 05:26:03
SO 192.168.139.129:49590 172.16.2.100:80 TCP 0% 2013/07/01 05:26:03
SO 192.168.139.129:49591 172.16.2.100:80 TCP 0% 2013/07/01 05:26:05
SO 192.168.139.129:49592 172.16.2.100:80 TCP 0% 2013/07/01 05:26:05
SO 192.168.139.129:49593 172.16.2.100:80 TCP 0% 2013/07/01 05:26:05
SO 192.168.139.129:49594 172.16.2.100:80 TCP 0% 2013/07/01 05:26:05
SO 192.168.139.129:49595 172.16.2.100:80 TCP 0% 2013/07/01 05:26:05
SO 192.168.139.129:49596 172.16.2.100:80 TCP 0% 2013/07/01 05:26:05
--------------------------------------------------------------------------------
All V4 V6
---------------------------------------------------------------
Established Optimized: 9 9 0
RiOS Only (O): 0 0 0
SCPS Only (SO): 9 9 0
RiOS+SCPS (RS): 0 0 0
TCP Proxy (TP): 0 0 0
Half-opened optimized (H): 0 0 0
Half-closed optimized (C): 0 0 0
Establishing (E): 0 0 0
Pass Through: 0 0 0
Passthrough Intentional (PI): 0 0 0
Passthrough Unintentional (PU): 0 0 0
Forwarded (F): 0 0 0
Discarded (not shown): 0
Denied (not shown): 0
---------------------------------------------------------------
Total: 9 9 0
For more detail, use the show connection command options. The syntax requires very specific inputs, and it must be executed while the flow is established through the SteelHead:
show connection srcip <IP ADDR> srcport <port> dstip <ipaddr> dstport <port>
You can look at the IP address and port requirements in the show connections flow table. An example of this command follows. The TCP congestion control mechanism is listed in the middle after WAN visibility mode:
SH # show connection srcip 192.168.139.129 srcport 49588 dstip 172.16.2.100 dstport 80
Connection not found.
SH # show connection srcip 192.168.139.129 srcport 49597 dstip 172.16.2.100 dstport 80
Type: Single-ended optimized
Optimization Policy: None
Source: 192.168.139.129:49597
Destination: 172.16.2.100:80
Application: TCP
Reduction: 0%
Since: 2013/07/01 05:27:19
Cloud Acceleration State: None
Source Side Statistics:
TCP Congestion Algorithm: Skipware Per Connection
Bytes: 328301
Packets: 273
Retransmitted: 0
Fast Retransmitted: 0
Timeouts: 0
Congestion Window: 235
Destination Side Statistics:
TCP Congestion Algorithm: New Reno
Bytes: 328301
Packets: 105
Retransmitted: 0
Fast Retransmitted: 0
Timeouts: 0
Congestion Window: 4
In most situations, it is easier to use the Current Connections page rather than the CLI for flow investigation. For details, see
Using the SteelHead Management Console to Investigate Connection Details.
Analyzing Packets for Discovery Probe Stripping
RiOS auto-discovery and SCPS both rely on TCP options to function properly. Some network devices might strip the TCP options and negatively impact discovery or SCPS. In satellite environments, the satellite modems can have TCP acceleration enabled, which might strip TCP options and prevent the SteelHeads from automatically discovering one another.
This section describes how to troubleshoot this issue. You can confirm that TCP options are being stripped by capturing the SYN and SYN/ACK packets on the WAN interface of the server-side SteelHead and looking for TCP options decimal 76 and/or 78. If you are using SCPS, also look for TCP option decimal 20.
On the server-side SteelHead, you can use the following commands to capture only SYN and SYN/ACK packets for the wan0_0 interface:
enable
tcpdump -i wan0_0 -s 150 -w myfilename.cap 'tcp[13] & 2 = 2'
Press Ctrl+C to stop the packet capture from the CLI.
You can also execute and stop the capture in the Management Console Reports > Diagnostics: TCP Dumps page. From this page, you can download the capture file. If you are running RiOS v7.0 or later, you can use Pilot Enterprise to remotely start, stop, and analyze packet captures.
After you have downloaded the capture file, open it with a packet analyzer.
If you are using Wireshark 1.6.1 or later to analyze packets, the information row in the Pack List pane begins with S+ or SA+ if a RiOS auto-discovery probe is present in the TCP option field of a SYN or SYN/ACK, respectively. If you have many packets, use the Wireshark display filter tcp.options.rvbd.probe==1 to display packets with RiOS discovery probes in the TCP option field.
To filter just for SCPS TCP options, use the display filter tcp.options.scps==1. Remember that SCPS TCP options are applied to only SYN or SYN/ACK packets. To filter for both RiOS and SCPS discovery probes, use the Wireshark display filter tcp.options.rvbd.probe==1 || tcp.options.scps==1. If you do not see any packets with RiOS or SCPS discovery probes, you likely have satellite modems stripping the TCP options field due to TCP acceleration.
After you select the desired packet, inspect the TCP option field to confirm that if the appropriate discovery probes are present. If they are not present at the server-side SteelHead, some device is stripping the probes: for example, a satellite modem or firewall.
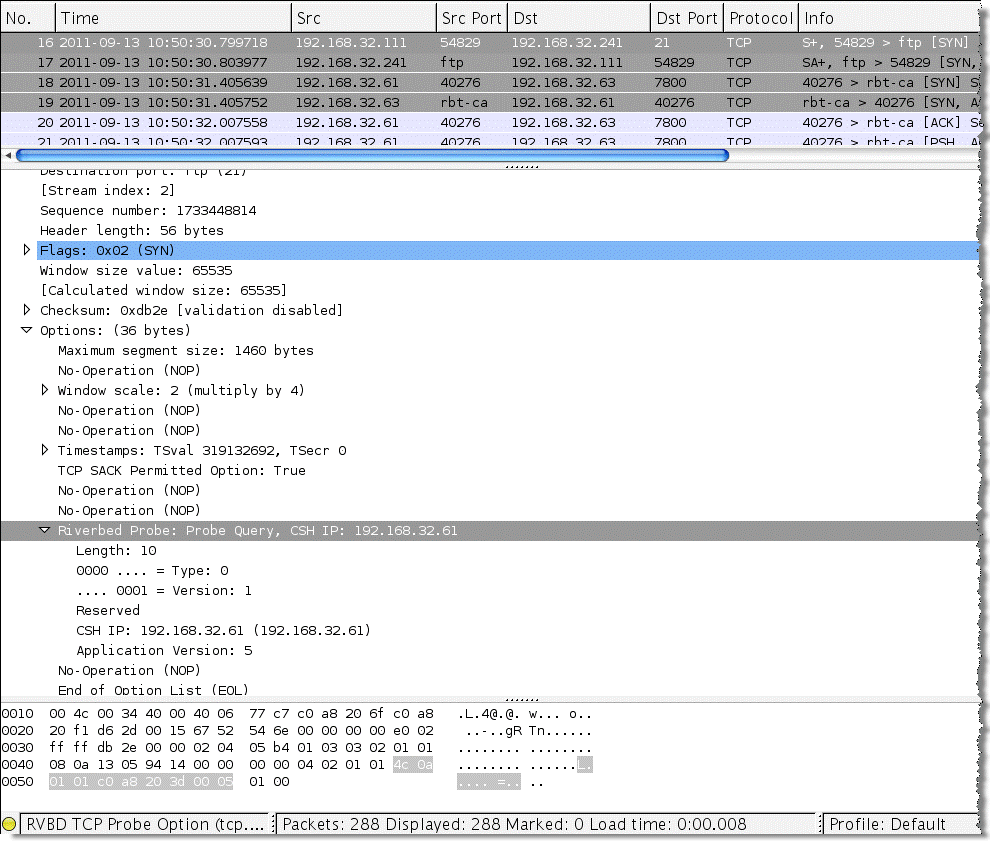
Figure 15‑11 shows that the SYN packet (#16) is highlighted in Wireshark. In the Packet List pane, the Information column starts with S+, which denotes that the packet has a RiOS discovery probe in the TCP option field. In the Packet Details pane, the TCP option entry from the SteelHead is highlighted in gray, and the details of the probe are decoded. In the Packet Bytes pane, you can see that the actual bytes for the RiOS discovery probe are highlighted and begin with 4c (0x4c is the hexadecimal representation of decimal 76).
Figure 15‑11. Packet Information in Wireshark

If you use Wireshark often to analyze SteelHead performance, you can use color filters to differentiate traffic.
To create Wireshark color filters
In Wireshark, choose View > Coloring Rules.
The Coloring Rules dialog box opens.
Click New.
Create a filter name, enter the desired display filter, and set your desired colors.
Click OK.
You can move the new color rule up or down so that it matches traffic accordingly. Remember that the first coloring rule that is matched is applied to the packet, so the order of color rules is very important.
Understanding the Health of the Satellite Signal
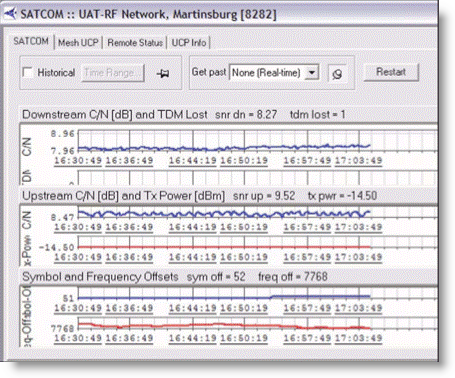
Terms such as such as signal-to-noise ratio, TDM loss, and other satellite words and abbreviations might be foreign to you. To assist in troubleshooting, you should have a team of satellite experts in your NOC or your service provider's NOC/teleport. When you contact them, the primary questions you want to understand are:
What is the utilization of the remote site's channel?What is the bit error rate for the specific remote site, and is it within an environment's comfort zone?To analyze a problem, most satellite engineers have a management tool available to track performance. For example, you can use iDirect iMonitor to monitor the health of iDirect hub and remote equipment. Using iMonitor's SATCOM view, you can track performance on a satellite link for an individual remote on the upstream and downstream channels.
Figure 15‑12 shows a graph from the SATCOM view in iDirect iMonitor.
Figure 15‑12. SATCOM

Having your own network monitoring equipment to monitor TCP health, specifically TCP loss/retransmissions, provides an additional tool in the network infrastructure to monitor network health. Riverbed Cascade, NetShark, and Pilot are capable of monitoring these metrics at various granularities.
Potential Under Performance Due to Short Bottleneck Buffer
The bottleneck buffer in the path is most commonly associated with the device connecting to both the high speed LAN and lower-speed WAN. This device is responsible for absorbing the high rate of packets from the LAN and holding them until these packets can be transmitted over the WAN. Because this device can hold packets the size or length of this buffer, it can have an impact on performance. Remember that the bottleneck buffer can be a satellite modem or a router in the path.
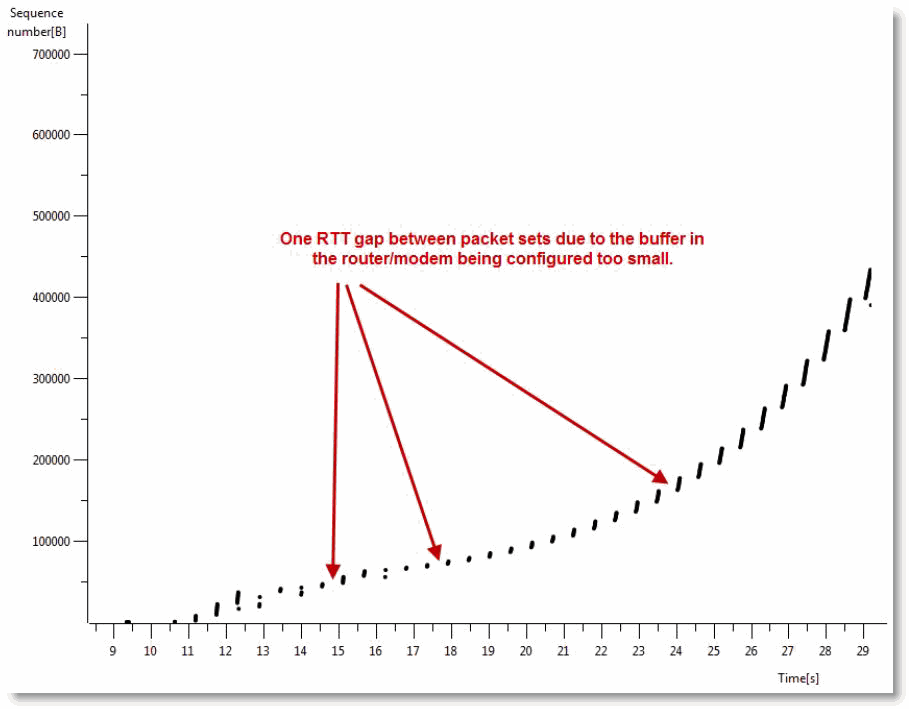
Figure 15‑13 shows the bottleneck buffer configured with a buffer size equivalent to 20 milliseconds when the link speed is 2 Mbps with an RTT of 550 milliseconds. The graph shows loss occurs early in the connection and is consistent throughout the connection. A perceptible one RTT gap can be noticed.
Figure 15‑13. Small-Sized Buffer

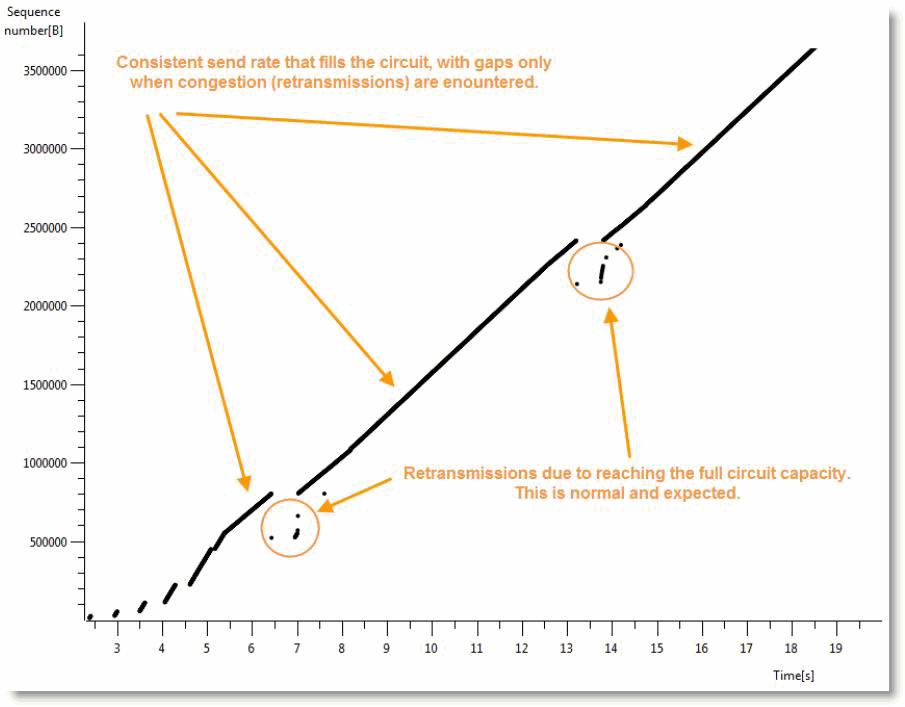
After the buffer size has been changed, a different pattern emerges. The SteelHead can send data at a continuous rate to fill the WAN circuit. The loss that occurs is normal due to TCP continually detecting if there is a higher available rate.
Figure 15‑14. Proper-Sized Buffer

Potential Performance Impact of Loss at the Start of Flow
TCP flows are most vulnerable to loss at the beginning of the flow. This is due to the initial TCP window size, which is very small at startup. When a TCP flow detects a lost packet in the first several turns, it can negatively impact the acceleration of the flow. Due to the latency in satellite networks, when this occurs, some TCP stacks take significantly longer to recover and accelerate the flow up to a reasonable speed.
When testing in labs, it is very important that you execute adequate flows against each test so that you capture a valid statistical sampling. This is critical because loss that coincidentally occurs at the start of flow negatively influences a single test for a certain vendor (Vendor A). Whereas the same test for Vendor B might not realize loss at the beginning of a flow, it might perform much better due to where the loss occurred, relative to the flow's life, and not specifically due to a more superior technology.
Variance in SCPS Performance
You might find that the TCP stacks of third-party SCSP solutions vary significantly. This can lead to different performance results when running the same transaction or test. When interoperating, you can find variance in performance between third-party devices, or variance depending on the direction data is transmitted. If you have questions or concerns about variance between SCPS solutions, it is best to engage all vendors in a joint discussion. Riverbed recommends that you have device configurations and packet captures from all devices to analyze during the discussion.
