Alarm Status report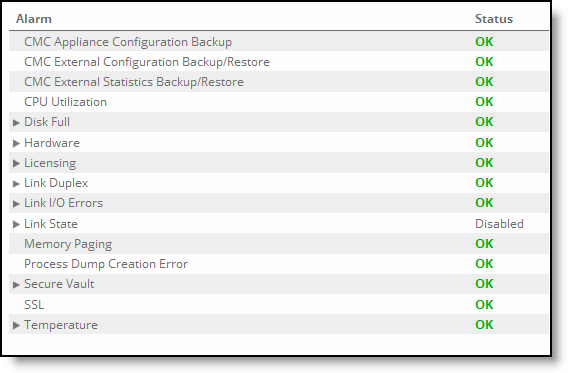

Alarm | Reason |
CPU Utilization | Displays an alarm when the system has reached the CPU threshold for any of the CPUs in the appliance. If the system has reached the CPU threshold, check your settings. If your alarm thresholds are correct, reboot the appliance. If more than 100 MBs of data is moved through an appliance while performing PFS synchronization, the CPU utilization can become high and result in a CPU alarm. This CPU alarm isn’t cause for concern. |
Disk Full | Displays an alarm when the system partitions (not the RiOS data store) are full or almost full. For example, RiOS monitors the available space on /var that’s used to hold logs, statistics, system dumps, TCP dumps, and so on. This alarm monitors these system partitions: Partition “/boot Full” Free Space Partition “/bootmgr Full” Free Space Partition “/config Full” Free Space Partition “/data Full” Free Space Partition “/proxy” Free Space Partition “/var” Free Space |
Hardware | •Flash Error - Indicates an error with the flash drive hardware. •IPMI - Indicates an Intelligent Platform Management Interface (IPMI) event. (Not supported on all appliance models.) This alarm triggers when there has been a physical security intrusion. These events trigger this alarm: –Chassis intrusion (physical opening and closing of the appliance case) –Memory errors (correctable or uncorrectable ECC memory errors) –Hard drive faults or predictive failures –Power supply status or predictive failure By default, this alarm is enabled. |
Licensing | Displays an alarm when your licenses are current. •Autolicense critical event - This alarm triggers on a SteelHead (virtual edition) appliance when the Riverbed Licensing Portal can’t response to a license request with valid licenses. The Licensing Portal can’t issue a valid license for one of these reasons: – A newer SteelHead (virtual edition) appliance is already using the token, so you can’t use it on the SteelHead (virtual edition) appliance displaying the critical alarm. Every time the SteelHead (virtual edition) appliance attempts to refetch a license token, the alarm retriggers. –The token has been redeemed too many times. Every time the SteelHead (virtual edition) appliance attempts to refetch a license token, the alarm retriggers. •Autolicense informational event - This alarm triggers if the Riverbed Licensing Portal has information regarding the licenses for a SteelHead (virtual edition) appliance. For example, the SteelHead (virtual edition) appliance displays this alarm when the portal returns licenses that are associated with a token that has been used on a different SteelHead (virtual edition) appliance. •Insufficient Appliance Management License(s) - This alarm triggers if there aren’t enough licenses to manage all connected appliances. •Invalid License(s) - This alarm triggers if there is any invalid license. •Licenses Expired - This alarm triggers if one or more features has at least one license installed, but all of them are expired. •Licenses Expiring - This alarm triggers if the license for one or more features is going to expire within two weeks. •License(s) Missing - This alarm triggers if any licenses are missing. Note: The licenses expiring and licenses expired alarms are triggered per feature. For example: if you install two license keys for a feature, LK1-FOO-xxx (expired) and LK1-FOO-yyy (not expired), the alarms don’t trigger, because the feature has one valid license. |
Link Duplex | Displays an alarm and sends an email notification when an interface wasn’t configured for half-duplex negotiation but has negotiated half-duplex mode. Half-duplex significantly limits the optimization service results. The alarm displays which interface is triggering the duplex alarm. By default, this alarm is enabled. |
Link I/O Errors | Displays an alarm when the error rate on an aux or primary interface has exceeded 0.1 percent while either sending or receiving packets. This threshold is based on the observation that even a small link error rate reduces TCP throughput significantly. A properly configured LAN connection experiences very few errors. The alarm clears when the error rate drops below 0.05 percent. The alarm clears when the rate drops below 0.05 percent. |
Link State | Displays an alarm and sends an email notification if an Ethernet link is lost due to an unplugged cable or dead switch port. Depending on that link is down, the system can no longer be optimizing and a network outage could occur. This condition is often caused by surrounding devices, like routers or switches, interface transitioning. This alarm also accompanies service or system restarts on the appliance. For aux and primary interfaces. By default, this alarm is disabled. |
Memory Paging | Displays an alarm when the system has reached the memory paging threshold. If 100 pages are swapped approximately every two hours the SteelHead is functioning properly. If thousands of pages are swapped every few minutes, then reboot the SteelHead. If rebooting doesn’t solve the problem, contact Riverbed Support at https://support.riverbed.com. |
Process Dump Creation | Displays an alarm when the system has detected an error while trying to create a process dump. This alarm indicates an abnormal condition where RiOS can’t collect the core file after three retries. It can be caused when the /var directory that’s used to hold system dumps is reaching capacity or other conditions. When this alarm is raised, the directory is blacklisted. |
SCC Appliance Configuration Backup | Displays an alarm when the daily back up has failed. |
SCC External Configuration Backup/Restore | Displays an alarm when the external configuration backup has failed. It updates every 30 seconds. |
SCC External Statistics Backup/Restore | Displays an alarm when the external statistics backup has failed. It updates every 30 seconds. |
SCC Underprovisioned Virtual Machine | Displays an alarm when the an under provisioned virtual SteelHead is detected. |
Secure Vault | Enables an alarm and sends an email notification if the system encounters a problem with the secure vault: •Secure Vault Locked - Needs Attention - Indicates that the secure vault is locked. To optimize SSL connections or to use RiOS data store encryption, the secure vault must be unlocked. Choose Appliance > Secure Vault and unlock the secure vault. |
SSL | Enables an alarm if an error is detected in your SSL configuration: •Non-443 SSL Servers - Indicates that during a RiOS upgrade (for example, from 5.5 to 6.0), the system has detected a preexisting SSL server certificate configuration on a port other than the default SSL port 443. SSL traffic can’t be optimized. To restore SSL optimization, you can add an in-path rule to the client-side SteelHead to intercept the connection and optimize the SSL traffic on the nondefault SSL server port. After adding an in-path rule, you must clear this alarm manually by entering this CLI command: stats alarm non_443_ssl_servers_detected_on_upgrade clear •SSL Certificates Error - Indicates that an SSL peering certificate has failed to reenroll automatically within the Simple Certificate Enrollment Protocol (SCEP) polling interval. •SSL Certificates Expiring - Indicates that an SSL certificate is about to expire. •SSL Certificates SCEP - Indicates that an SSL certificate has failed to reenroll automatically within the SCEP polling interval. |
Temperature | •Critical Temperature - Enables an alarm and send an email notification of the CPU temperature exceeds the rising threshold. When the CPU returns to the reset threshold, the critical alarm is cleared. The default value for the rising threshold temperature is 70ºC; the default threshold temperature is 67ºC. •Warning Temperature - Enables an alarm and sends an email notification if the CPU temperature approaches the rising threshold. When the CPU returns to the reset threshold, the waning alarm is cleared. |

Control | Description |
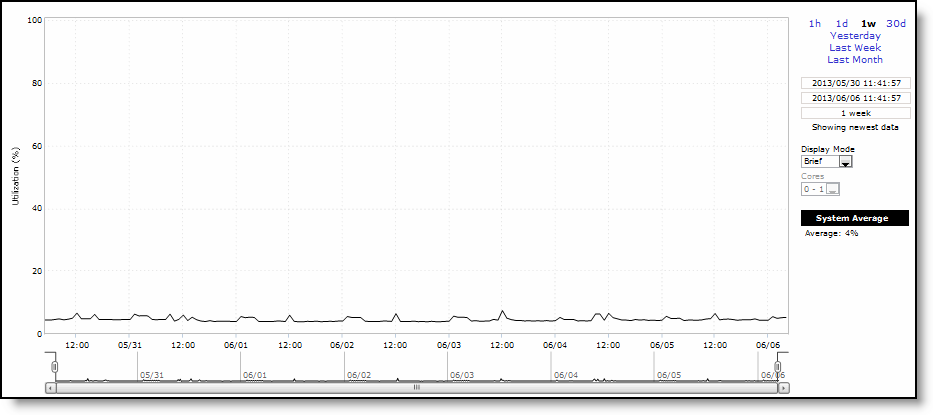
Time Interval | Select a report time interval of 1 hour (1h), 1 day (1d), 1 week (1w), 30 days (30d), yesterday, last week, or last month. Time intervals that don’t apply to a particular report are dimmed. For a custom time interval, enter the start time and end time using the format yyyy/mm/dd hh:mm:ss You can quickly see the newest data and see data points as they’re added to the chart dynamically. To display the newest data, click Show newest data. |
Display Mode | Select one of these displays from the drop-down list: •Brief - Displays the CPU percentages for each RiOS core individually. The individual cores appear with a number and a color in the data series. To hide or display a core in the plot area, select or clear the check box next to the core name. •Detailed - Displays the CPU utilization percentage of all cores combined as a system-wide average. |
Cores | Select the cores from the drop-down list. |
Control | Description |
Export To | Select either the Email or URL option from the drop-down list. |
Email Addresses | (Only displays when Email is selected.) Specify the email address of the recipient. |
Email Subject | (Only displays when Email is selected.) Specify the subject. |
Destination URL | (Only displays when URL is selected.) Specify the URL. |
Format | Select HTML, CSV, or PDF from the drop-down list. |
Per Appliance Report | Enables appliance report settings. Note: Generates graphs per appliance for HTML/PDF reports. Note: Generates one CSV per appliance for CSV reports. |
Export Now | Select Export Now and click Export to start the export immediately. |
Schedule Export | Select Schedule Export and specify the start date, time, and frequency of the export. Use this format: yyyy/mm/dd hh:mm:ss |
Export | Click Export to export the configuration. |
Printable view | Displays the print menu. |
Field | Description |
Pages Swapped Out | Specifies the total number of pages swapped. If 100 pages are swapped approximately every two hours the SteelHead is functioning properly. If thousands of pages are swapped every few minutes, contact Riverbed Support at https://support.riverbed.com. |
Control | Description |
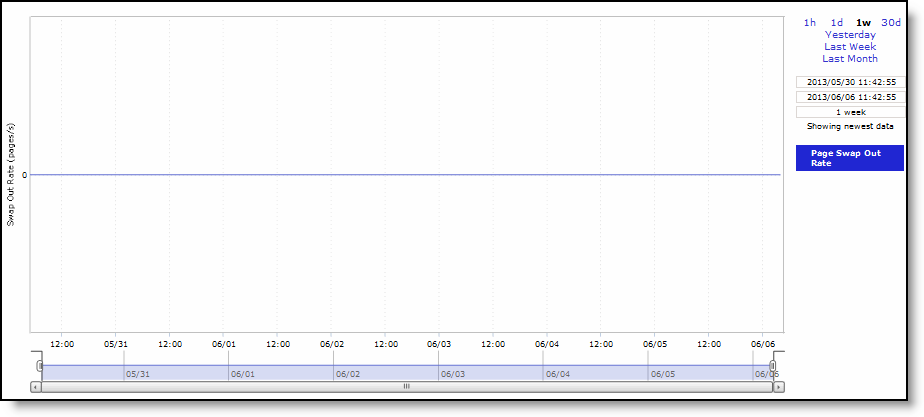
Time Interval | Select a report time interval of 1 hour (1h), 1 day (1d), 1 week (1w), 30 days (30d), yesterday, last week, or last month. Time intervals that don’t apply to a particular report are dimmed. For a custom time interval, enter the start time and end time using the format yyyy/mm/dd hh:mm:ss You can quickly see the newest data and see data points as they’re added to the chart dynamically. To display the newest data, click Show newest data. |
Page Swap Out Rate | Specifies the total number of pages swapped per second. If 100 pages are swapped approximately every two hours the SteelHead is functioning properly. If thousands of pages are swapped every few minutes, contact Riverbed Support at https://support.riverbed.com. |
Control | Description |
Export To | Select either the Email or URL option from the drop-down list. |
Email Addresses | (Only displays when Email is selected.) Specify the email address of the recipient. |
Email Subject | (Only displays when Email is selected.) Specify the subject. |
Destination URL | (Only displays when URL is selected.) Specify the URL. |
Format | Select HTML, CSV, or PDF from the drop-down list. |
Per Appliance Report | Enables appliance report settings. Note: Generates graphs per appliance for HTML/PDF reports. Note: Generates one CSV per appliance for CSV reports. |
Export Now | Select Export Now and click Export to start the export immediately. |
Schedule Export | Select Schedule Export and specify the start date, time, and frequency of the export. Use this format: yyyy/mm/dd hh:mm:ss |
Export | Click Export to export the configuration. |
Printable view | Displays the print menu. |

Control | Description |
Show | Select Current Log or one of the archived logs from the drop-down list. |
Lines per page | Specify the number of lines you want to display on the page. |
Jump to | Select one of these options from the drop-down list: •Page - Specify the number of pages you want to display. •Time - Specify the time (yyyy/mm/dd hh:mm:ss) of the pages you want to display. |
Filter | Select one of these options from the drop-down list: •Regular Expression - Specifies only those connections that match the expression used to filter the display. Use this format in the text field: x.x.x.x[/mask][:port] •Error or higher - Displays Error level logs or higher. •Warning or higher - Displays Warning level logs or higher. •Notice or higher - Displays Notice level logs or higher. •Info or higher - Displays Info level logs or higher. |

Control | Description |
Show | Select Current Log or one of the archived logs from the drop-down list. |
Lines per page | Specify the number of lines you want to display on the page. |
Jump to | Select one of these options from the drop-down list: •Page - Specify the number of pages you want to display. •Time - Specify the time for the log you want to display. |
Filter | Select one of these options from the drop-down list: •Regular Expression - Specify only those connections that match the expression used to filter the display. Use this format in the text field: x.x.x.x[/mask][:port] •Error or higher - Displays the Error level logs or higher. •Warning or higher - Displays the Warning level logs or higher. •Notice or higher - Displays the Notice level logs or higher. •Info or higher - Displays the Info level logs or higher. |

Control | Description |
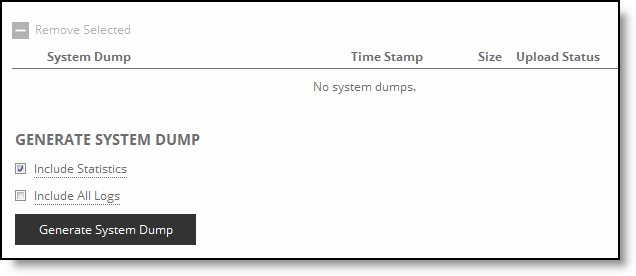
Appliance System Dump | Select the appliance from the drop-down list. |
System Dump | Select the check box next to the system dump. |
Generate System Dump | Select the type of information to include in the report: Include Statistics- Select the check box to collect and include CPU, memory, and other statistics in the system dump (this option is enabled by default). The statistics are useful while analyzing traffic patterns to correlate to an issue. The system adds the statistics to a file in the sysdump called stats.tgz. Include All Logs - Select the check box to remove the 50 MB limit for compressed log files, to include all logs in the system dump. |
Generate System Dump | Click Generate System Dump to generate the new system dump. System Dumps generates on the selected appliance and displays in the Operations section with a pending status. |
Remove Selected | Select the check box next to the name and click Remove Selected. Because generating a system dump can take a while, a spinner appears during the system dump creation. When the system dump is complete, it appears in the list of links to download. |
Control | Description |
Download | Click Download to resize a copy of the system dump file. |
Upload to Riverbed Support | Enter the case number or the URL and click Upload to start the upload process. |

Control | Description |
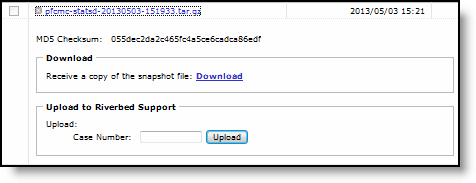
Download | Click Download to receive a copy of the snapshot file. |
Upload to Riverbed Support | Enter the case number or the URL and click Upload to start the upload process. |
Control | Description |
Add a New TCP Dump | Displays the controls for creating a TCP trace dump. |
Capture Name | Specify the name of the capture file. Use a unique filename to prevent overwriting an existing TCP dump. The default filename uses this format: <hostname>_<interface>_<time-stamp>.cap Where <hostname> is the hostname of the SCC, <interface> is the name of the interface selected for the trace (for example, lan0_0, wan0_0), and <time-stamp> is in the yyyy/mm/dd hh:mm:ss format. If this trace dump relates to an open Riverbed Support case, specify the capture filename case_<number> where <number> is your Riverbed Support case number: for example, case_12345. Note: The .cap file extension isn’t included with the filename when it appears in the capture queue. |
Capture Traffic Between | IPs - Specify the source IP addresses. Separate multiple IP addresses with a comma to include all addresses bidirectionally. The default setting is all IP addresses. Ports - Specify the source ports. Separate multiple ports with a comma. The default setting is all ports. and: IPs - Specify the destination IP addresses. Separate multiple IP addresses with a comma to include all addresses bidirectionally. The default setting is all IP addresses. Ports - Specify the destination ports. Separate multiple ports with a comma. The default setting is all ports. |
Capture Interfaces | Captures the TCP trace dump on the selected interface(s). You can select all interfaces or a base, in-path, or RSP interface. The default setting is none. You must specify a capture interface. If you select several interfaces at a time, the data is automatically placed into separate capture files. |
Capture Parameters | Specify the parameters: •Capture Untagged Traffic Only - Captures only traffic without a VLAN tag. Enabling this setting filters the trace dump by capturing all untagged packets. •Capture VLAN-Tagged Traffic Only - Captures only VLAN-tagged packets within a trace dump for a trunk port (802.1Q). Enabling this setting filters the trace dump by capturing only VLAN-tagged packets. This setting applies to physical interfaces only because logical interfaces (inpath0_0, mgmt0_0) don’t recognize VLAN headers. •Capture both VLAN and Untagged Traffic - Captures VLAN-tagged and untagged packets within a trace dump. •Capture Duration - Specify how long the capture runs, in seconds. The default value is 30. Specify 0 or continuous to initiate a continuous trace. When a continuous trace reaches the maximum space allocation of 100 MB, the oldest file is overwritten. •Maximum Capture Size (MB) - Specify the maximum capture file size, in megabytes. The default value is 100. We recommend a maximum capture file size of 1024 MB (1 GB). •Buffer Size - Optionally, specify the maximum amount of data, in kilobytes, allowed to queue up while awaiting processing by the TCP trace dump. The default value is 154 KB. •Snap Length - Optionally, select the snap length value for the capture file or specify a custom value. The snap length equals the number of bytes the report captures for each packet. Having a snap length smaller than the maximum packet size on the network enables you to store more packets, but you might not be able to inspect the full packet content. The default value is 1518 bytes. Select 65535 for a full packet capture (recommended for CIFS, MAPI, and SSL captures). When using jumbo frames, we recommend selecting 9018. The default custom value is 16383 bytes. •Number of Files to Rotate - Specify how many TCP trace dump files to rotate. The default value is 5. •Custom Flags - Specify custom flags to capture unidirectional traces. Examples: To capture all traffic to or from a single host host x.x.x.x To capture all traffic between a pair of hosts host x.x.x.x and host y.y.y.y To capture traffic between two hosts and two SteelHead inner channels: (host x.x.x.x and host y.y.y.y) or (host a.a.a.a and host b.b.b.b) |
Schedule Dump | Schedules the trace dump to run at a later date and time. •Start Date - Specify a date to initiate the trace dump in this format: yyyy/mm/dd •Start Time - Specify a time to initiate the trace dump in this format: hh:mm:ss |
Add | Adds the TCP trace dump to the capture queue. |

Field | Description |
IP Address | Displays the IP address of the peer appliance. |
Name | Displays the name of the peer appliance. |
Model | Displays the model of the peer appliance. |
Version | Displays the software version of the appliance’s operating system. |
Licenses | Displays the licenses applied to the appliance. |
Field | Description |
Peer IP / Hostname | Displays the hostname or IP address of the latency-detected peer appliance. |
Latency | Displays the amount of latency between the selected appliance and the peer in milliseconds. |
Cumulative Optimized Connections | Displays the number of optimized connections between the selected appliance and the peer. |
Cumulative Passthrough Connections | Displays the number of passthrough connections between the selected appliance and the peer. |
Current Peer State | Displays the state of the peer ‑ Optimized or Passthrough ‑ based on the current latency between the selected appliance and the peer. |
Field | Description |
Status | Displays the status of the appliance: •Appliance Reported Health - Provides the health status as reported by the managed appliance: Healthy, Healthy: Needs Attention, Degraded, and Critical. Also provides hardware model number, software version details, and links to the appliance logs. •SCC Evaluated Health - Displays the appliance health status as evaluated by the SCC. The SCC can detect additional problems that the managed appliance can’t. •Model - Displays the model number. •Appliance Version - Displays the appliance version. •Detailed Appliance Version - Displays detailed information about the appliance. •RiOS Version - Displays the RiOS version. •SteelFusion Version - Displays the SteelFusion version. •Current ESXi Version - Displays the current ESXi version. •Original ESXi Version - Displays the original ESXi version. •ESXi Support Status - Displays the ESXi support status. |
SCC Managed Appliance Alarms | Displays the different SCC alarms. It displays these SCC alarms: •Appliance too slow to respond - It updates every five minutes. •Configuration Change - It updates every five minutes. •Duplex Interface - It updates every five minutes. •High Appliance Usage Warning - It updates every five minutes. •PFS and RSP enabled together - It updates every five minutes. •Time drift - It updates every five minutes. •Too Many Half Open/Closed Connections - It updates every 30 seconds. •Unmanaged Appliances - It updates every 3 hours. For details about alarms, see “Configuring alarm parameters” on page 76. |
Control | Description |
Admission Control | Enables an alarm and sends an email notification if the appliance enters admission control. When this occurs, the appliance optimizes traffic beyond its rated capability and is unable to handle the amount of traffic passing through the WAN link. During this event, the appliance continues to optimize existing connections, but new connections are passed through without optimization. •Connection Limit - Indicates the system connection limit has been reached. Additional connections are passed through unoptimized. The alarm clears when the appliance moves out of this condition. •CPU - The appliance has entered admission control due to high CPU use. During this event, the appliance continues to optimize existing connections, but new connections are passed through without optimization. The alarm clears automatically when the CPU usage has decreased. •MAPI - The total number of MAPI optimized connections has exceeded the maximum admission control threshold. By default, the maximum admission control threshold is 85 percent of the total maximum optimized connection count for the client-side appliance. The appliance reserves the remaining 15 percent so that the MAPI admission control doesn’t affect the other protocols. The 85 percent threshold is applied only to MAPI connections. RiOS is now passing through MAPI connections from new clients but continues to intercept and optimize MAPI connections from existing clients (including new MAPI connections from these clients). RiOS continues optimizing non-MAPI connections from all clients. The alarm clears automatically when the MAPI traffic has decreased; however, it can take one minute for the alarm to clear. |
In RiOS 7.0, RiOS preemptively closes MAPI sessions to reduce the connection count in an attempt to bring the appliance out of admission control by bringing the connection count below the 85 percent threshold. RiOS closes the MAPI sessions in this order: –MAPI prepopulation connections –MAPI sessions with the largest number of connections –MAPI sessions with most idle connections –Most recently optimized MAPI sessions or oldest MAPI session –MAPI sessions exceeding the memory threshold •Memory - The appliance has entered admission control due to memory consumption. The appliance is optimizing traffic beyond its rated capability and is unable to handle the amount of traffic passing through the WAN link. During this event, the appliance continues to optimize existing connections, but new connections are passed through without optimization. No other action is necessary; the alarm clears automatically when the traffic has decreased. •TCP - The appliance has entered admission control due to high TCP memory use. During this event, the appliance continues to optimize existing connections, but new connections are passed through without optimization. The alarm clears automatically when the TCP memory pressure has decreased. By default, this alarm is enabled. | |
Asymmetric Routing | Enables an alarm if asymmetric routing is detected on the network. This is usually due to a failover event of an inner router or VPN. By default, this alarm is enabled. |
Connection Forwarding | Enables an alarm if the system detects a problem with a connection-forwarding neighbor. The connection-forwarding alarms are inclusive of all connection-forwarding neighbors. For example, if an appliance has three neighbors, the alarm triggers if any one of the neighbors are in error. In the same way, the alarm clears only when all three neighbors are no longer in error. •Cluster IPv6 Incompatible - Enables an alarm and sends an email notification if a connection-forwarding neighbor is running a RiOS version that’s incompatible with IPv6, or if the IP address configuration between neighbors doesn’t match. Neighbors must be running RiOS 8.5. •Multiple Interface - Enables an alarm and sends an email notification if the connection to an appliance in a connection forwarding cluster is lost. •Single Interface - Enables an alarm and sends an email notification if the connection to a SteelHead connection forwarding neighbor is lost. By default, this alarm is enabled. |
CPU Utilization | Enables an alarm and sends an email notification if the average and peak threshold for the CPU utilization is exceeded. When an alarm reaches the rising threshold, it is activated; when it reaches the lowest or reset threshold, it is reset. After an alarm is triggered, it isn’t triggered again until it has fallen below the reset threshold. By default, this alarm is enabled, with a rising threshold of 90 percent and a reset threshold of 70 percent. •Rising Threshold - Specify the rising threshold. When an alarm reaches the rising threshold, it is activated. The default value is 90 percent. •Reset Threshold - Specify the reset threshold. When an alarm reaches the lowest or reset threshold, it is reset. After an alarm is triggered, it isn’t triggered again until it has fallen below the reset threshold. The default value is 70 percent. |
Data Store | •Data Store Clean Required - Enables an alarm and sends an email notification if you need to clear the RiOS data store. •Corruption - Enables an alarm and sends an email notification if the RiOS data store is corrupt or has become incompatible with the current configuration. To clear the RiOS data store of data, restart the optimization service and click Clear the Data Store. If the alarm was caused by an unintended change to the configuration, the configuration can be changed to match the old RiOS data store settings again and then a service restart (without clearing) will clear the alarm. •Encryption Level Mismatch - Enables an alarm and sends an email notification if a data store error such as an encryption, header, or format error occurs. •Synchronization Error - Enables an alarm if RiOS data store synchronization has failed. The RiOS data store synchronization between two SteelHeads has been disrupted and the RiOS data stores are no longer synchronized. By default, this alarm is enabled. |
Disk Full | Enables an alarm if the system partitions (not the RiOS data store) are full or almost full. For example, RiOS monitors the available space on /var that’s used to hold logs, statistics, system dumps, TCP dumps, and so on. By default, this alarm is enabled. This alarm monitors these system partitions: •/Full •/boot Full •/bootmgr •/config Full •/esxi Full •/proxy Full •/scratch Full •/tmp/mnt/config Full •/var Full |
Domain Authentication Alert | Indicates that the system is either unable to communicate with the domain controller, or has detected an SMB signing error, or that delegation has failed. CIFS-signed and Encrypted-MAPI traffic is passed through without optimization. By default, this alarm is enabled. |
Domain Join Error | Enables an alarm if an attempt to join a Windows domain has failed. The number one cause of failing to join a domain is a significant difference in the system time on the Windows domain controller and the appliance. A domain join can also fail when the DNS server returns an invalid IP address for the domain controller. By default, this alarm is enabled. |
Link Duplex | Enables an alarm and sends an email notification when an interface wasn’t configured for half-duplex negotiation but has negotiated half-duplex mode. Half-duplex significantly limits the optimization service results. The alarm displays which interface is triggering the duplex alarm. By default, this alarm is enabled. |
Hardware | •Disk Error - Enables an alarm when one or more disks is offline. To see that disk is offline, enter this CLI command from the system prompt: show raid diagram By default, this alarm is enabled. This alarm applies only to the appliance RAID Series 3000, 5000, and 6000. •Fan Error - Enables an alarm and sends an email notification if a fan is failing or has failed and needs to be replaced. By default, this alarm is enabled. •Flash Error - Enables an alarm when the system detects an error with the flash drive hardware. By default, this alarm is enabled. •IPMI - Enables an alarm and sends an email notification if an Intelligent Platform Management Interface (IPMI) event is detected. (Not supported on all appliance models.) This alarm triggers when there has been a physical security intrusion. These events trigger this alarm: –Chassis intrusion (physical opening and closing of the appliance case) –Memory errors (correctable or uncorrectable ECC memory errors) –Hard drive faults or predictive failures –Power supply status or predictive failure By default, this alarm is enabled. •Memory Error - Enables an alarm and sends an email notification if a memory error is detected. For example, when a system memory stick fails. •Other Hardware Error - Enables an alarm if a hardware error is detected. These issues trigger the hardware error alarm: –The appliance doesn’t have enough disk, memory, CPU cores, or NIC cards to support the current configuration –The appliance is using a memory Dual In-line Memory Module (DIMM), a hard disk, or a NIC that’s not qualified by Riverbed –Other hardware issues By default, this alarm is enabled. •Power Supply - Enables an alarm and sends an email notification if an inserted power supply cord doesn’t have power, as opposed to a power supply slot with no power supply cord inserted. By default, this alarm is enabled. •RAID - Enables an alarm and sends an email notification if the system encounters an error with the RAID array (for example, missing drives, pulled drives, drive failures, and drive rebuilds). An audible alarm can also sound. To see if a disk has failed, enter this CLI command at the system prompt: show raid diagram For drive rebuilds, if a drive is removed and then reinserted, the alarm continues to be triggered until the rebuild is complete. Rebuilding a disk drive can take four to six hours. This alarm applies only to the SteelHead RAID Series 3000, 5000, and 6000. By default, this alarm is enabled. |
•SSD Write Cycle Level Exceeded - Enables an alarm if the accumulated SSD write cycles exceed a predefined write cycle 95 percent level on appliance models 7050L and 7050M. If the alarm is triggered, the administrator can swap out the disk before any problems arise. For details, see the Riverbed Command-Line Interface Reference Manual. By default, this alarm is enabled. | |
Licensing | Enables an alarm and sends an email notification if a license on the appliance is removed, is about to expire, has expired, or is invalid. This alarm triggers if the appliance has no MSPEC license installed for its currently configured model. •Appliance Unlicensed - This alarm triggers if the appliance has no BASE or MSPEC license installed for its currently configured model. •Autolicense Critical Event - This alarm triggers on a SteelHead (virtual edition) when the Riverbed Licensing Portal can’t response to a license request with valid licenses. The Licensing Portal can’t issue a valid license for one of these reasons: –A newer SteelHead (virtual edition) is already using the token, so you can’t use it on the Virtual SteelHead displaying the critical alarm. Every time the SteelHead (virtual edition) attempts to refetch a license token, the alarm retriggers. –The token has been redeemed too many times. Every time the SteelHead (virtual edition) attempts to refetch a license token, the alarm retriggers. •Autolicense Informational Event - This alarm triggers if the Riverbed Licensing Portal has information regarding the licenses for a SteelHead (virtual edition). For example, the SteelHead (virtual edition) displays this alarm when the portal returns licenses that are associated with a token that has been used on a different SteelHead (virtual edition). •Licenses Expired - This alarm triggers if one or more features has at least one license installed, but all of them are expired. •Licenses Expiring - This alarm triggers if the license for one or more features is going to expire within two weeks. Note: The licenses expiring and licenses expired alarms are triggered per feature. For example, if you install two license keys for a feature, LK1-FOO-xxx (expired) and LK1-FOO-yyy (not expired), the alarms don’t trigger, because the feature has one valid license. By default, this alarm is enabled. |
Link I/O Errors | Enables an alarm and sends an email notification when the link error rate exceeds 0.1 percent while either sending or receiving packets. This threshold is based on the observation that even a small link error rate reduces TCP throughput significantly. A properly configured LAN connection experiences very few errors. The alarm clears when the rate drops below 0.05 percent. You can change the default alarm thresholds by entering the alarm link_errors threshold xxxxx CLI command at the system prompt. For details, see the Riverbed Command-Line Interface Reference Manual. By default, this alarm is enabled. |
Link State | Enables an alarm and sends an email notification if an Ethernet link is lost due to a network event. Depending on that link is down, the system can no longer be optimizing and a network outage could occur. This is often caused by surrounding devices, like routers or switches interface transitioning. This alarm also accompanies service or system restarts on the appliance. For WAN/LAN interfaces, the alarm triggers if in-path support is enabled for that WAN/LAN pair. By default, this alarm is disabled. |
Memory Paging | Enables an alarm and sends an email notification if memory paging is detected. If 100 pages are swapped every couple of hours, the system is functioning properly. If thousands of pages are swapped every few minutes, contact Riverbed Support at https://support.riverbed.com. By default, this alarm is enabled. |
Neighbor Incompatibility | Enables an alarm if the system has encountered an error in reaching an appliance configured for connection forwarding. By default, this alarm is enabled. |
Network Bypass | Enables an alarm and sends an email notification if the system is in bypass failover mode. By default, this alarm is enabled. |
NFS V2/V4 Alarm | Enables an alarm and sends an email notification if the SteelHead detects that either NFSv2 or NFSv4 is in use. The appliance only supports NFSv3 and passes through all other versions. By default, this alarm is enabled. |
Optimization Service | •Internal Error - Enables an alarm and sends an email notification if the RiOS optimization service encounters a condition that can degrade optimization performance. By default, this alarm is enabled. •Service Status - Enables an alarm and sends an email notification if the RiOS optimization service encounters a service condition. By default, this alarm is enabled. The message indicates the reason for the condition. These conditions trigger this alarm: –Configuration errors. –An appliance reboot. –A system crash. –An optimization service restart. –A user enters the CLI command no service enable or shuts down the optimization service from the Management Console. –A user restarts the optimization service from either the SteelCentral Controller for SteelHead appliance or CLI. •Unexpected Halt - Enables an alarm and sends an email notification if the RiOS optimization service halts due to a serious software error. By default, this alarm is enabled. |
Process Dump Creation Error | Enables an alarm and sends an email notification if the system detects an error while trying to create a process dump. This alarm indicates an abnormal condition where RiOS can’t collect the core file after three retries. It can be caused when the /var directory is reaching capacity or other conditions. When the alarm is raised, the directory is blacklisted. By default, this alarm is enabled. |
Proxy File Service | Indicates that there has been a Proxy File Service (PFS) operation or configuration error: •Proxy File Service Configuration - Indicates that a configuration attempt has failed. If the system detects a configuration failure, attempt the configuration again. •Proxy File Service Operation - Indicates that a synchronization operation has failed. If the system detects an operation failure, attempt the operation again. By default, this alarm is enabled. |
Path Down | Indicates that one of the predefined paths for a connection is unavailable because it has exceeded either the timeout value for path latency or the threshold for observed packet loss. When a path fails, the SteelHead directs traffic through another available path. When the original path comes back up, the appliance redirects the traffic back to it. |
Proxy File Service | Indicates that there has been a PFS operation or configuration error: •Proxy File Service Configuration - Indicates that a configuration attempt has failed. If the system detects a configuration failure, attempt the configuration again. •Proxy File Service Operation - Indicates that a synchronization operation has failed. If the system detects an operation failure, attempt the operation again. By default, this alarm is enabled. |
Riverbed Service Platform | Enables an alarm for RSP. By default, this alarm is enabled. |
Secure Vault | Enables an alarm and sends an email notification if the system encounters a problem with the secure vault: •Secure Vault Locked - Indicates that the secure vault is locked. To optimize SSL connections or to use RiOS data store encryption, the secure vault must be unlocked. Choose Appliance > Secure Vault and unlock the secure vault. •Secure Vault New Password Recommended - Indicates that the secure vault requires a new, nondefault password. Reenter the password. •Secure Vault Not Initialized - Indicates that an error has occurred while initializing the secure vault. When the vault is locked, SSL traffic isn’t optimized and you can’t encrypt the RiOS data store. |
Software Compatibility | Enables an alarm and sends an email notification if the system encounters a problem with software compatibility: •Peer Mismatch - Needs Attention - Indicates that the appliance has encountered another appliance that’s running an incompatible version of system software. Refer to the CLI, SteelCentral Controller for SteelHead, or the SNMP peer table to determine that appliance is causing the conflict. Connections with that peer will not be optimized, connections with other peers running compatible RiOS versions are unaffected. To resolve the problem, upgrade your system software. No other action is required as the alarm clears automatically. •Software Version Mismatch - Degraded - Indicates that the appliance is running an incompatible version of system software. To resolve the problem, upgrade your system software. No other action is required as the alarm clears automatically. By default, this alarm is enabled. |
SSL | Enables an alarm if an error is detected in your SSL configuration. •Non-443 SSL Servers - Indicates that during a RiOS upgrade (for example, from 5.5 to 6.0), the system has detected a preexisting SSL server certificate configuration on a port other than the default SSL port 443. SSL traffic can’t be optimized. To restore SSL optimization, you can add an in-path rule to the client-side appliance to intercept the connection and optimize the SSL traffic on the nondefault SSL server port. After adding an in-path rule, you must clear this alarm manually by entering this CLI command: stats alarm non_443_ssl_servers_detected_on_upgrade clear •SSL Certificates Error (SSL CAs) - Indicates that an SSL peering certificate has failed to reenroll automatically within the Simple Certificate Enrollment Protocol (SCEP) polling interval. •SSL Certificates Error (SSL Peering CAs) - Indicates that an SSL peering certificate has failed to reenroll automatically within the Simple Certificate Enrollment Protocol (SCEP) polling interval. •SSL Certificates Expiring - Indicates that an SSL certificate is about to expire. •SSL Certificates SCEP - Indicates that an SSL certificate has failed to reenroll automatically within the SCEP polling interval. By default, this alarm is enabled. |
Storage Profile Switch Failed | Enables and alarm if the storage profile switch encountered a problem. By default, this alarm is enabled. |
System Detail Report | Enables an alarm if a system component has encountered a problem. By default, this alarm is enabled. |
Temperature | •Critical Temperature - Enables an alarm and sends an email notification if the CPU temperature exceeds the rising threshold. When the CPU returns to the reset threshold, the critical alarm is cleared. The default value for the rising threshold temperature is 70ºC; the default reset threshold temperature is 67ºC. •Warning Temperature - Enables an alarm and sends an email notification if the CPU temperature approaches the rising threshold. When the CPU returns to the reset threshold, the warning alarm is cleared. –Rising Threshold - Specify the rising threshold (ºC). When an alarm reaches the rising threshold, it is activated. The default value is 70ºC. –Reset Threshold - Specify the reset threshold (ºC). When an alarm reaches the lowest or reset threshold, it is reset. After an alarm is triggered, it isn’t triggered again until it has fallen below the reset threshold. The default value is 67ºC. |
Field | Description |
Main Hostname/IP | Displays the main hostname. |
IP Address | Displays the IP address of the branch. |
Port | Displays the port number. |
SteelFusion Edge Identifier | Displays the identifier for SteelFusion Edge. The value must match the value configured on the SteelFusion Edge. SteelFusion Edge identifiers are case sensitive. |
Redundant Remote Interfaces | Displays whether there is a redundant remote interface. |
Local Interfaces | Displays information for Target Details, Initiators, Initiator Groups, LUNs, and MPIO. |
Field | Description |
Disk Layout Mode | Displays the disk layout mode that allows space for the SteelFusion block store in the Disk Management page on the SteelFusion Edge. Free disk space is divided between the VSP and the Core block store. |
VSP Volume | Displays the free disk space available on the VSP. |
SteelFusion Volume | Displays the free disk space available on the SteelFusion block store. |
Field | Description |
Reduction | Displays the total decrease of data transmitted over the WAN. |
Peak Throughput | Displays the peak data transmitted. |
Data store Usage | Displays the percent of RiOS data store usage. |
Field | Description |
Established (Optimized) | Displays the total established active connections. |
Half Opened (Optimized) | Displays the total half-opened active connections. A half-opened connection is a TCP connection in that the connection hasn’t been fully established. Half-opened connections count toward the connection count limit on the appliance because, at any time, they can become a fully opened connection. If you’re experiencing a large number of half-opened connections, you can consider a more appropriately sized appliance. |
Half Closed (Optimized) | Displays the total half-closed active connections. Half-closed connections are connections that the appliance has intercepted and optimized but are in the process of becoming inactive. These connections are counted toward the connection count limit on the appliance. (Half closed connections can remain if the client or server doesn’t close their connections cleanly.) If you’re experiencing a large number of half-closed connections, you can consider a more appropriately sized appliance. |
Pass Through | Displays the total connections passed through, unoptimized when the connection limit has been reached. |
Total | Displays the sum of the counts described above. |
Field | Description |
Synchronization Connection | Indicates the status of the connection between the synchronized appliances. |
Synchronization Catch-Up | Indicates the status of transferring data between the synchronized appliances. Catch-Up is used for synchronizing data that wasn’t synchronized during the Keep-Up phase. |
Synchronization Keep-Up | Indicates the status of transferring new incoming data between the synchronized SteelHeads. |
Data Store Percentage Used (Since Last Clear) | Specifies the percentage of the RiOS data store that’s used. |
Field | Description |
Portal | Displays the portal name. |
Status | Displays the status of the portal (registered/unregistered). |
Service Ready | Displays whether the service is ready. |
Redirection | Displays the redirection of the cloud accelerator. |
Reason | Displays the reason for the redirection. |
Last Contact | Displays the name of the last contact. |
Field | Description |
Module | Specifies the SteelHead module. Select a module name to view details. A right arrow to the left of a module indicates that the report includes detailed information about a submodule. Click the > to view submodule details. This report examines these modules: •CPU - Displays information on idle time, system time, and user time per CPU. •Memory - Displays information on total, used, and free memory by percentage and in kilobytes. •CIFS - Click the right arrow and the submodule name to view details for unexpected shut downs and round trip statistics. •HTTP - Click the right arrow and the submodule name to view details for the URL Learning, Parse and Prefetch, and Object Prefetch Table optimization schemes. •Intercept - Click the right arrow to view statistics for message queue, GRE, and WCCP. Also includes table length and watchdog status. |
•MAPI - Click the right arrow and the submodule name to view details for: –Accelerators - Displays how many accelerator objects have been created for readahead, writebehind, and cached-mode folder synchronization. One accelerator object corresponds to the optimization of one particular Outlook action: –Readahead - Downloads an email attachment (in noncached Outlook mode or for public folders). –Writebehind - Uploads an email attachment. –Cache-sync - Downloads the new contents of a folder (in cached mode). | |
–Requests and responses - Displays the number of MAPI round trips used and saved. Includes the number of responses and faults along with the fault reason. For example, access denied. –MAPI decryption and encryption (RPCCR) - Displays whether MAPI decryption and encryption is enabled. Includes the number of client-side and server-side SteelHead encrypted MAPI sessions, along with details on how many sessions were not encrypted, how many sessions were successfully decrypted and encrypted, how many sessions were passed-through, and how many experienced an authentication failure. –Connection sessions - Displays the number of client-side and server-side SteelHead MAPI sessions, counting the number of MAPI 2000, 2003, 2007, and pass-through sessions. •Oracle Forms - Click the right arrow and submodule name to view details for native and HTTP mode key •Secure Peering - Click the right arrow and submodule name to view details for secure inner channels, including information on certificate and private key validity, peer SteelHead trust, and blacklisted servers. | |
•Splice-policy - Displays future connections matching the entries in the table. •SSL - Displays whether SSL optimization is enabled and details about the SSL configuration such as that advanced settings are in use. Click the right arrow and the submodule name to view details for the SSL outer and inner channels. | |
Status | Displays one of these results: •OK (Green) •Warning (Yellow) •Error (Red) •Disabled (Gray). Appears when you manually disable the module. |
Field | Description |
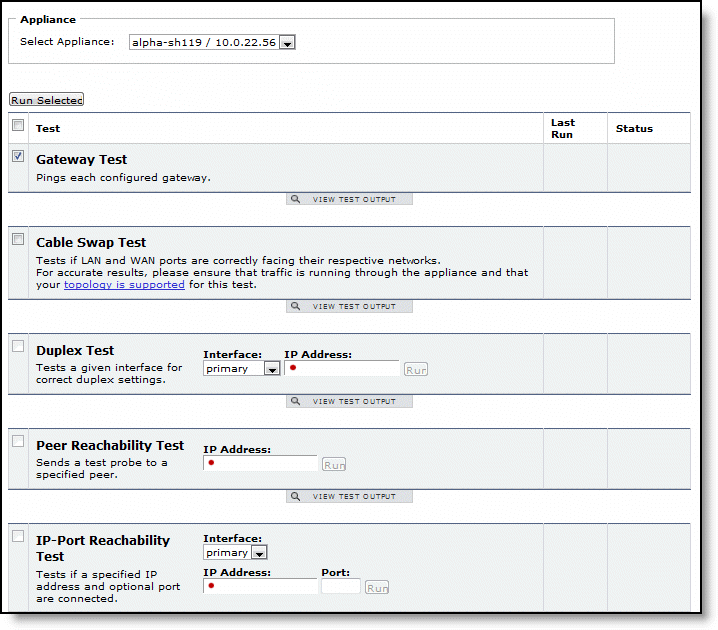
Gateway Test | Pings each configured gateway. |
Cable Swap Test | Tests if LAN and WAN ports are correctly facing their respective networks. For accurate results, ensure that traffic is running through the appliance and that the topology is supported for this test. For details about topologies, see the SteelHead Deployment Guide. |
Duplex Test | Tests a given interface for correct duplex settings. |
Peer Reachability Test | Sends a test probe to a specified peer. |
IP-Port Reachability Test | Tests if a specified IP address and optional port are connected. |
Control | Description |
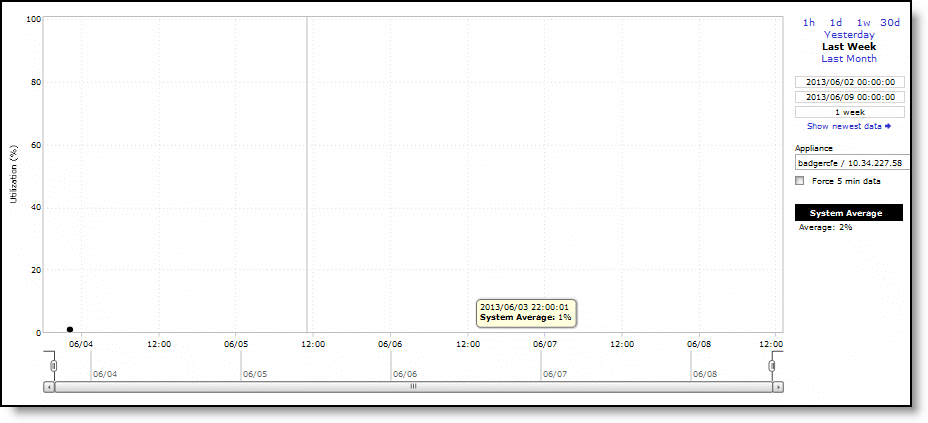
Time Interval | Select a report time interval of 1 hour (1h), 1 day (1d), 1 week (1w), 30 days (30d), yesterday, last week, or last month. Time intervals that don’t apply to a particular report are dimmed. For a custom time interval, enter the start time and end time using the format yyyy/mm/dd hh:mm:ss You can quickly see the newest data and see data points as they’re added to the chart dynamically. To display the newest data, click Show newest data. |
Appliance | Select an appliance from the drop-down list. |
Force best granularity | Select the check box to force the data. |
Control | Description |
Export To | Select either the Email or URL option from the drop-down list. |
Email Addresses | (Only displays when Email is selected.) Specify the email address of the recipient. |
Email Subject | (Only displays when Email is selected.) Specify the subject. |
Destination URL | (Only displays when URL is selected.) Specify the URL. |
Format | Select HTML, CSV, or PDF from the drop-down list. |
Per Appliance Report | Enables appliance report settings. Note: Generates graphs per appliance for HTML/PDF reports. Note: Generates one CSV per appliance for CSV reports. |
Export Now | Select Export Now and click Export to start the export immediately. |
Schedule Export | Select Schedule Export and specify the start date, time, and frequency of the export. Use this format: yyyy/mm/dd hh:mm:ss |
Export | Click Export to export the configuration. |
Printable view | Displays the print menu. |
Data Series | Description |
Page Swap Out Rate | Specifies the total number of pages swapped per second. If 100 pages are swapped approximately every two hours the SteelHead is functioning properly. If thousands of pages are swapped every few minutes, contact Riverbed Support at https://support.riverbed.com |
Control | Description |
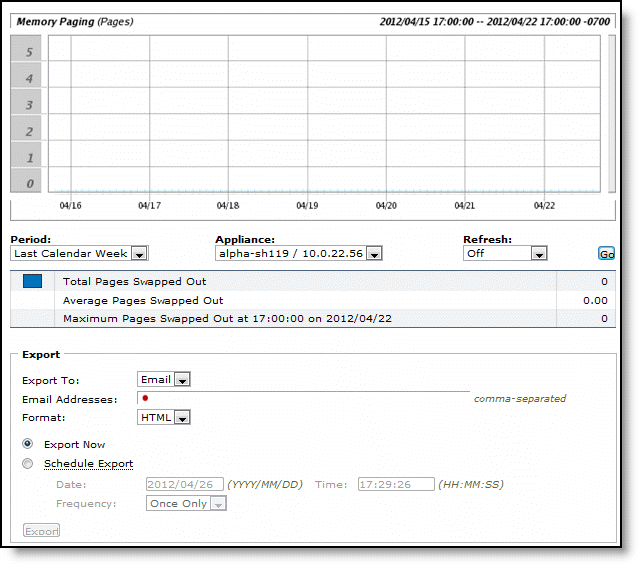
Time Interval | Select a report time interval of 1 hour (1h), 1 day (1d), 1 week (1w), All, or type a custom date. All includes statistics for the last 30 days. Time intervals that don’t apply to a particular report are dimmed. For a custom time interval, enter the start time and end time using this format: yyyy/mm/dd hh:mm:ss You can quickly see the newest data and see data points as they’re added to the chart dynamically. To display the newest data, click Show newest data. |
Appliance | Select an appliance from the drop-down list. |
Force best granularity | Select the check box to force the data. |
Control | Description |
Export To | Select either the Email or URL option from the drop-down list. |
Email Addresses | (Only displays when Email is selected.) Specify the email address of the recipient. |
Email Subject | (Only displays when Email is selected.) Specify the subject. |
Destination URL | (Only displays when URL is selected.) Specify the URL. |
Format | Select HTML, CSV, or PDF from the drop-down list. |
Per Appliance Report | Enables appliance report settings. Note: Generates graphs per appliance for HTML/PDF reports. Note: Generates one CSV per appliance for CSV reports. |
Export Now | Select Export Now and click Export to start the export immediately. |
Schedule Export | Select Schedule Export and specify the start date, time, and frequency of the export. Use this format: yyyy/mm/dd hh:mm:ss |
Export | Click Export to export the configuration. |
Printable view | Displays the print menu. |
Data Series | Description |
Max Threshold | Displays the absolute maximum amount of memory bytes that the TCP stack can allocate for its needs. |
Cutoff Threshold | Displays the number of memory bytes allocated until the TCP memory allocation subsystem doesn’t apply memory saving mechanisms and rules. As soon as the TCP memory consumption reaches the cutoff limit, the TCP stack enters a “memory pressure” state. This state applies several important limitations that restrict memory use by incoming and transmitted packets. In practice, this means that part of the incoming packets can be discarded, and user space code is limited in its abilities to send data. |
Enable Threshold | Displays the lower boundary of TCP memory consumption, when the memory pressure state is cleared and the TCP stack can use the unlimited memory allocation approach again. |
Memory Usage | Displays the average memory consumption by the TCP/IP stack. |
Memory Pressure | Displays the maximum percentage of time that the kernel has spent under TCP memory pressure. |
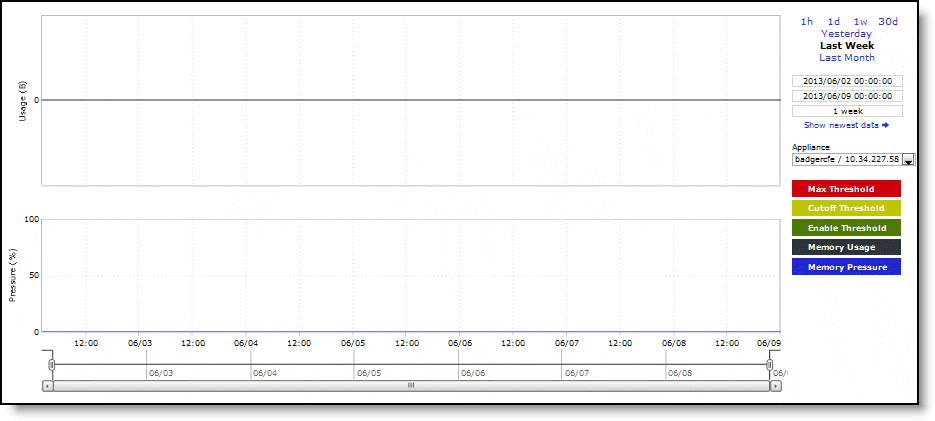
Control | Description |
Time Interval | Select a report time interval of 1 hour (1h), 1 day (1d), 1 week (1w), 30 days (30d), yesterday, last week, or last month. Time intervals that don’t apply to a particular report are dimmed. For a custom time interval, enter the start time and end time using the format yyyy/mm/dd hh:mm:ss You can quickly see the newest data and see data points as they’re added to the chart dynamically. To display the newest data, click Show newest data. |
Appliance | Select an appliance from the drop-down list. |
Control | Description |
Export To | Select either the Email or URL option from the drop-down list. |
Email Addresses | (Only displays when Email is selected.) Specify the email address of the recipient. |
Email Subject | (Only displays when Email is selected.) Specify the subject. |
Destination URL | (Only displays when URL is selected.) Specify the URL. |
Format | Select HTML, CSV, or PDF from the drop-down list. |
Per Appliance Report | Enables appliance report settings. Note: Generates graphs per appliance for HTML/PDF reports. Note: Generates one CSV per appliance for CSV reports. |
Export Now | Select Export Now and click Export to start the export immediately. |
Schedule Export | Select Schedule Export and specify the start date, time, and frequency of the export. Use this format: yyyy/mm/dd hh:mm:ss |
Export | Click Export to export the configuration. |
Printable view | Displays the print menu. |


Capture use cases | Packets captured |
Interceptor without inner channel capture (lan0_0) | •All responses from the server •All GRE messages between the Interceptor and the SteelHead |
Interceptor without inner channel capture (wan0_0) | •All probe messages |
Interceptor with inner channel capture (lan0_0) | •All requests from client •All responses from the server •All GRE messages between the Interceptor and the SteelHead •All heartbeat messages between the Interceptor and the SteelHead |
Interceptor with inner channel capture (wan0_0) | •All packets from client •All responses from the server •All probe messages |
SteelHead (local to the Interceptor) without inner channel capture (wan0_0) | •All requests from client •All responses from the server •All GRE messages between the Interceptor and the SteelHead |
SteelHead (local to the Interceptor) with inner channel capture (wan0_0) | •All requests from client •All responses from the server •All GRE messages between the Interceptor and the SteelHead •All heartbeat messages between the Interceptor and the SteelHead |
SteelHead not local to the Interceptor | No option to specify the location of the Interceptor (client/server). You can only capture traffic between SteelHead IP addresses in a comma separated list. |
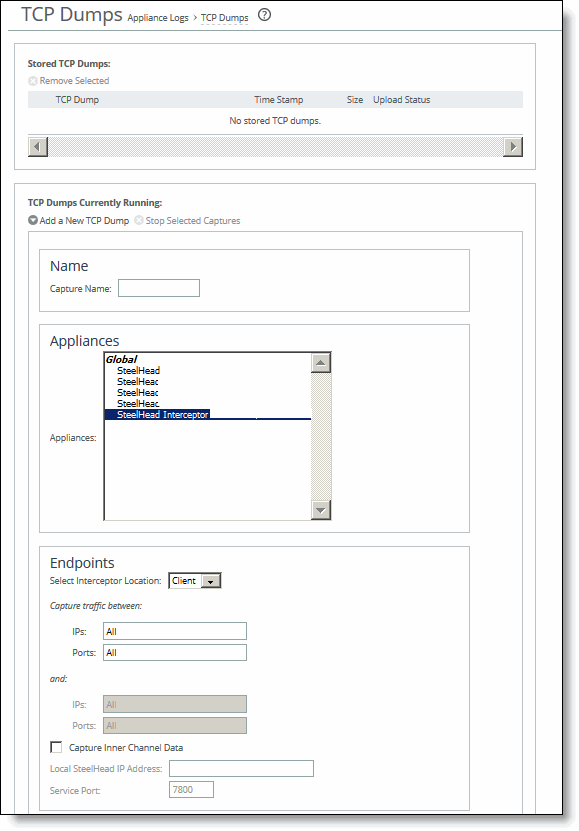
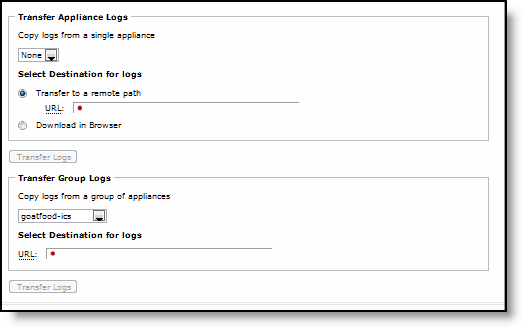
Control | Description |
Add a New TCP Dump | Displays the controls for creating a TCP trace dump. |
Capture Name | Specify the name of the capture file. Use a unique filename to prevent overwriting an existing TCP dump. The default filename uses this format: <hostname>_<interface>_<time-stamp>.cap Where <hostname> is the hostname of the SCC, <interface> is the name of the interface selected for the trace (for example, lan0_0, wan0_0), and <time-stamp> is in the yyyy/mm/dd hh:mm:ss format. If this trace dump relates to an open Riverbed Support case, specify the capture filename case_<number> where <number> is your Riverbed Support case number: for example, case_12345. Note: The .cap file extension isn’t included with the filename when it appears in the capture queue. |
Appliances | Select an appliance from the list. The SCC displays Interceptors, SteelHeads, and SteelHeads that are local to the Interceptor. If you select an Interceptor appliance or a SteelHead that is local to the Interceptor, the Endpoints section displays the Select Interceptor Location: Client/Server option so that you can capture data based on the location of the Interceptor in your network. If you select an appliance that isn’t local to the Interceptor the page displays only the Endpoints option for SteelHead deployments for capturing packets between endpoints. |
Endpoints (SteelHead deployments) | Specify source and destination IP addresses and corresponding ports to capture packets between endpoints. For example, specify the client-side IP addresses and server-side addresses to capture packets between these endpoints. Capture traffic between: •IPs - Specify All to capture all IP addresses on one side of the network or specify particular IP addresses separated by commas. You can specify IPv4 or IPv6 addresses. The default setting is All. •Ports - Specify All to capture all corresponding ports or specify particular ports separated by commas. The default setting is All. —and— •IPs - Specify All to capture all IP addresses on the other side of the network or specify particular IP addresses separated by commas. You can specify IPv4 or IPv6 addresses. The default setting is All. •Ports - Specify All to capture all corresponding ports or specify particular ports separated by commas. The default setting is All. Note: To capture traffic flowing in only one direction or to enter a custom command, use the CLI tcpdump command. For details, see the Riverbed Command-Line Interface Reference Manual. |
Endpoints (Interceptor clusters) | Select Interceptor Location - Select either Client or Server from the drop-down list. Your choice determines the endpoints (that is, IP addresses) that you can specify. If you select Client: •IPs - Specify All to capture all the client-side endpoints or specify one or more IP addresses separated by commas. Specify client-side addresses only. You can specify IPv4 or IPv6 addresses. The default setting is All. •Ports - Specify All to capture all corresponding ports or specify one or more ports separated by commas. The default setting is All. If you select Server: •IPs - Either specify All to capture all server-side endpoints or specify one or more IP addresses separated by commas. Specify client-side addresses only. You can specify IPv4 or IPv6 addresses. The default setting is All. •Ports - Specify All to capture all corresponding ports or specify one or more ports separated by commas. The default setting is All. •Capture Inner Channel Data - Captures all inner channel requests between the endpoints. The default setting is off. •Appliance IP address - Specify the in-path IP address of the local SteelHead. •Service Port - Specify the service port of the in-path local SteelHead. The default service port number is 7800. |
Capture Interfaces | Captures packet traces on the selected interfaces. You can select all interfaces or a base or in-path interface. The default setting is none. You must specify a capture interface. If you select several interfaces at a time, the data is automatically placed into separate capture files. When path selection is enabled, we recommend that you collect packet traces on all LAN and WAN interfaces. |
Capture Parameters | These parameters let you capture information about dot1q VLAN traffic. You can match traffic based on VLAN-tagged or untagged packets, or both. You can also filter by port number or host IP address and include or exclude ARP packets. Select one of these parameters for capturing VLAN packets: •Capture Untagged Traffic Only - Select this option for these captures: –All untagged VLAN traffic. –Untagged 7850 traffic and ARP packets. You must also specify or arp in the custom flags field in this page. –Only untagged ARP packets. You must also specify and arp in the custom flags field in this page. •Capture VLAN-Tagged Traffic Only - Select this option for these captures: –Only VLAN-tagged traffic. –VLAN-tagged packets with host 10.11.0.6 traffic and ARP packets. You must also specify 10.11.0.6 in the IPs field, and specify or arp in the custom flags field in this page. –VLAN-tagged ARP packets only. You must also specify and arp in the custom flags field in this page. •Capture both VLAN and Untagged Traffic - Select this option for these captures: –All VLAN traffic. –Both tagged and untagged 7850 traffic and ARP packets. You must also specify these values in the custom flags field in this page: (port 7850 or arp) or (vlan and (port 7850 or arp)) –Both tagged and untagged 7850 traffic only. You must also specify 7850 in one of the port fields in this page. No custom flags are required. –Both tagged and untagged ARP packets. You must also specify these values in the custom flags field in this page: (arp) or (vlan and arp) |
Capture Duration (Seconds) | Specify a positive integer to set how long the capture runs, in seconds. The default value is 30. Specify 0 or continuous to initiate a continuous trace. For continuous capture, we recommend specifying a maximum capture size and a nonzero rotate file number to limit the size of the TCP dump. |
Maximum Capture Size | Specify the maximum capture file size in megabytes. The default value is 100. After the file reaches the maximum capture size, TCP dump starts writing capture data into the next file, limited by the Number of Files to Rotate field. We recommend a maximum capture file size of 1024 MB (1 GB). |
Buffer Size | Optionally, specify the maximum amount of data, in kilobytes, allowed to queue while awaiting processing by the capture file. The default value is 154 kilobytes. |
Snap Length (bytes) | Optionally, select the snap length value for the capture file or specify a custom value. The snap length equals the number of bytes the report captures for each packet. Having a snap length smaller than the maximum packet size on the network enables you to store more packets, but you might not be able to inspect the full packet content. Select 65535 for a full packet capture (recommended for CIFS, MAPI, and SSL captures). The default value is 1518 bytes. When using jumbo frames, we recommend selecting 9018. The default custom value is 16383 bytes. |
Number of Files to Rotate | Specify how many capture files to keep for each interface before overwriting the oldest file. To stop file rotation, you can specify 0; however, we recommend rotating files, because stopping the rotation can fill the disk partition. This control limits the number of files created to the specified number and begins overwriting files from the beginning, thus creating a rotating buffer. The default value is 5. The maximum value is 2147483647. |
Custom Flags | Specify custom flags as additional statements within the filter expression. Custom flags are added to the end of the expression created from the Endpoints fields and the Capture Parameters radio buttons (pertaining to VLANs). If you require an “and” statement between the expression created from other fields and the expression that you are entering in the custom flags field, you must include the “and” statement at the start of the custom flags field. Do not use host, src, or dst statements in the custom flags field. Although it is possible in trivial cases to get these statements to start without a syntax error, they don’t capture GRE-encapsulated packets that some modes of SteelHead communications use, such as WCCP deployments or Interceptor connection-setup traffic. We recommend using bidirectional filters by specifying endpoints. For complete control of your filter expression, use the CLI tcpdump command. For details, see the Riverbed Command-Line Interface Reference Manual. For examples, see “Viewing appliance expiring certificates” on page 540. |
Schedule Dump | Schedules the trace dump to run at a later date. •Start Date - Specify a date to initiate the trace dump in this format: yyyy/mm/dd •Start Time - Specify a time to initiate the trace dump in this format: hh:mm:ss |
Add | Adds the TCP trace dump to the capture queue. |
Remove Selected | Under Stored TCP Dumps, select the TCP Dump check box and click Remove Selected. |
Filter purpose | Custom flag |
To capture all traffic on VLAN 10 between two specified endpoints: 1.1.1.1 and 2.2.2.2 | and vlan 10 |
To capture any packet with a SYN or an ACK | tcp[tcpflags] & (tcp-syn|tcp-ack) != 0 |
To capture any packet with a SYN | tcp[tcpflags] & (tcp-syn) != 0 -or- tcp[13] & 2 == 2 |
To capture any SYN to or from host 1.1.1.1 | and (tcp[tcpflags] & (tcp-syn) != 0) -or- and (tcp[13] & 2 == 2) |
Filter purpose | Custom flag |
To capture all FIN packets to or from host 2001::2002 | and (ip6[53] & 1!=0) |
To capture all IPv6 SYN packets | ip6 or proto ipv6 and (ip6[53] & 2 == 2) |
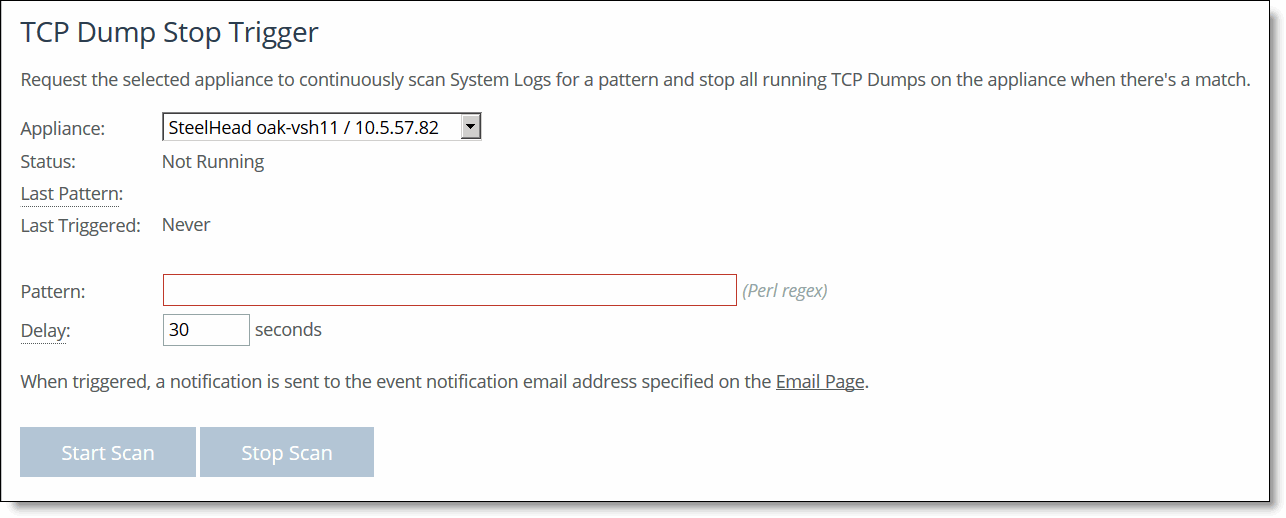
Control | Description |
Certificate Location | Displays the certificate location. |
CA/Policy/Appliance | Displays the policy and appliance. |
Certificate | Displays the certificates. |
Expiration Date | Displays the expiration date of the certificate. |
