Display Modes
There are two display modes for strip charts: normal (line) mode and stacked area mode. Normal mode is the default.
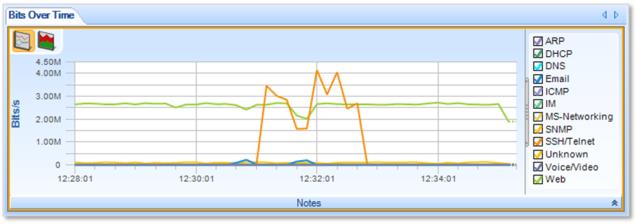
Normal strip chart
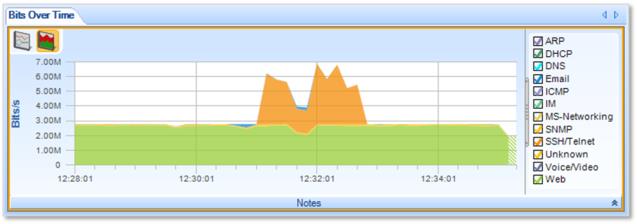
Stacked area strip chart
In the normal (line) chart, each data point’s value at a given time is plotted relative to zero. In the stacked area chart, each data point’s value at a given time is plotted relative to the value of the data in the layer below.
To switch from one mode to the other, click one of the display mode buttons in the upper left corner of the strip chart:
Alternatively, you can choose the display mode from the context menu (described below).
To display a strip chart in stacked area mode by default, set the view to stacked area mode and save it as a custom view. (Click the Save button in the View section of the Home tab.) When you drag the custom view onto your data of interest, the strip chart displays in stacked area mode.